Phishing Detection with Image Retrieval Based on Improved Texton Correlation Descriptor
2018-12-26GuoyuanLinBowenLiuPengchengXiaoMinLeiandWeiBi
Guoyuan Lin ,Bowen LiuPengcheng Xiao,Min Lei and Wei Bi
1 School of Computer Science and Technology,China University of Mining & Technology,221116,China.
2 State Κey Laboratory for Novel Software Technology hosted at Nanjing University,Nanjing,210023,China.
3 Department of Mathematics,University of Evansville,Indiana,47722,USA.
4 Information Security Center,Beijing University of Posts and Telecommunications,Beijing,100876,China.
5 SeeleTech Corporation,San Francisco,94107,USA.
6 Zabatech Corporation,Beijing,100088,China.
Abstract:Anti-detection is becoming as an emerging challenge for anti-phishing.This paper solves the threats of anti-detection from the threshold setting condition.Enough webpages are considered to complicate threshold setting condition when the threshold is settled.According to the common visual behavior which is easily attracted by the salient region of webpages,image retrieval methods based on texton correlation descriptor(TCD)are improved to obtain enough webpages which have similarity in the salient region for the images of webpages.There are two steps for improving TCD which has advantage of recognizing the salient region of images:(1)This paper proposed Weighted Euclidean Distance based on neighborhood location(NLW-Euclidean distance)and double cross windows,and combine them to solve the problems in TCD;(2)Space structure is introduced to map the image set to Euclid space so that similarity relation among images can be used to complicate threshold setting conditions.Experimental results show that the proposed method can improve the effectiveness of anti-phishing and make the system more stable,and significantly reduce the possibilities of being hacked to be used as mining systems for blockchain.
Keywords:Anti-phishing,blockchain,texton correlation descriptor,weighted euclidean distance,image retrieval.
1 Introduction
Phishing is the top threat vector for cyberattacks and causes too much economic damage.We focus on detecting phishing attacks through image processing based techniques.
Currently,other approaches have been proposed to anti-phishing,including URLs based detection [Zhang,Pan,Wang et al.(2016); Daeef,Ahmad,Yacob et al.(2016); Tahir,Asghar,Zafar et al.(2016)] and webpage anomaly-based detection methods [Moghimi and Varjani(2016)].But attackers often use images,JavaScript,and so forth,to bypass the anti-phishing system [Aleroud and Zhou(2017)].Webpage anomaly-based detection methods and URLs based detection fail to detect this type of phishing webpages.Image processing based techniques can detect the embedded objects present in suspicious webpage because these techniques take the snapshot of the webpage and compare it with the corresponding legitimate webpage.
In most of detecting phishing methods,adjusting the appropriate threshold to detect a maximum number of phishing websites is a common way in phishing detection [Haruta,Asahina and Sasase(2017)].The condition of threshold setting,only two websites that are the detecting website and the corresponding legitimate website which are compared when the threshold is determined,in most methods of detecting phishing is simply and the phishers can easily discover vulnerabilities to realize anti-detection.They can reduce the similarity between the detecting website and the corresponding legitimate website under the assurance of visually to mislead netizens.More websites are used to compare with detecting website to deal with this problem in this paper.
Under the circumstances of using image processing based techniques to detect phishing,image retrieval is considered to get more websites to be compared with detecting website.When a webpage is in the eyes of users,users are attracted to the salient region of the web-page and make a decision whether the webpage is trustworthy [Canfield and Fischhoff(2018)].According to this,extracting the salient region when the webpage is switched into image can reduce the workload and make phishing detection be in human behavior.Wu et al.[Wu,Liu and Feng(2016)] proposed a method of image retrieval based on TCD.TCD has the advantage of extracting image salient region over other image retrieval methods.So TCD is considered to be applied into phishing detection.
Our proposed method firstly improves TCD to better depict the salient region of images and then makes use of image retrieval based on improved TCD to obtain enough webpages that have similarity in the terms of salient region which then is switched into images.Finally,similarity matrix is introduced to deal with the features produced from improved TCD of images.In the way,our proposed method solves the problem of thresholds mentioned above.
The contributions of this paper are as follows:(1)Our proposed method which is different from other methods obtains enough webpages which have similarity in the aspect of salient region to solve the threats of anti-detection from the view of complicating threshold setting conditions.(2)Two disadvantages of TCD are proposed and solved.Firstly,we propose new strategies to select neighborhoods and compute color difference to solve one disadvantage of TCD which has the lack of coping with the correlation between the number of features and their location.And then the statics on correlation is improved.(3)Secondly similarity matrix is introduced to solve the other one disadvantage of TCD which neglects the similarity relation among images.
The rest of this paper is organized as follows.Section 2 introduces the basic principle of the TCD.In Section 3,the improved TCD is described and applied to detect phishing websites.Experiments and analyzes are shown in Section 4.Conclusion and future work are in Section 5.
2 Basic principle of TCD
There are three steps followed to generate TCD:1)Detecting the low-level features(color value and local binary patterns)of pixels to generate color or texture uniform regions which contain discriminative information of images; 2)Color difference feature and texton frequency feature are used to respectively character contrast and spatial structure information in uniform regions; 3)TCD is generated by combining these two features.
The TCD consist of follow two vectors,(1)HCwhich represents color feature generated in color uniform regions,(2)HTwhich represents texture feature generated in texture uniform regions.Due to significance of HCand HTare different,they should be weighted when combined to represent TCD and is expressed in Eq.(1).

α and β respectively denote weight coefficient of HCand HT.
3 TCSSD and applied to detect phishing
3.1 New strategies to select neighborhoods and compute color difference
In the process of analyzing uniform regions in the TCD,HSV color space is switched to Cartesian coordinates HcScVcto make statistics on feature of color difference.In the HcScVc,the color difference diis computed with Euclidean Distance and expressed in Eq.(2):

The 3X3 windows is applied to select neighborhoods giof center pixel gmand thus the value domain of the number i is from 1 to 7.

The DTC(CHk(gm))expressed in Eq.(3)is the sum of color difference between the central pixel gmand every neighborhood pixel giwhich has the same structure CHk(gm)with gm.δc(gm,gi)is expressed in Eq.(4):

The method fails to deal with the correlation between the number of the feature and its location as is described in Fig.1 bellow:
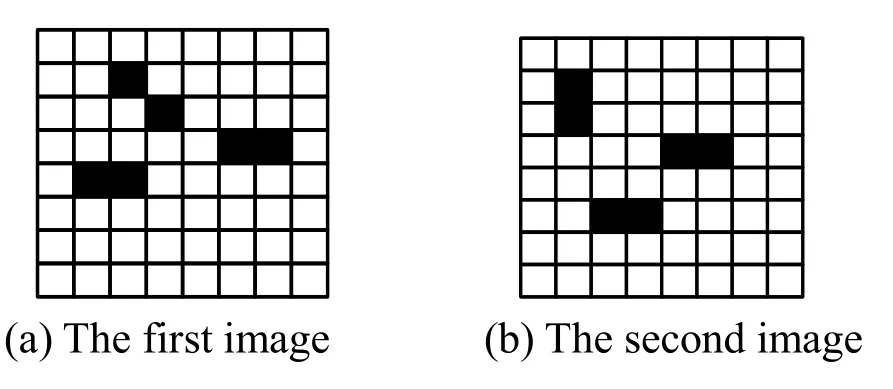
Figure 1:Different distribution and same color difference
In Fig.1,assuming that black square is the feature CHkto be counted.The value of color difference between the same features is d1and different features is d2.According to Eq.(6),is obtained in Fig.1(a)andis obtained in Fig.1(b).The value of two(CHk)is same but they should be different because black squares in Fig.1(a)and Fig.1(b)have different distribution.In order to solve this problem,weighted color difference is proposed.
Assuming that color difference,di,between the gmand giis the same.In this case,g0represents the neighborhood pixel right to the center pixel and the i increases with the clockwise under the 3×3 windows.The weighted color difference dwiis expressed in Eq.(7).

In Eq.(7),The range of values for i is 0 to 7.
In the way above,there are a total of 8 kinds of neighborhood location concluded and showed in Fig.2.
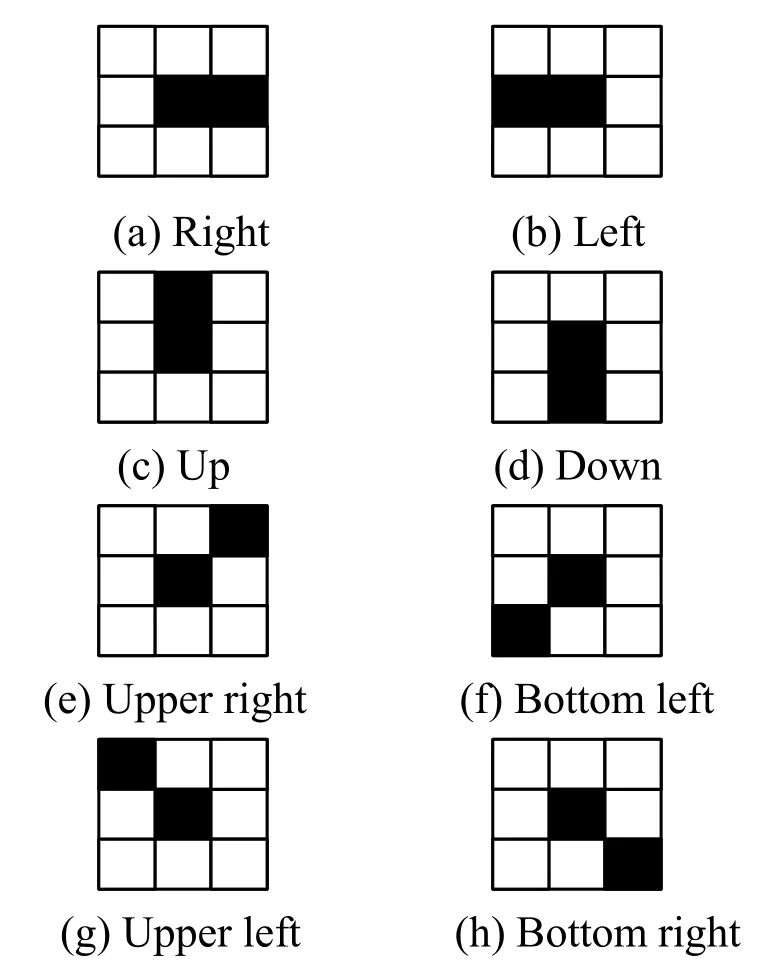
Figure 2:8 kinds of neighborhood
And then,value of DTCin Figs.2(a)-2(h)is computed and showed in Tab.1.From the Tab.1,the value of DTCcan be classified into 4 classes and every class has the same value of DTC.So counting up the value of DTCcan be regarded as counting up the four kinds of relative position.

Table 1:Value of DTC in Fig.2
Let ai(i=1,2,…,n)be the value of DTCcorrespond to n kinds of relative location.A mathematical model following described is proposed to find the regular of ai.∀k1,k2,…,kn,m1,m2,…,mn,∃ai(i=1,2,…,n),always stands up and thenthe value of kiis different from the value of mi.The kiand the miis the number of the n kinds of relative location.In the terms of n=4,the value of aicomputed from the model above is a solution of the problem mentioned under the strategy of 3×3 windows.It is difficult to find a group aiwhen the n equals 4,but easy to find a relationship between a1and a2,a1≠a2,when the n equals 2.
The number of neighborhoods can be inferred as 4 from the situation of n=2 and thus double cross windows,cross-window and diagonal cross-window,are proposed.In the 3×3 windows,8 neighborhood pixels are selected.In double cross windows,neighborhood pixels,four neighborhood pixels above,below,to the left,and to the right of center pixel,are selected under the cross-window and the rest of the 8 neighborhood pixels are selected under the diagonal cross-window.
Two mappings,presented in Tab.2,are proposed to make the following work convenient.The first mapping is between angle θ which represents the angle between the neighborhood pixels and center pixel,and the image number in Fig.2.The second mapping is between the θ and the function f(θ).

Table 2:Two mappings
Based on the analysis above,NLW-Euclidean distance is described as follow.
Let F(x,y)be the color image,and then its low-level features image is CHk(x,y)(k=C,T)which contains the CHC(x,y),representing the quantized color image,and the CHT(x,y),representing the LBP threshold image.On the basis of double cross windows,NLW-Euclidean distance is proposed to compute the color difference df(θ)which is between the center pixel,gm=(xm,ym),and the neighborhood pixel,gf(θ)=(xf(θ),yf(θ)),in the Cartesian coordinates HcScVc.And the gf(θ)has the distance as D and angle as θ from the center pixel.The value of D is 1 because of the 3X3 windows.Let CHk(gi)be the structure of the pixel gi.The df(θ)is expressed in Eq.(8).

The num(f(θ))in the Eq.(8)is expressed in Tab.3.On the basis of the mathematical model mentioned above,the value of num(f(θ))when the f(θ)equals 1 or 2 is different from the value when f(θ)equals 3 or 4.In the same way,the value of num(f(θ))when f(θ)equals 5 or 6 is different from the value when f(θ)equals 7 or 8.

Table 3:The value of num(f(θ))
3.2 Improved statics on correlation
In the TCD,the color difference feature,describing the similarity degree of low-level feature between center pixel and neighborhood pixels,and the texton frequency feature,describing the probability of the structure similarity between center pixel and neighborhood pixels,are both generated in color uniform regions or texture uniform regions.Based on method of selecting neighborhoods and computing the color difference mentioned in 3.2,the correlation statistics analyzing uniform regions is improved.
Let DTC,j(CHk(gm))(j=1,2)be the sum of color difference between the central pixel gmand every neighborhood pixel gf(θ)which has the same structure CHk(gm)with gmand represented in Eq.(9).In the Eq.(10),¯(CHk(gm))is the sum of color difference between the central pixel gmand every neighborhood pixel gf(θ)In the Eq.(9)and Eq.(10),the statistics is made under the cross-window when the j equals 1 and under the diagonal cross-window when the j equals 2.


And then,δc(gm,gf(θ))is expressed in Eq.(11).

The description about the color difference feature,the ratios of the DTC,j(CHk(gm))to¯(CHk(gm)),is represented in Eq.(12).

The CDjk(CHk(gm))only describes the correlation of color difference between pixels,and the color difference histograms,normalized histogram of(CHk(gm)),is proposed to describe the global probability of color difference to be as supplementary expressed in Eq.(13).

A method proposed by Feng et al.[Feng,Wu,Liu et al.(2015)] is adopt to fuse the advantage of CDjk(CHk(gm))and CFjk(CHk(gm)),and the fusion is expressed in the Eq.(14).

Not only the color difference spatial distribution of the pixels which is adjacent but also the global probability of the color difference is considered in theAccording to the Eq.(14),the feature description of Fig.1(a)is that:and the feature description of Fig.1(b)is that:The(CHk)of Fig.1(a)is different from the Fig.1(b)and the(CHk)of Fig.1(a)is different from the Fig.1(b).This shows that the two images in Fig.1 is distinguished.
The improved texton frequency feature is expressed in the next description.Let thebe as the number of pixels whose structure is CHk(gm)in the uniform regions,and the corresponding normalized histogram is defined in the Eq.(15).


In the Eq.(17),the DFc,jis the probability of neighborhood pixel gf(θ)which has the same structure CHk(gm)with the center pixel gm.Theis the frequency of all neighborhood pixels under the cross-window or diagonal cross-window which have the same structure with the center pixel.The frequency feature is expressed in the Eq.(18)via the fusion method proposed by Feng et al.[Feng,Wu,Liu et al.(2015)].

The advantages of the histogram and the correlation statics are fused in the Eq.(18).8 kinds of feature description are obtained from the analysis above and is showed in the Tab.4.

Table 4:8 kinds of feature descriptions
3.3 Phishing with the TCSSD
In terms of detecting phishing websites,two kinds of image libraries are established.The first image library is legal website image library which is consist of the screenshots of the homepage of legal websites and the second image library is the phishing websites image library which is consist of the screenshots of the phishing websites detected before.
The website homepage will be identified in detecting phishing websites.It is found that phishers often lure victims in the visual similarity of website homepages.Under the guarantee on accuracy,the workload will be reduced when only homepages are detected.At the time of recognizing sites,identifying screenshot image will be compared with the images from the legal website image library and phishing websites image library.

Table 5:Symbol set
On the basis of this strategy above,according to the method proposed by Qian et al.[Qian,Li,Liang et al.(2016)] and the method proposed by Guo et al.[Guo,Yang and Liang(2016)],the identifying screenshot images are numbered.Symbol set is established and expressed in the Tab.5.
1)The features obtained in the color uniform regions or the texture uniform regions have different significance.Assuming the μ is the weight of features obtained in the color uniform regions and the ϑ is the weight of features obtained in the texture uniform regions.It is concluded that μ+ϑ=1;
2)The color difference features and texton frequency features obtained respectively from the color uniform regions or texture uniform regions under the double cross windows;
3)It is concluded that the weights,β,β1,ε and ε1,equal μ and the other weights,γ,γ1,ρ and ρ1,equal ϑ.
Similarity among images is computed between the image symbol object in pairs and expressed in the Eq.(19).

In the Eq.(19),τs(mp,mq)is the expressed in the Eq.(20).

And then,the following similarity matrix T of Tp,qis obtained;
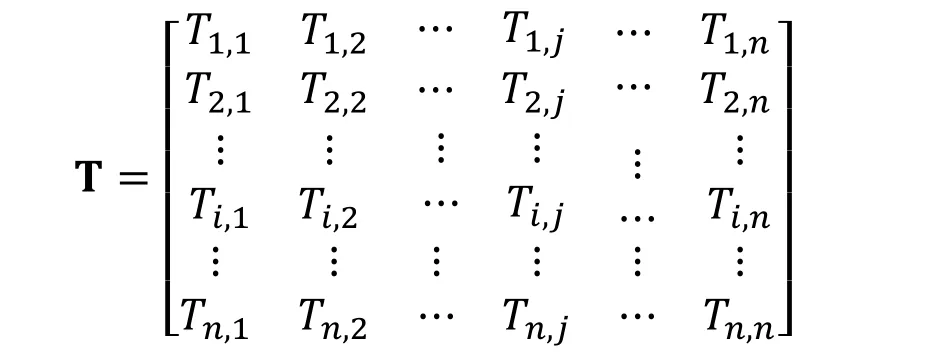
Every column of similar matrix T is a new dimension of the identifying website images,and every row of the similar matrix T,Ti=(Ti,1,Ti,2…Ti,n)(i∈(1,n)),is the improved TCD,texton correlation based on space structure descriptor(TCSSD),of every image in the set M.The first row of similar matrix T,T1=(T1,1,T1,2…T1,n),is the TCSSD of identifying website image.And Eq.(21)is proposed to compute the similarity between the identifying website image and the other images in the set M.

In the Eq.(21),the value of cos(T1,Ts)is used to quantize the probability the identifying website is phishing website and larger the value is,the higher the probability is.For the precision of phishing detection,a threshold ω of the cos(T1,Ts)should be set.
4 Experiments
4.1 Determine experiment parameters
The weights,μ and ϑ,and the threshold ω can be determined independently because the precision of the retrieval based on TCSSD has nothing to do with the threshold ω and then μ and ϑ can be determined firstly.
The Corel-1000 image set which is consist of 1000 images which are classified into 10 kinds and every kind has 100 images is used to be as the experimental image set.Every image from the Corel-1000 image set will be as sample to retrieve kindred images and the precision of retrieving is expressed in the Eq.(22).

In the Eq.(22),the times of retrieving is n,the Ncqis the number of the kindred images in the qth time and the Nrqis the number of images retrieved in the time qth time.In order to improve the speed of experiment,we use the cloud computing environment mentioned by Lin et al.[Lin,Bie,Lei et al.(2014); Lin,Wang,Bie et al.(2014)].
The final RPre is the average of all the RPre under the same combination of μ and ϑ.In this way,lots of RPre is computed under the different combination of μ and ϑ.The result is showed in the Tab.6.
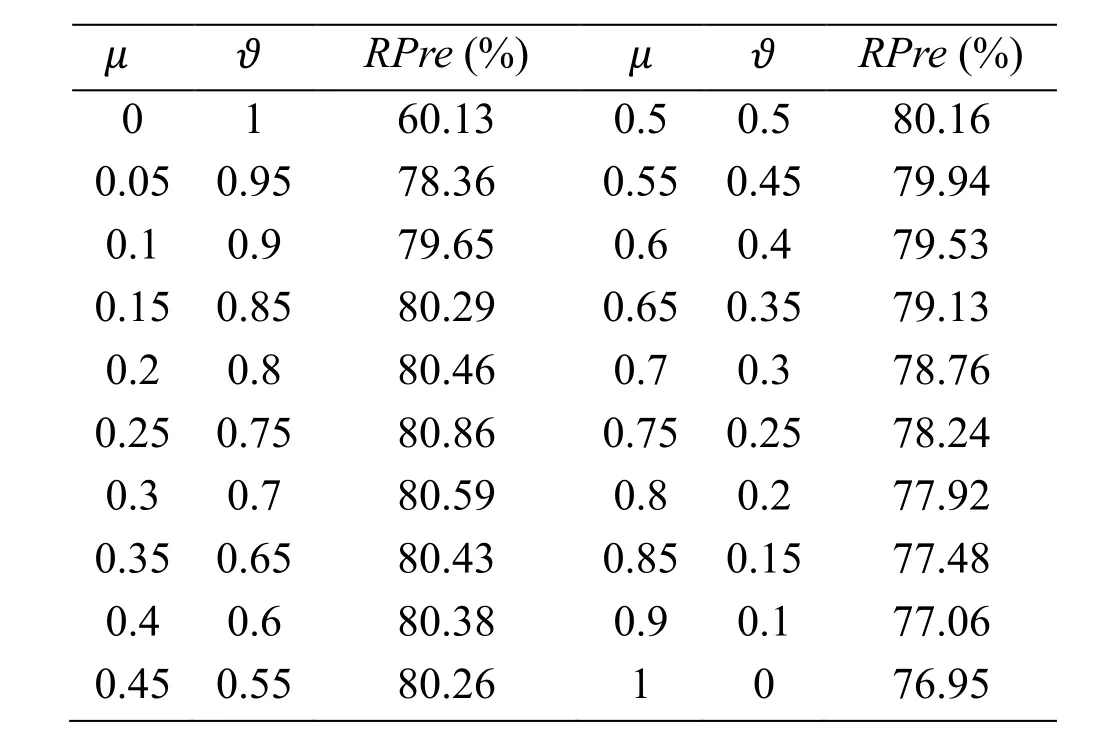
Table 6:RPre and corresponding combination of μ and ϑ
From the Tab.6,the highest RPre is 80.86% and the corresponding combination of μ and ϑ is 0.25 and 0.75.It is concluded that the effect of retrieval is the best when the μ equals 0.25 and thus 0.25 and 0.75 is selected as the weights μ and ϑ.
The threshold ω can be determined under the μ and ϑ selected above and then there are two steps to be adopt:the first step is that the screenshots of legal website homepages and phishing website homepages are obtained; the second step is that precision of phishing detection,PRE,expressed in the Eq.(23)is computed when the threshold is adjusted.

In the Eq.(23),the Npis the number of the websites which is detected as phishing website correctly and the Nwis the number of all websites detected.The result of the phishing detection under the different ω is showed in the Fig.3.
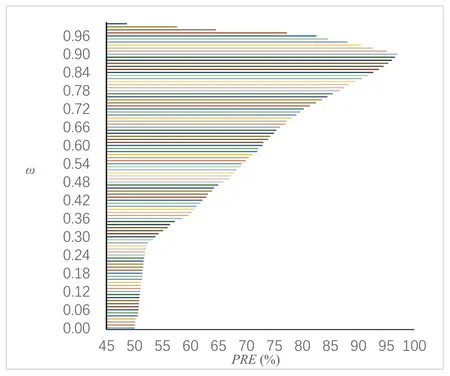
Figure 3:The PRE under different ω
When the ω is 0.90,the PRE is the highest.The PRE would be reduced due to two reasons.On the one hand,it is concluded that the legal websites could be detected as phishing websites when the ω is less than 0.90.On the other hand,it is concluded that the phishing websites could be detected as legal websites when the ω is greater than 0.90.To detect more phishing websites correctly,the ω is selected as 0.90.
4.2 Comparison
The test set is composed of two kinds of websites,one is the 3000 legitimate websites and the other one is 5000 phishing websites,from June 5 to June 20,2017.The phishing websites which are obtained from PhishTank archive are verified and still online during this period.The legitimate websites are collected from Alexa.We refined Alexa to return only the top 500 sites on the web by category [Chiew,Chang,Sze et al.(2015)].Categories include but are not limited to arts,business,health,recreation,shopping,and sports.
To verify the effectiveness of the method of detecting phishing websites based on TCSSD,the rate of correct discrimination,TF expressed in the Eq.(24),the miscarriage rate,EF expressed in the Eq.(25),and the missing rate,LF expressed in the Eq.(26)are proposed to quantify the effectiveness.

The s is the times of phishing detection,Fp-pis the times that the phishing websites are detected correctly,Fl-pis the times that the legal websites are detected as the phishing websites and Fp-lis the times that the phishing websites are detected as legal websites.
The result of comparison on effectiveness between the TCSSD and other methods,a method to detect phishing web pages based on Hungarian matching algorithm [Zhang,Zhou,Xu et al.(2010)],a method of combining local and global features of webpages[Zhou,Zhang,Xiao et al.(2014)] and a method of using HOG descriptors to detect phishing websites [Bozkir and Sezer(2016)] is showed in Tab.7.In order to verify that TCSSD is more suitable than TCD to be applied into phishing detection,TCD is applied to detect phishing and compared with TCSSD.

Table 7:Comparison on effectiveness between the TCSSD and other method
In the Tab.7,the TF of TCSSD is 96.67% and is higher than the TF of any method including TCD,95.34%,96.47%,95.63% and 95.96%.In the Tab.7 the EF and the LF of TCSSD are the lowest value,1.35% and 1.98%.The reason is that the TCSSD not only has a better precision in retrieving images but also the similarity among images in image set is considered in TCSSD.It is concluded that the TCSSD has more satisfying effectiveness applied to detect phishing and is more suitable than TCD.
SEF is proposed to express the detection speed of those methods and expressed in the Eq.(27).

In the Eq.(27),the Notℎertis the number of phishing websites which is detected correctly with methods except the TCSSD within t hours and the NTCSSDtis the number of phishing websites which is detected correctly with TCSSD within t h.
In experiment,the detection speed is computed in various duration and the result is showed in Tab.8.
In the Tab.8,different duration is selected to observe the relationship between the detection speed and the running time of those methods.If the SEF of a method is below 1,it will be concluded that TCSSD has a better detection speed,or vice versa.As we can see,the detection speed of the method in Tab.8 is lower than the TCSSD under the situation that the corresponding SEF is below 1.The SEF of any method in Tab.8 is below 1 in any duration and thus the detection speed of TCSSD can be regarded as the fastest.With the increase of duration,the SEF of any method decreases and thus TCSSD also has a satisfactory stability.
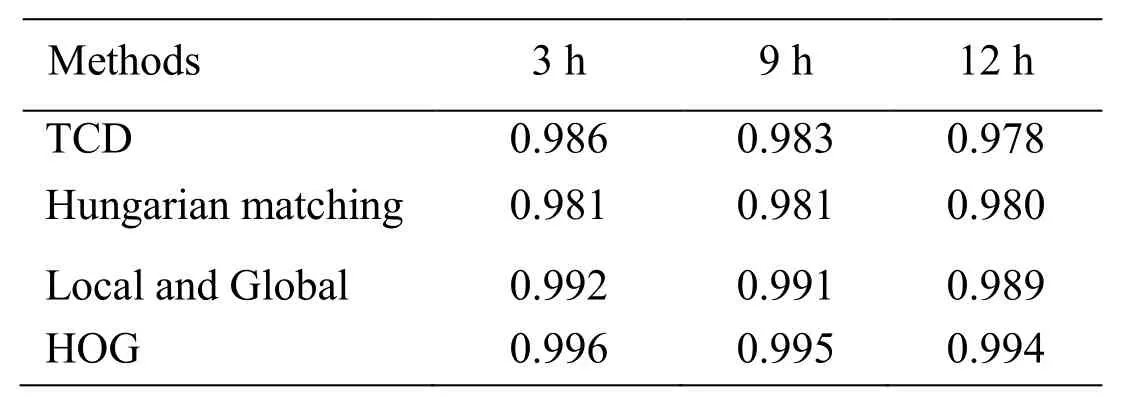
Table 8:The SEF of those methods of phishing
Based on the experiments,the TCSSD proposed in this paper has more satisfying stability and effectiveness in phishing detection.
5 Conclusion and expectation
In this paper,a new method of image retrieval is proposed and applied to detect phishing.The proposed approach realizes the combination of image retrieval and phishing detection to solve the problem of anti-detection.Experimental results show that the accuracy of phishing detection and efficiency are improved compared to the other methods used in the experiment.The theoretical analysis and experiments verified that TCSSD has satisfactory stability and high effectiveness in phishing detection.
The proposed method still has some disadvantages.Further studies should be focused on the following aspects:1)Storage strategy and index method should be studied to cope with the increasing amount of images to be detected; 2)In the regional characteristics of statistical consistency,the algorithm of image rotation invariance needs to be further improved; 3)Efficient methods to deal with the websites also needs to be studied to reduce the workload.
Acknowledgment:The work reported in this paper was supported by the Joint research project of Jiangsu Province under Grant No.BY2016026-04,the Opening Project of State Κey Laboratory for Novel Software Technology of Nanjing University under Grant No.ΚFΚT2018B27,the National Natural Science Foundation for Young Scientists of China under Grant No.61303263,and the Jiangsu Provincial Research Foundation for Basic Research(Natural Science Foundation)under Grant No.BΚ20150201.
杂志排行
Computers Materials&Continua的其它文章
- Natural Language Semantic Construction Based on CloudDatabase
- A Method of Identifying Thunderstorm Clouds in Satellite Cloud Image Based on Clustering
- Seed Selection for Data Offloading Based on Social and Interest Graphs
- Dynamic Proofs of Retrievability Based on Partitioning-Based Square Root Oblivious RAM
- A Novel Ensemble Learning Algorithm Based on D-S Evidence Theory for IoT Security
- A Virtual Puncture Surgery System Based on Multi-Layer Soft Tissue and Force Mesh
