Study on the Liquefaction Properties of Silt at Yellow River Delta
2018-12-20LIUTaoZHOULeiandCHENXuguang
LIU Tao, ZHOU Lei, and CHEN Xuguang, 2)
Study on the Liquefaction Properties of Silt at Yellow River Delta
LIU Tao1), 2), *, ZHOU Lei1), and CHEN Xuguang1), 2)
1),,266100,2),,266061,
The seabed of the Yellow River Delta is formed by the rapid deposition of sediments from the Yellow River. Recent researches have shown that the geological hazards in the Yellow River Delta are mainly related to the liquefaction of silty seabed under cyclic loading. In this paper, based on the theory of Stokes Viscous Principle, a self-design dragging ball apparatus was used to study the fluid characteristics of liquefied and post-liquefied silt more thoroughly. Wave flume and shaking table were used to apply wave loads and vibration loads. The pore pressure, earth pressure, and moving parameters of the dragging ball were recorded during tests. The effect of cyclic loads and excess pore pressure ratio on viscosity of silty soil is discussed. The constitutive model of flow characteristics of liquefied silt is also established. The results indicate that the apparent viscosity of silty soil is much higher than sand. Cyclic loads accelerated the process of silt liquefaction, resulting in the decrease in apparent viscosity. The excess pore pressure ratio (r) has effect on silt liquefaction. When the soil had not reached the completely liquefied state (r<1), the apparent viscosity decreased with the increase of excess pore pressure ratio; when the soil had reached the completely liquefied state (r=1), the shear stress decreased with the increase of strain rate. It was determined that silty soil characterized by shear thinning can be viewed as a type of non-Newtonian fluid. The equation of the shear stress and shear strain rates was established by fitting the test data.
silt; liquefaction; fluid; dragging ball method
1 Introduction
The silty sediment of the Yellow River Delta (Fig.1) is formed by the rapid deposition of sediments from the Yellow River (Prior., 1989; Kong, 2015), with the characteristics of high sand content, high water content and under-consolidated (Yang., 2009; Liu., 2017), which could be liquefaction easily under cyclic load (Pratson, 2001; Luan, 2008; Huang., 2015; Zhang., 2016). There are many unstable geomorphological phenomena in the Yellow River Delta, such as pit collapse, landslides, and silt flow (Wang and Liu, 2016; Qi and Liu, 2017). These hazards can cause the destruction of offshore engineering facilities and the rupture of submarine pipelines. One of such example happened in the Shandong Shengli oilfield platform located in the Yellow River Delta area, which was overturned in September 7, 2010 (Fig.2). Preliminary studies suggest that these hazards are mainly related to the liquefaction of silty seabed under cyclic loading (Goh and Zhang, 2014; Zhang., 2015).
At present, most of researches related soil liquefaction to the continuous medium with viscous or plastic characteristics. Sasaki. (1992) and Towhata. (1999) conducted a series of tests using a self-design shaking table to study the mechanism of liquefaction deformation and concluded that the liquefaction of sand and fluid have very similar properties. In order to study the viscosity characteristics of liquefied sand, the liquefied sand was assumed as viscous fluid in triaxial torsional shear tests (Nishimura., 2002) and cyclic tiraxial tests (Yang., 2003). Chen. (2006) studied large liquefaction-induced sand deformations through laboratory tests and proposed a hyperbolic model to explain the stress- strain relationship of sand liquefaction. Chen. (2013) found that liquefied sand was a kind of ‘shear thinning non-Newtonian fluid’ under certain conditions. Hwang. (2006) summarized the results of previous studies on the apparent viscosity of the sand liquefaction flow. It can be found from Fig.3 that under the condition of liquefaction, the apparent dynamic viscosity of sand is mainly concentrated in the range of 1–11kPas. For marine clay, it has the characteristics of low strength, high compressibility and high sensitivity (Shen., 2013; Bo., 2015). Under the cyclic loading of the waves, the strength of clay soil was greatly reduced due to the rapid increase of pore pressure and the damage of soil internal structure (Feng and Yan, 2005).
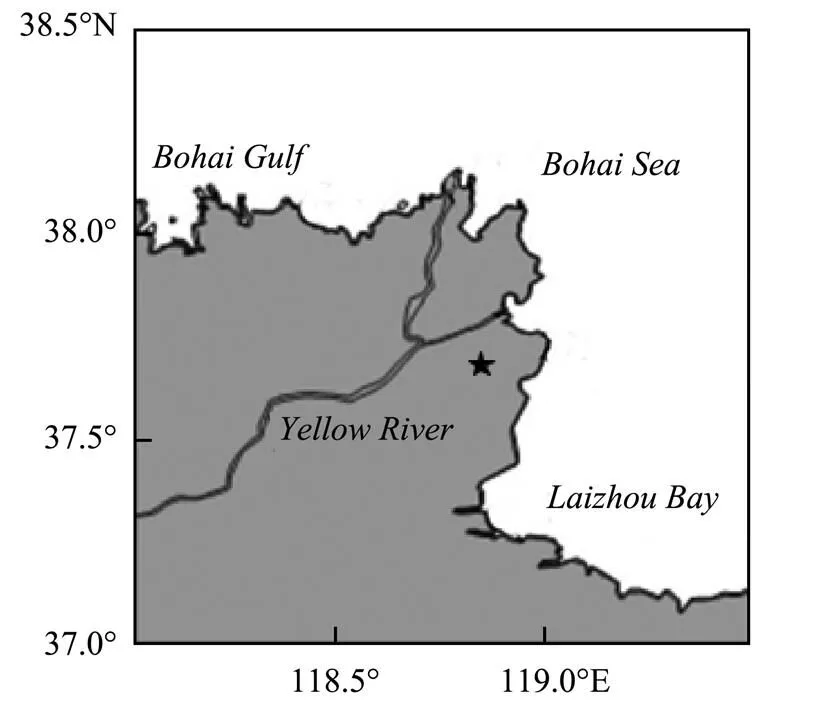
Fig.1 The map of Yellow River Delta. The location of test soils collected are indicated by star.

Fig.2 The overturned accident of Shandong Shengli Oilfield platform.
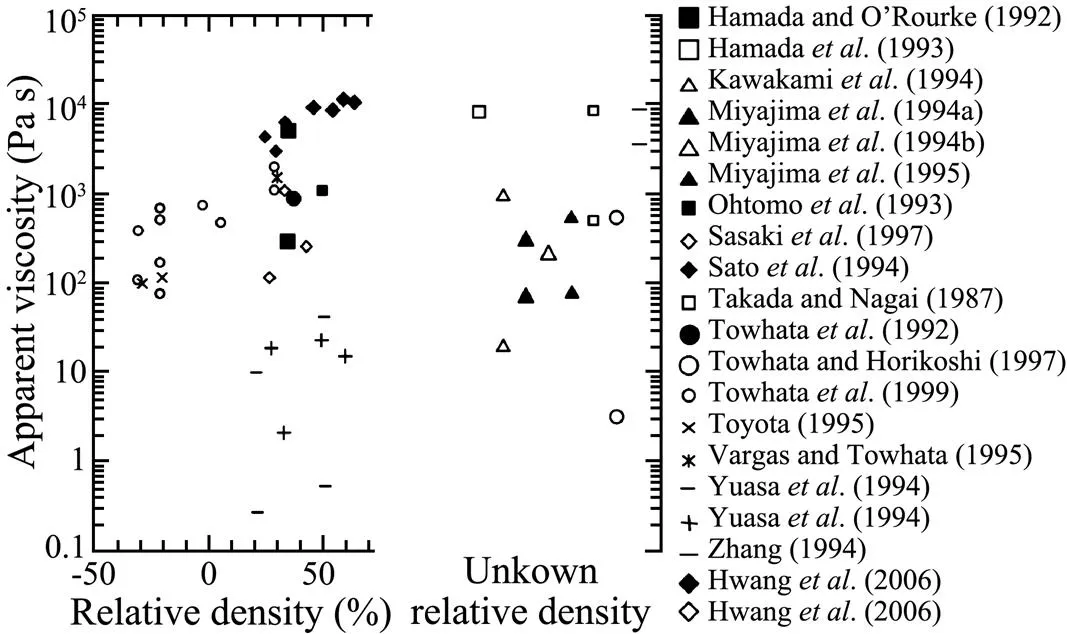
Fig.3 The viscosity of liquefied sand reported in the previous papers.
Although many researchers have studied the characteristics of soils during the liquefaction process, these studies all concerned the liquefied sand or marine clay. The study of silt properties, especially the study of rapid deposition of liquefied silt in the Yellow River Delta, have received little attention or study. Moreover, there are less systematic research results about quantitative analyses concerning the properties of silty soil under cyclic loading. As such, in this paper, based on the theory of Stokes Viscous Principle, a self-design dragging ball apparatus in wave flume and shaking table was used to study the fluid characteristics of liquefied and post- liquefied silt more thoroughly.
2 Description of the Model Test
2.1 The Test Soil Preparation
Silt samples used in tests was collected from Yellow River Delta (Fig.1). Main parameters of silt samples were shown in Table 1. The grain size distribution results (Fig.4) indicate that the test soils were silt. In order to obtain the saturated soil paste, the samples were put into a mixer mixed rapidly and evenly with the water. Ultimately, the water content of test soils was 32.0%.

Table 1 Main parameters of test soil samples
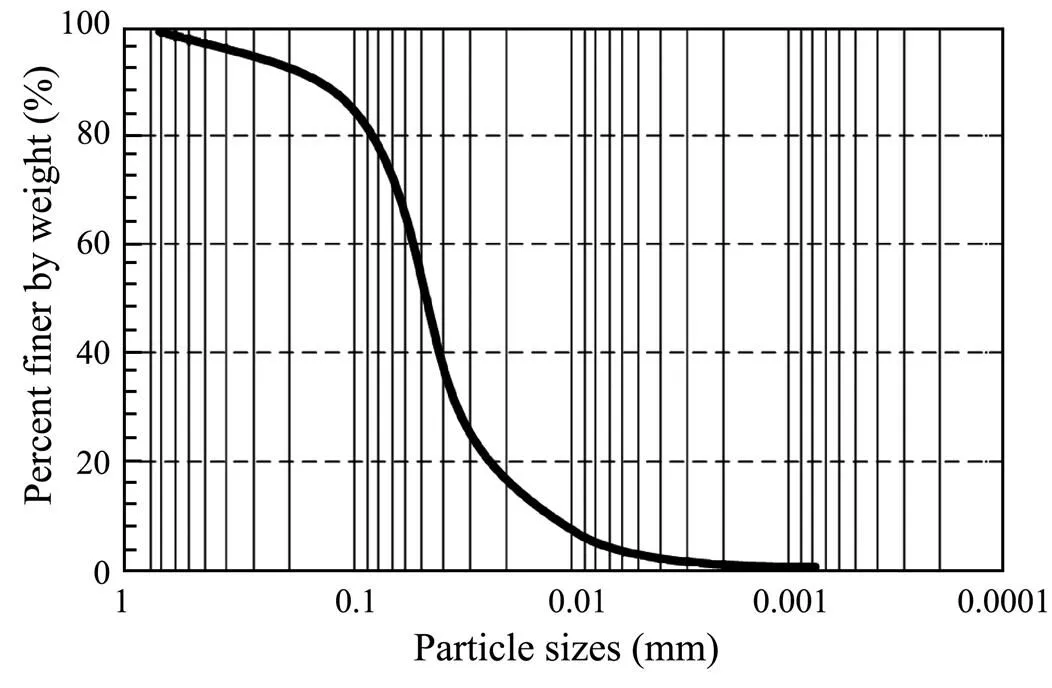
Fig.4 Particle size distribution of Yellow River silt samples.
2.2 Test Apparatus and Procedures
2.2.1 The wave flume tests
The wave flume used in this paper was 14m in length, 0.5m in width, and 1.3m in height, as shown in Fig.5. A soil bin was positioned in the middle of the wave flume. The soil bin was 2m in length and 0.5m in height, and was filled with saturated silty soil. The wave maker was positioned at one end of the flume. In order to simulate the real and practical wave behavior, the swing amplitude of the push board can be controlled by changing the frequency of the motor, which could change the wave factors. The wave absorber filled with in crushed stone blocks was positioned at the other end of the flume (opposite to the wave maker) at a ratio of 1:4. The stone blocks helped reduce the influence of wave reflections.
Based on the size of the soil bin, a dragging ball apparatus was designed to measure the viscosity of flowing soil (Fig.6a). Four fixed pulleys were arranged inside thebracket of the test apparatus, and connected the ball with wire ropes. By controlling the motor of the apparatus, the ball can be pulled along horizontal direction at a defined speed. The wire rope is connected with the force sensor and the speed sensor, which can measure the resistance value () and the velocity () of the ball. The radius (0) of the ball was 10mm, and the ball was buried at a depth of 9cm. Three earth pressure sensors of T1, T2, and T3 were installed to measure the variation of effective pressure (σ'). Pore pressure sensors of P1, P2, and P3 were used to monitor the variation of pore pressure (). As shown in Fig.6b, the earth pressure sensors T2 and pore pressure sensors P2 were buried at the sample depth with the dragging ball. And the sensors of T1, P1 were installed at the depth of 2cm, the T3, P3 at the depth of 16cm.

Fig.5 Schematic diagram of wave flume.

Fig.6 The schematic diagram of wave flume test apparatus: (a) the dragging ball apparatus; (b) layout of sensors.
Add water to wave flume until the water head is 0.4m higher than the silt bed. After applying regular wave loads to silt bed with wave height of 9.5cm, it can be observed that the depth of liquefied silt increased over time. The sensors recorded the cumulative process of pore pressure. Motor was started to drag ball for five times. When the pore pressure remained stable, furthermore, multiple sets of viscosity () data were obtained. The 10min intervals between dragging sessions were adopted in order to prevent heterogeneous silt caused by the repeated movements of the ball. In order to analyze the influence of wave on liquefaction, two regular waves with higher wave height were applied in the next two stages. Three different wave height factors (wave height, period, and velocity) were shown as in Table 2.
2.2.2 The shaking table tests
A small shaking table test were also conducted to in- vestigate the liquefaction of silt and give a quantitative explanation. The shaking table is 1m in length, and 1m in width, as shown in Fig.7a. In order to prevent the dissipation of pore pressure caused by model box deformation (after it became full of silt soil), an iron box with greater strength and less propensity for deformation was used in these tests. The model box was 60cm in length, 40cm in width, 40cm in height. Based on shaking table, the dragging ball apparatus was redesigned. The ball with radius of 10mm could be dragged by using hand winch. Before tests, pore pressure sensors P1, P2 and earth pressure sensors T1, T2 were installed in the middle of model box along longitudinal direction. The detailed spaces between sensors along depth were shown in Fig.7b, in which the earth pressure sensor T1, the pore pressure sensor P1 and the ball are at the same depth.
The silt bed is 35cm in thickness after 5 days’ consolidation. The initial value of effective pressure (σ') and pore pressure () were measured before the shaking table started to work. Because of the high vibration frequency (with frequency of 60Hz) of the shaking table, each vibration session lasted only 20s. Once the shaking table stopped working, we dragged the ball and record the resistance value () and the velocity () of the ball. The paths created by the motion of the ball can disappear during subsequent vibration sessions, which left the test results unaffected by the motion of ball relatively.

Table 2 Wave factors in different stages
2.3 Resistance of Tests
The values recorded by the force sensors not only include the resistance of the ball induced by the motion, but also the frictional resistance of the apparatus, such as the resistance between the steel wire and the pulley, the friction of the steel wire buried in silt, and the resistance between the steel wire and the axial fan-out of the step- motor. To reduce errors caused by resistance, we greased the pulley and steel wire with vaseline before testing. Additionally, the friction value of the apparatus was measured by conducting a dragging test without the ball, and then used the results as a constant for the other tests. Three measurement results of frictional resistance are shown in Table 3, and the resistance value can be considered to be 25.0N.
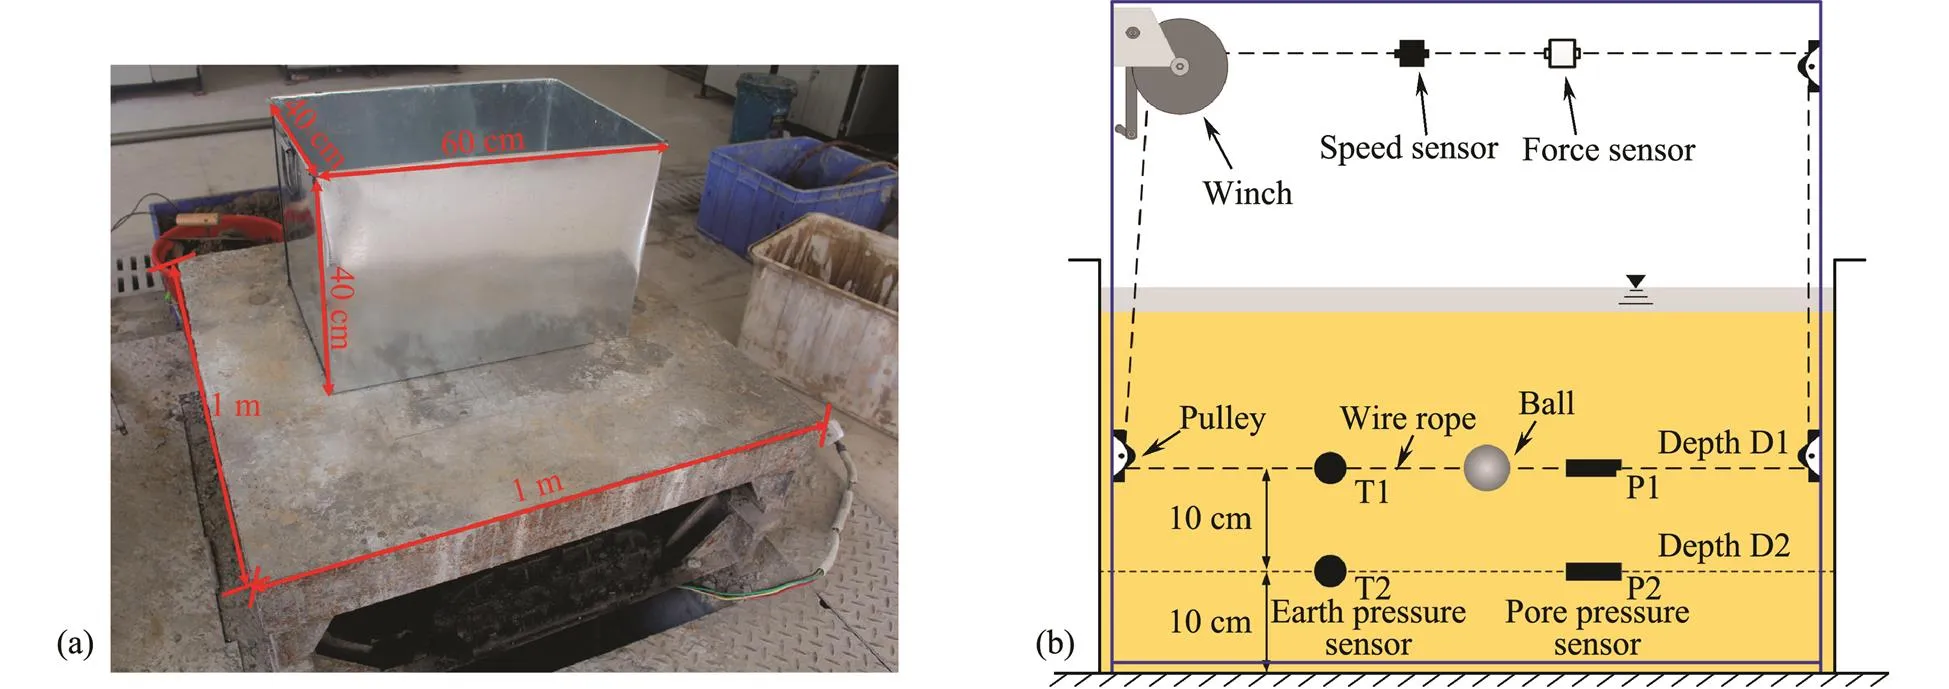
Fig.7 The schematic diagram of shaking table tests: (a) the size of test apparatus; (b) layout of sensors.

Table 3 Resistance value of dragging without a ball
3 Results and Discussion
3.1 Methods
The dragging ball apparatus was designed based on the Stokes Viscous Principle. According to this theory, the resistance (), is proportional to fluid viscosity (), the radius (0), and velocity () (Hwang., 2006):

According to Eq. (1), the apparent viscosity () were calculated.
The liquefaction state of soil is indicated by the excess pore pressure ratio (r), which could be calculated by comparing the measured value of the excess pore pressure (u) to the effective stress (σ') of the overlying soil layer:
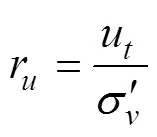
where the measure pore water pressure () minus the hydraulic pressure (u) is the excess pore pressure (u).
3.2 Results of the Wave Flume Tests
3.2.1 The development of excess pore pressure
Fig.8 depicts the development of excess pore pressures at different depths. From the graph of D2 and D3, it can be seen that the wave height has obvious effect on the excess pore pressure, and the excess pore pressure increases with the increase of wave height. Instead, the graph of D1 is different. With the application of wave loads, the excess pore pressure increases first and then decreases slowly. This is because the soil moved repeatedly with the waves, and the fine particles would be separated from the soil into water. The soil particle size would be roughened due to the loss of fine particles, and the permeability would increase, resulting in the dissipation of excess pore pressure (Zhang., 2009, 2014).
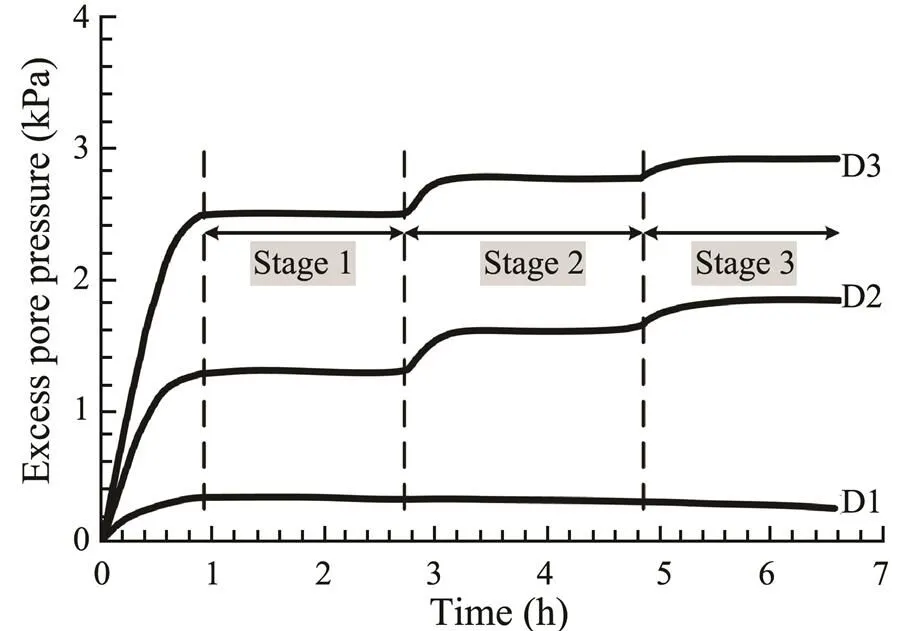
Fig.8 The development of excess pore pressure under wave loads.
3.2.2 The influence of wave loads on viscosity
Five groups of viscosity values were obtained by drag- ging ball at different velocity and different wave height. When the wave height was at 9.5cm, the apparent vis- cosity was in the range of 94–104kPas; when the wave height was at 12cm, the apparent viscosity was within the range of 80–90kPas; when the wave height was at 15cm, the apparent viscosity was within the range of 55–65kPas. The apparent viscosity had strong linear relationships with the wave height. The apparent viscosity decreased with the increasing of wave height (Fig.9).
During the process of silt liquefaction, the soil-water is in a semi-suspended state. The soil would exhibit fluid- like properties when deformation appears on it, that is, the soil has a certain viscosity. With the increase of wave height, both the magnitude and frequency of cyclic loading applied to the soil bed increase, which leads to the weakening of the cementation and the decrease of the cohesion. As a result, the apparent dynamic viscosity decreases continuously.
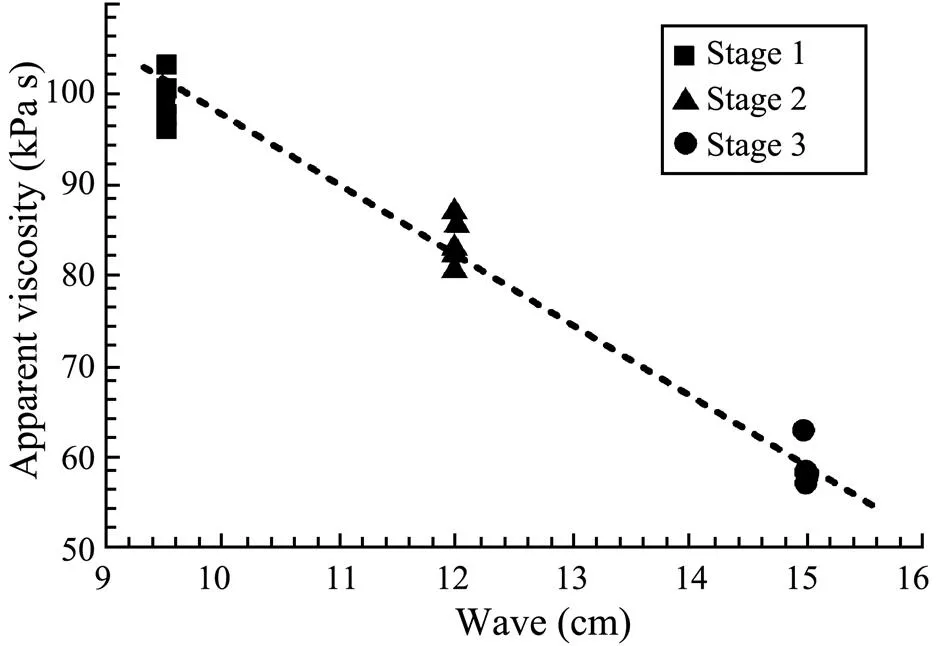
Fig.9 Relationship between wave height and viscosity.
Once the soil bed liquefied, the ball is dragged to test viscosity of silt every 10 minutes. As shown in Fig.10, in different stages the apparent viscosity values under the same wave condition all show an obvious growth tendency with time, about 10kPas numerically. During the early stage of wave application, the increase of pore pressure reduced the interaction between soil particles. However, as time passed, the silt soil under cyclic loading became compacted, and the soil began to coalesce, which revealed the slightly increase of viscosity (Zhang., 2014).
In this paper, the test data of apparent viscosity of liquefied silt could reach 57–100kPas, which is much higher than liquefied sand.
3.2.3 The influence of excess pore pressure ratio on viscosity
The excess pore pressure ratio (r) can be calculated by Eq. (2). Previous studies established that when the excess pore pressure ratio reached 0.68, the silt began to liquefy (Liu., 2007). The excess pore pressure ratio in these tests was more than 0.75, well over the amount required for the silt liquefaction, as shown in Fig.11. The excess pore pressure ratios of three stages were: 0.76–0.79, 0.80– 0.82, and 0.95–0.99 respectively. It can be found that the apparent viscosity decreased with the increase of excess pore pressure ratio. Based on this trend, it can be concluded that the apparent viscosity reached a constant value after the silt soils were fully liquefied. Moreover, the transition between liquefied and post-liquefied silt was a gradual process, and not a process of mutation.

Fig.10 Changes of viscosity over time under same wave height loads.
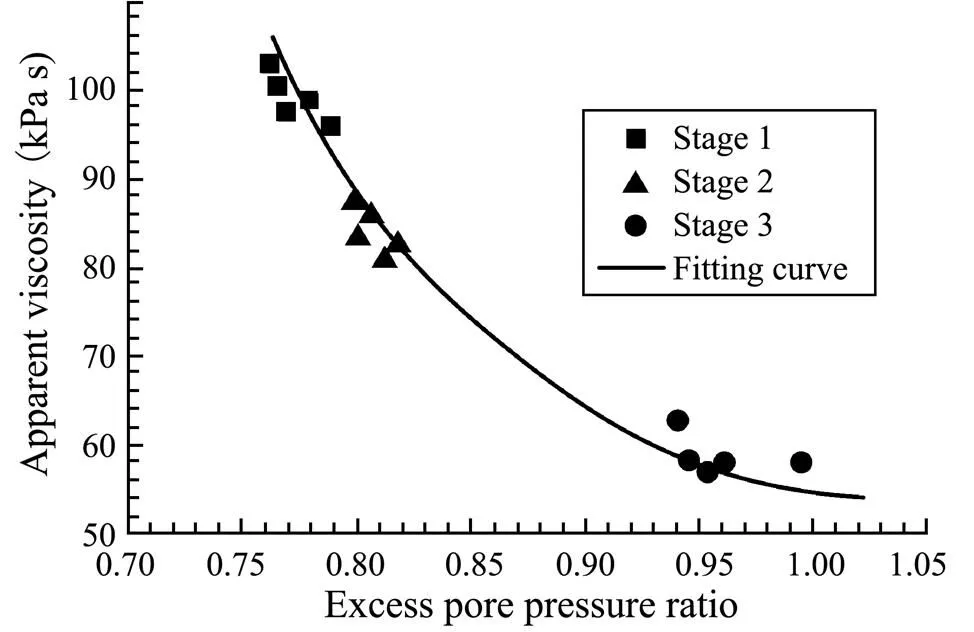
Fig.11 Relationship between excess pore pressure ratio and viscosity.
3.3 Results of the Shaking Table
3.3.1 The influence of vibration on consolidation
In past theoretical analyses, it was generally assumed that the height of the soil bed was constant (Mutlu., 2010). However, the height of the soil bed in our tests changed in relation to the cyclic load, and the soil bed maintained a certain subsidence. In order to study the soil bed subsidence in more detail, a micrometer was used to measure the process of soil bed subsidence. As shown in Fig.12, due to the self-weight consolidation during the deposition process, the height of the soil bed decreased from 38cm to 35cm. However, the height of the soil bed abruptly decreased when the vibration load was applied, and soil bed height further decreased with the increase of the vibration time. The process of soil bed subsidence under the vibration loads is shown in Fig.13.
The primary reasons for the subsidence of the soil bed can be attributed to the following two points. The first and most important reason is liquefaction. Researches have found that lighter structures rise to the surface while heavy structures sink into the soil bed after the soil liquefaction (Zen and Yamazaki, 1990; Jeng, 1997). As such, liquefaction and subsidence are related. More specifically, liquefaction causes settlement, and settlement aggravates the liquefaction process. The second reason is the change in soil relative density caused by the decrease of the soil pore volume under cyclic vibration loads. As shown in Table 4, the relative densities of the soil samples were measured before and after the vibration. It is obvious that the vibration increases the soil relative density.
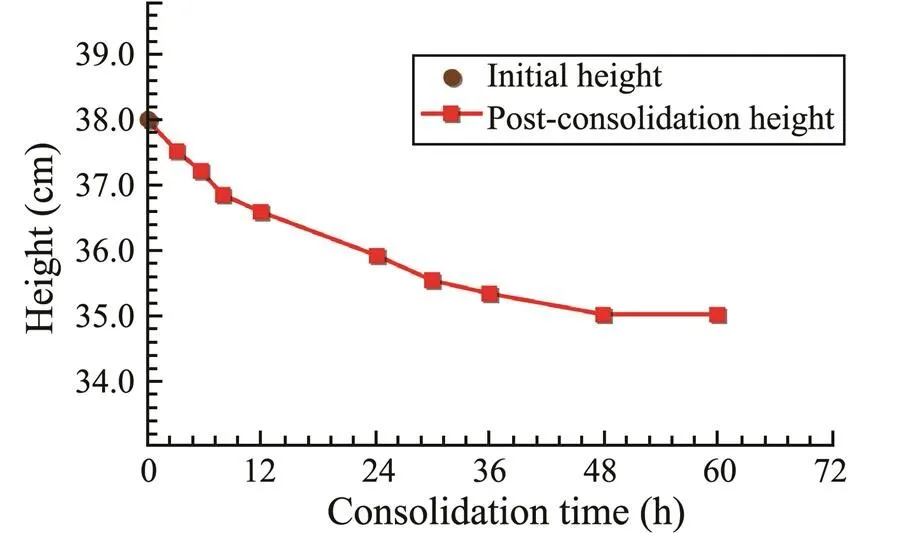
Fig.12 Soil subsidence under the condition of gravity consolidation.
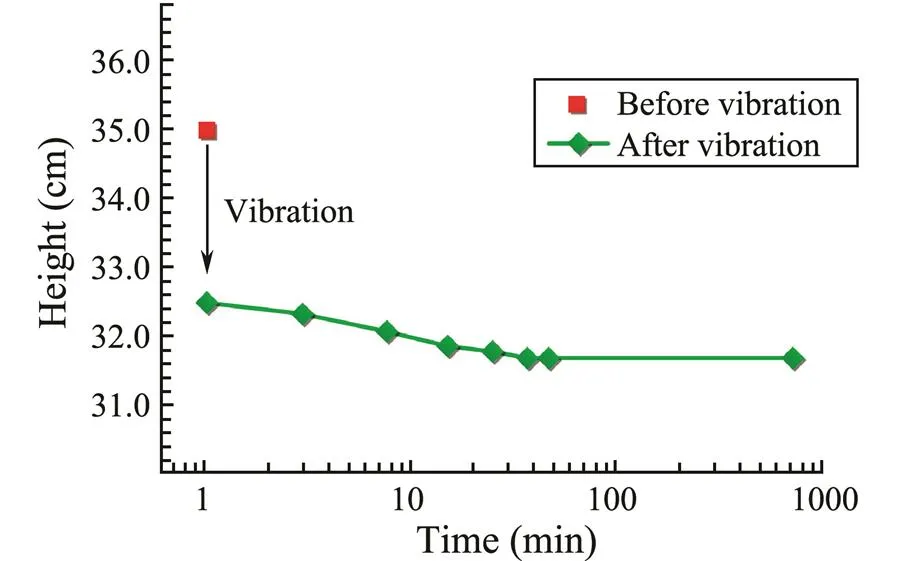
Fig.13 Soil subsidence under the condition of vibration consolidation.

Table 4 The relative density of the silt soil
3.3.2 The analysis of the viscosity property
In order to analyze the effect of the excess pore pressure ratio on the apparent viscosity of silty soil (that had not reached the liquefaction mark ofr<1), the multiple tests conducted on the same day were used for data analysis. The data showed only minor differences in relative density. As such, these tests can be assumed to have the same initial relative density. Fig.14 shows the change of apparent viscosity with the pore pressure ratio. In Fig.14, the apparent viscosity decreased with the increase of excess pore pressure ratio (r<1). Until the effective stress reached 0 (the soil had not been fully liquefied), the soil was in a semi-fluid state. And the excess pore pressure ratio had been increasing to a certain extent, causing the soil to be characterized by decreasing viscosity and increasing deformability. The change slowed down with the increase of excess pore pressure ratio. Specifically, the change speed of apparent viscosity decreased, and the degree of soil liquefaction increased gradually. Importantly, it can be determined that pore pressure values will continue to rise unless there is a decrease in the soil modulus. Significantly, the soil exhibited the characteristics of shear thinning non-Newtonian fluid once the soil had completely liquefied.
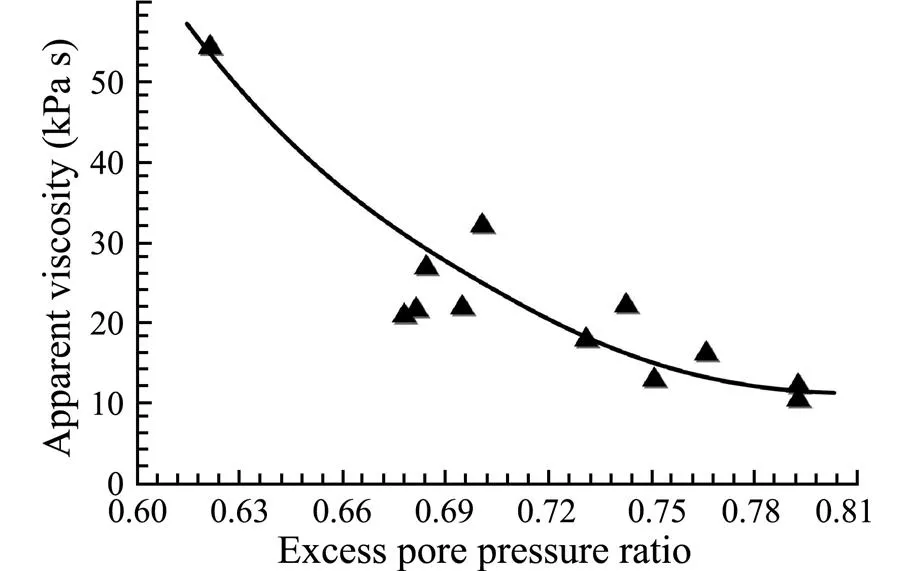
Fig.14 Effect of the excess pore pressure ratio on the apparent kinematic viscosity (ru<1).
Fig.15 shows that the relationship between the strain rate (max) and shear stress () when the soil liquefied completely (r=1). The strain rate (max) could be calculated by the velocity () and radius (0) of the dragging ball:
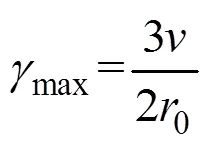
and the shear stress () is connoted by dragging force () of ball. It can be observed that the growth rate of shear stress gradually decreased with increases in the strain rate, which is the characteristic of shear thinning.
Fig.15 The graph of shear stress. strain rate (r=1).
3.4 The Constitutive Model of Flow Characteristics
As indicated by the test results, in a zero effective stress state (σ'=0), silty soil with the characteristics of shear thinning can be seen as a type of non-Newtonian fluid. Moreover, it can be determined that the apparent viscosity of liquefied silty soils increased with the increase of the strain rate. In a non-zero effective stress state (σ'≠0), the pore pressure decreased with the decrease of the excess pore pressure ratio. Ultimately, the apparent viscosity of silty soil gradually increased, then a consistency between the apparent viscosity and the excess pore pressure ratio was maintained.
3.4.1 Shear stress–shear strain rate
Based on the analysis of the test data, the relationship between shear stress and strain rate under zero effective stress (r=1) was obtained. The results are shown in Fig.16. The following power function was used to fit the experimental points:

whererepresents the consistency coefficient in zero effective stress, andrepresents the flow index in zero effective stress.
Fig.16 The graph of shear stress. strain rate (r=1).
As shown in Fig.16, under the zero effective stress state, the relation between shear stress and strain rate can be described by the power function defined above. This also indicate that liquefied silt is a type of fluid with shear thinning non-Newtonian characteristics.
3.4.2 Apparent viscosity-excess pore pressure ratio
The following is the summary of the results of these tests: When the soil was in a non-zero effective stress state (r<1), the relationship between apparent viscosity and excess pore pressure ratio could be fit by Eq. (5):

where,represents the fitting parameters in a non-zero effective stress.
The response curves of apparent viscosity to excess pore pressure ratios were fitted by the data obtained from the shaking table test and the wave flume test, respectively. The fitting curves are shown in Fig.17.
The results indicate that apparent viscosity and excess pore pressure ratio have a corresponding exponential relationship; in other words, there is an exponential equation that fits the testing data. When comparing the results of the wave flume and shaking table tests in a state of non-zero effective stress, the strain rate had a greater effect on the apparent viscosity for the wave flume test than the shaking table test. Moreover, increases in the strain rate resulted in the decrease of the apparent viscosity.
3.4.3Constitutive model of flow characteristics of liquefied silt
As indicated by the data analysis and fitting given above, the constitutive model can be used to describe the flow characteristics of silty soil liquefaction. The model can be used to describe the stress-strain relationship of soils under either a zero effective stress state or a non- zero effective stress state. When soil was in a state of zero effective stress, the relationship between shear stress and shear strain rate could be expressed by the following power function:

where0and0are the fitting parameters.
When the soil was in a state of non-zero effective stress, a relationship between the apparent viscosity and the excess pore pressure ratio can be expressed as:

or
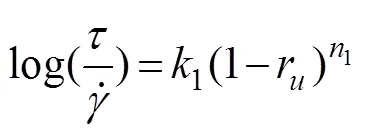
where1and1are the fitting parameters.
4 Conclusions
This paper described the detailed results of wave flume tests and shaking table tests on the flow characteristics of liquefied silt in the Yellow River Delta. The performance of pore pressure, effective pressure, and moving parameters of the dragging ball were carefully monitored. The major conclusions may be summarized as follows:
1) The apparent viscosity of silty soils could reach 57– 100kPas, which is much higher than sands. And the wave loads have significant influence on the viscosity of silty soils. The apparent viscosity dropped to about 60kPas from about 100kPas, when the wave height rose to 15cmfrom 9.5cm. Moreover, the apparent viscosity increased by about 10kPas with the passing of time despite no changes of wave height.
2) In the shaking table tests, the silt quickly reached the liquefied state. There was the consolidation phenomenon in the soil bed, which was significantly influenced by vibrations. The tests data showed that when the soil had not yet reached the completely liquefied state (r<1), the apparent viscosity decreased with the increase of excess pore pressure ratio; when the soil had reached the completely liquefied state (r=1), the shear stress decreased with the increase of strain rate.
3) Silty soil in a liquefied state showed shear thinning characteristics that are consistent with the non-Newtonian fluid characteristics. By fitting the test data, two fitting exponential equations about shear stress-shear strain rate and apparent viscosity-excess pore pressure ratio was obtained. Finally, the constitutive model which describes the flow characteristics of the liquefied silt quantitatively was established.
Acknowledgements
The study is supported by the National Natural Science Foundation of China (Nos. 41427803, 41672272), China- ASEAN maritime cooperation fund: Comparative Study of Holocene Sedimentary Evolution of the Yangtze River Delta and the Red River Delta, and the Primary Research and Development Plan of Shandong Province (No. 2017 GGX30125).
Bo, M. W., Arulrajah, A., Sukmak, P., and Horpibulsuk, S., 2015. Mineralogy and geotechnical properties of Singapore marine clay at Changi., 55 (3): 600-613.
Chen, Y. M., Liu, H. L., and Wu, H. Q., 2013. Laboratory study on flow characteristics of liquefied and post-liquefied sand., 17 (S1): 23-32,DOI: 10.1080/19648189.2013.834583.
Chen, Y. M., Liu, H. L., and Zhou, Y. D., 2006. Analysis on flow characteristics of liquefied and post-liquefied sand., 9 (28): 1139-1143 (in Chinese with English abstract).
Feng, J., and Yan, S. W., 2005. Degradation of soft clay in the entrance to sea of the Changjiang River under wave cyclic loading., 20 (1): 18-21 (in Chinese with English abstract).
Goh, A. T. C., and Zhang, W. G., 2014. An improvement to MLR model for predicting liquefaction-induced lateral spread using multivariate adaptive regression splines., 170: 1-10, DOI: 10.1016/j.enggeo.2013.12.003.
Hamada, M., and O’Rourke, T., 1992. Case studies of liquefaction and lifeline performance during past earthquakes: Japanese case studies. Technical Report NCEER-92-0001. Buffalo, USA.
Hamada, M., Sato, H., and Doi, M., 1993. An experimental study of mechanical properties of liquefied soil and large ground displacement.. Napa Valley, California, USA.
Huang, Y., Bao, Y., Zhang, M., Liu, C., and Lu, P., 2015. Analysis of the mechanism of seabed liquefaction induced by waves and related seabed protection., 79 (2): 1399-1408, DOI: 10.1007/s11069-015-1897-1.
Hwang, J. I., Kim, C. Y., Chung, C. K., and Kim, M. M., 2006. Viscous fluid characteristics of liquefied soils and behavior of piles subjected to flow of liquefied soils., 26 (2): 313-323.
Jeng, D. S., 1997. Wave-induced seabed instability in front of a breakwater. PhD thesis. University of Western Australia.
Kawakami, T., Suemasa, N., Hamada, M., Sato, H., and Katada, T., 1994. Experimental study on mechanical properties of liquefied sand.–. Salt Lake City, USA, 285-299.
Kong, D., Miao, C., Borthwick, A. G. L., Duan, Q., Liu, H., Sun, Q., Ye, A., Di, Z., and Gong, W., 2015. Evolution of the Yellow River Delta and its relationship with runoff and sediment load from 1983 to 2011., 520: 157-167.
Liu, Q., Zheng, X. L., and Liu, H. J., 2007. Experimental studies on liquefaction behavior of silt in the Yellow River Delta., 23 (2): 161-166 (in Chinese with English abstract).
Liu, X., Zhang, M., Zhang, H., Jia, Y., Zhu, C., and Shan, H., 2017. Physical and mechanical properties of loess discharged from the Yellow River into the Bohai Sea, China., 227: 4-11, DOI: 10.1016/j.enggeo.2017.04.019.
Luan, M., Qu, P., Jeng, D. S., Guo, Y., and Yang, Q., 2008. Dynamic response of a porous seabed-pipeline interaction under wave loading: Soil-pipeline contact effects and inertial effects., 35 (2): 173-186.
Miyajima, M., Hasegawa, M., Kitaura, M., and Kitano, Y., 1994a. Experimental study on effects of liquefaction-induced lateral spreading on buried structures.. Tokyo, Japan, 1363- 1368 (in Japanese).
Miyajima, M., Kitaura, M., and Kitano, Y., 1994b. Model tests on variation of soil properties with the extent of liquefaction.. Tokyo, Japan, 548-549 (in Japanese).
Miyajima, M., Kitaura, M., Koike, T., and Hasegawa, M., 1995. Experimental study on characteristics of liquefied ground flow.. Tokyo, Japan, 969- 975.
Mutlu, S. B., Figen, H. D., and Jørgen, F., 2010. Cover stones on liquefiable soil bed under waves., 57 (9): 864-873, DOI: 10.1016/j.coastaleng.2010.05.004.
Nishimura, S., Towhata, I., and Honda, T., 2002. Laboratory shear tests on viscous nature of liquefied sand., 42 (4): 89-98, DOI: 10.3208/sandf.42.4_89.
Ohtomo, K., Iwadate, T., Shimizu, M.,Shumuta, Y., and Hamada, M., 1993. Horizontal load exerted on pile foundation by lateral flow of liquefied sand.. Tokyo, Japan, 95-98 (in Japanese).
Pratson, L. F., Imran, J., Hutton, E., Parker, G., and Syvitski, J., 2001. BANG1D: A one-dimensional, Lagrangian model of sub- aqueous turbid surges., 27: 701- 716.
Prior, D. B., Suhayda, J. N., and Lu, N. Z., 1989. Storm wave reactivation of a submarine landslide., 341 (7): 47-50.
Qi, S., and Liu, H., 2017. Natural and anthropogenic hazards in the Yellow River Delta, China., 85 (3): 1907- 1911, DOI: 10.1007/s11069-016-2638-9.
Sasaki, Y., Towhata, I., and Tokida, K. I., 1992. Mechanism of permanent displacement of ground caused by seismic liquefaction., 32 (3): 79-96.
Sasaki, Y., Udaka, K., and Miyamoto, Y., 1997. Prediction of subsidence of embankment resting on liquefied subsoil with consideration on duration of high pore pressure., Japan (in Japanese).
Sato, H., Hamada, M., and Doi, M., 1994. An experimental study of effects of laterally flowing ground on in-ground structure.–. Salt Lake City, UAS, 405-414.
Shen, S. L., Wang, Z. F., Sun, W. J., Wang, L. B., and Horpibulsuk, S., 2013. A field trial of horizontal jet grouting using the composite-pipe method in soft deposit of Shanghai., 35: 142-151.
Takada, S., and Nagai, J., 1987. Dynamic stiffness and damping in liquefied ground., 29:53-72 (in Japanese).
Towhata, I., and Horikoshi, K., 1997. Analysis on subsidence of building resting on liquefied sandy ground.. Japan, 973-974 (in Japanese).
Towhata, I., Sassaki, Y., Tokida, K., Matsumoto, H., Tamari, Y., and Yamada, K., 1992. Prediction of permanent displacement of liquefied ground by means of minimum energy principle., 32 (3): 97-116, DOI: 10.3208/sandf 1972.32.3_97.
Towhata, I., Vargas-Monge, W., and Orense, R. P., 1999. Shaking table tests on subgrade reaction of pipe embedded in sandy liquefied subsoil., 18 (5): 347-361.
Toyota, H., 1995. Shaking table tests and analytical prediction on lateral flow of liquefied ground. PhD thesis. The University of Tokyo (in Japanese).
Vargas, W., and Towhata, I., 1995. Measurement of drag exerted by liquefied sand on buried pipe.. Tokyo, Japan, 975-980.
Wang, H., and Liu, H., 2016. Evaluation of storm wave-induced silty seabed instability and geo-hazards: A case study in the
Yellow River Delta., 58: 135-145.
Yang, S. L., Sandven, R., and Grande, L., 2003. Liquefaction of sand under low confining pressure., 2 (2): 207-210.
Yang, X., Jia, Y., Liu, H., and Shan, H., 2009. Characteristics and causes of the preconsolidation stress of soils in the Yellow River Delta., 8 (3): 215-222.
Yuasa, A., Sato, H., Doi, T., Kawasaki, T., and Hamada, M., 1994. An experimental study on fluid properties of liquefied sand.. Tokyo, Japan, 877-882 (in Japanese).
Zen, K., and Yamazaki, H., 1990. Mechanism of wave-induced liquefaction and densification in seabed., 30 (4): 90-104, DOI: 10.3208/sandf1972.30.4_90.
Zhang, J. M., 1994. Transient shear strength of saturated sand under cyclic loading considering strain-rate effect., 34 (4): 51-65, DOI: 10.3208/sandf1972.34.4_ 51.
Zhang, M., Huang, Y., and Bao, Y., 2016. The mechanism of shallow submarine landslides triggered by storm surge., 81 (2): 1373-1383.
Zhang, M. S., Liu, H. J., and Li, X. D., 2009. Study of liquefaction of silty soil and mechanism of development of hard layer under wave actions at Yellow River Estuary., 30 (11): 3347-4456 (in Chinese with English abstract).
Zhang, M. S., Wang, X. H., Liu, H. J., Zang, W. K., and Zhai, G. L., 2014. Experimental study on liquefaction seepage in silty soil under cyclic water pressure.,44 (9): 82-88 (in Chinese with English abstract).
Zhang, W., Goh, A. T. C., Zhang, Y., Chen, Y., and Xiao, Y., 2015. Assessment of soil liquefaction based on capacity energy concept and multivariate adaptive regression splines., 188: 29-37.
September 24, 2017;
December 4, 2017;
January 21, 2018
© Ocean University of China, Science Press and Springer-Verlag GmbH Germany 2018
. Tel: 0086-532-66781020 E-mail: ltmilan@ouc.edu.cn
(Edited by Chen Wenwen)
杂志排行
Journal of Ocean University of China的其它文章
- Comparative Evaluation of Toleration to Heating and Hypoxia of Three Kinds of Salmonids
- Morphological Change in the Northern Red River Delta, Vietnam
- Internal Facies Architecture and Evolution History of Changxing Mouth-Bar Complex in the Changjiang (Yangtze) Delta, China
- The Holocene Environmental Evolution of the Inner Hangzhou Bay and Its Significance
- Provenance of Sediments Filling a Paleo-Channel that Formed on the Western Yellow Sea Continental Shelf During the Last Glacial Period
- Distribution and Characteristics of Hazardous Geological Features in the Marine Coastal and Offshore Areas of Zhejiang Province, East China Sea
