Periodic atomization characteristics of an impinging jet injector element modulated by Klystron effect
2018-10-15AnlongYANGBinLIShangrongYANGYunfeiXULongfeiLI
Anlong YANG,Bin LI,Shangrong YANG,Yunfei XU,Longfei LI
Science and Technology on Liquid Rocket Engine Laboratory,Xi’an Aerospace Propulsion Institute,Xi’an 710100,China
KEYWORDS Atomization;Combustion stability;Impinging jet injector;Klystron effect;Liquid rocket engine;Mie scatter
Abstract An experimental study on the Klystron effect of periodic injection modulated by pressure drop fluctuations on subsequent atomization is conducted.Time-resolved atomization backlit images and atomization Mie scatter images are captured by using the high speed camera.It is found that periodicity of forced atomization relies on pressure drop fluctuation amplitude and phase differences between atomization and pressure drop fluctuations relate to fluctuation frequencies.This feature of periodic atomization induced by Klystron effect corresponds to periodicities and high amplitudes of pressure fluctuations in unstable combustion chambers and chaos and low amplitudes of pressure fluctuations in stable combustions chambers.Drastically periodic varying of gross surface area of droplets with time was shown in Mie scatter images.The importance of periodic impinging jet atomization modulated by pressure drop fluctuations for acoustic liquid propellant combustion instabilities is illustrated.
1.Introduction
Combustion instabilities generated by coupling of heat release and acoustic pressure in the combustor are very complicated and dangerous phenomena in rocket engines.These acoustic combustion instabilities are particularly troublesome in rocket engines,because they interrupt original energy supplies,generate undesired intense pressure fluctuations,and lead to excessive heat transfer to combustor walls and injector plates.Although research on acoustic combustion instabilities in rocket engines is quite intense worldwide since the 1940s,1,2prediction of these processes at the design stage is still a huge challenge.The reasons are the complexity of the problem,the generally inaccessible environment of the rocket engine combustion chamber,and the lack of appropriate diagnostic techniques available to study the problem.
It is known that the combustion process can add acoustic energy to the system in the occurrence of combustion instabilities.The energy transfer is mathematically expressed in terms of the so-called Rayleigh criterion.3The Rayleigh criterion states that heat release must be in phase with the pressure oscillation to allow resonant interaction between combustion and the acoustic field.It is notable that pressure fluctuations in the unstable combustion chambers have two significant characteristics:high amplitudes and prominent periodicity,in comparison with those in the stable combustion chambers.Thus,the combustion heat release should also be periodic to catch a stable phase angle with respect to the periodic pressure fluctuations as required by Rayleigh criterion.Periodicity of combustion heatrelease in the occurrence of combustion instabilities has been certified in previous literatures experimentally4,5and numerically.6–8Still the question remains as to how the combustion heat release is modulated to be periodic by acoustic fluctuations.
It is still unclear whether the coupling mechanism is pressure or velocity driven,and what process is predominantly responsible in acoustic combustion instabilities.For the sake of figuring out these problems,the effects of acoustic perturbations on sprays or flames have been investigated experimentally and numerically.Hakim et al.9numerically examined dynamical interactions between cryogenic propellant flames and transverse acoustic modes when the flame lies in the vicinity of a transverse velocity anti-node,corresponding to a pressure node.The flame was shortened, flattened in the spanwise direction and periodically displaced in the transverse direction following the acoustic field.Baillot et al.10experimentally demonstrated that acoustic velocity fluctuations could lead to the flattening of the jet into a liquid sheet.Hardi et al.11,12conducted a hot- fire testing with a rectangular rocket combustor for measuring high-speed shadowgraph and OH*chemiluminescence imaging of externally forced LOx∕H2coaxial injection.Shadowgraph images revealed extreme shortening of the dense LOxcores of the shear-coaxial jets during transverse acoustic velocity oscillations.Sliphorst et al.13,14conducted a liquid oxygen/methane combustion experiment with acoustic perturbations in a circular cylinder combustion chamber.It was concluded in a way that the effects of acoustic perturbations on the spray flames were predominantly velocity driven rather than pressure driven.
However,a contrary conclusion was obtained by Knapp et al.15using the same cylinder combustion chamber as Sliphorst’s.Richecoeur et al.16carried out a cryogenic propellant hot- fire testing on a rectangular cross-section system featuring three coaxial injectors under high-frequency transvers excitation.An analysis indicated that the pressure and OH*emission had similar spatial distributions and oscillated in phase.A possible explanation for this contradiction is that Rayleigh criterion is a necessary but not sufficient criterion for the amplification of combustion instabilities.The acoustic fluctuation amplitude of Sliphorst’s experiment was an order of magnitude smaller than that of real rocket engines occurring combustion instabilities.It is possible that acoustic velocity fluctuations could lead to periodic combustion heat release undulations,9but contributions of heat release rates to Rayleigh index are mostly offset due to their double frequency of acoustic excitation.5,17,18Hakim et al.9demonstrated that there were twice collective heat releases with a phase difference of almost 180°in per acoustic period at a velocity antinode.Although the locations of the two collective heat releases are discrepant because of the modulation of acoustic velocity oscillations,the spatial phase difference is quite limited since the acoustic velocity is much smaller than the sound speed of combustion products.Thus,on average,negligible effects of velocity oscillations on amplifying acoustic perturbations are produced at the velocity antinode.
In comparison to acoustic velocity,the in-phase relation between heat release rates and pressure fluctuations were demonstrated experimentally4and numerically.6,8Worth and Dawson4stated that the globally integrated fluctuations in heat release rate vary in magnitude along the acoustic mode shape in standing wave modes.The contribution of heat release to amplifying acoustic fluctuations was negligible at the pressure nodes and maximum at the pressure anti-nodes.Urbano et al.8analyzed combustion instabilities in a complete small-scale rocket engine by making use of large eddy simulations.Simulation results showed that the contribution of flames at the pressure anti-nodes to Rayleigh index was significantly higher than that at the pressure nodes.It is concluded that the flames driving unsteady acoustics are those located at the pressure anti-nodes.
The successful cases presenting spontaneous combustion instabilities mentioned above were all carried out in gas turbine combustors fed by premixed gas propellants.Compared with gas turbine combustors,it is more difficult to germinate spontaneous liquid-propellant combustion instability phenomena in laboratory-scale combustion chambers.Optical measurements of sprays and flames are also more difficult mainly because of high back pressure environments.Miller et al.19conducted a gas-centered,fuel-swirled injector element liquid rocket combustion experiment and achieved strong spontaneous longitudinal instabilities with peak-to-peak amplitudes of 0.69–1.38 MPa in a model combustor.Due to the absence of optical measurements,Rayleigh index could not be obtained in Miller’s experiment.Using the same injector element as Miller’s,Pomeroy et al.17,20conducted transverse combustion stability experiments in which CH*chemiluminescence maps of flames were captured by a high speed camera.The dominant frequency of overall CH*chemiluminescence was twice the frequency of acoustic fluctuations,since the window used to capture CH*chemiluminescence maps was installed near the velocity anti-node.That experimental result corresponded to the analysis on the flame response to acoustic velocity fluctuations mentioned above.Pomeroy and Anderson21further tested transverse combustion stability experiments using different injector arrangements.It was found that the strongest instability occurred in the case with injector locations nearest to the pressure anti-nodes.Popov and Sirignano22presented a computational analysis of transverse acoustic instability for Pomeroy’s experimental combustion chamber.It is confirmed that pressure oscillations have a stronger effect on the energy release rate than oscillations of the transverse velocity do.
As mentioned above,compared with acoustic velocity oscillations,the effect of acoustic pressure oscillations on combustion processes should be paid more attention.There are many processes taking place in combustion chambers of liquid propellant rocket engines.Injection,atomization,vaporization,mixing and chemical reaction rate all possibly respond to acoustic pressure oscillations.This paper is focused on injection and its effect on subsequent atomization.In liquid propellant rocket engine systems,injection can be considered as a pure pressure sensitive process,which is almost independent of subsequent processes.Atomization directly depends on injection and influences other subsequent processes such as mixing and vaporization.
Although the frequency of acoustic combustion instabilities is determined by the geometrical dimensions of combustion chambers,whether combustion instabilities occur strongly depends on some injector characteristics that can be roughly quantified by Strouhal number(St).In gas turbine combustion instabilities,Strouhal numbers of injectors relate to vortex formation.7,23Mass flow rates modulated by acoustic pressure oscillations lead to periodically consecutive vortex structures and collective heat releases.Wolf et al.7suggested that there exists an obvious and stable phase difference between mass flow and heat release rates in occurrence of combustion instabilities.Swirl injectors used in liquid-propellant rocket engines feature frequency cutoff phenomena.19,24Khalil et al.24investigated the response of unconfined swirling jets undergoing vortex breakdown to axial pulsing.It was found that the Strouhal number of shear-layer vortex shedding was fixed at the natural Strouhal number Stn=0.78 for an unforced swirling jet and the highest receptive shedding frequency was 2Stn.Miller et al.19conducted an experiment characterizing the combustion dynamics of a single gas-centered,fuel-swirled injector element at five different lengths,from 25.4 to 88.9 cm.The experimental results indicated that the particular injector element was not prone to excite instabilities at fundamental frequencies below 1050 Hz and above 1810 Hz.For liquid-propellant rocket engines employing impinging-jet injectors,Hewitt stability correlation25has demonstrated good agreements in matching the stability characteristics of more than 20 full-scale engines used for production or for technology programs.According to Hewitt stability correlation,the highest sustainable frequency of combustion instability is lower than Uj/10do,where Ujis the injection velocity and dois the orifice diameter.In other words,Strouhal number of impinging injectors is smaller than 0.1 when acoustic combustion instabilities occur.
It is well known that Strouhal number is a dimensionless value useful for analyzing oscillating unsteady fluid flow dynamics problems.Thus,there is a reasonable and logic conjecture that frequency cutoff phenomena of acoustic combustion instabilities are dominated by injection and atomization which are flow dynamic processes relating to injectors.Ryan26and Anderson27et al.statistically measured the mean primary atomization frequency of liquid impinging injection.It is suggested that the mean primary atomization frequency is approximately Uj/5do(the corresponding Strouhal number is 0.2),twice the highest sustainable frequency of combustion instability.It means that the primary atomization frequency and the highest sustainable frequency of combustion instability both increase linearly with the ratio of injection velocity to orifice diameter(Uj/do).
Although the two frequencies are submitted to the similar varying trend with respect to Uj/do,there exist two obvious differences between the primary atomization frequency and the highest sustainable frequency of combustion instability.First,the primary atomization frequency of turbulent impinging jets is a mean value ranging from Uj/10doto Uj/do.27Thus,there is not strict atomization frequency or periodicity which is usually identified by FFT(Fast Fourier Transform)analysis.Second,this ‘‘mean frequency” of primary atomization is about twice as high as the highest sustainable frequency of combustion instability.Due to turbulent disturbances in liquid and gas streams,the primary atomization in real rocket engines features broad statistics,28,29which is different with periodic breakups in laminar cases.30,31
The stochastic characteristics of the primary atomization frequency are based on the case of unforced turbulent impinging jets.For combustion instability cases,the state of atomization is possibly unusual,since the amplitude of back pressure fluctuations in combustion chambers is always the same order of magnitude as the pressure drop of injectors.19In that case,the effect of back pressure fluctuations on injection and atomization should not be neglected.The environment for atomization should approach that of naturally occurring combustion instabilities in real engines.32Nevertheless,this effect has not been investigated systematically.A plausible reason is that the geometrical dimensions of feed systems are much larger than those of combustion chambers.It is unlikely that combustion chambers resonate with propellant feed pipes.However,the question is that whether the resonance between combustion chambers and feed pipes is the premise of coupling between injection and back pressure fluctuations.For tangential acoustic combustion instabilities at least,the coupling between injection and back pressure fluctuations has nothing to do with the total mass flow rates of feed pipes,since the integral of back pressure fluctuations on injector plates is zero no matter in standing or spinning modes.Urbano et al.8presented a coupling of pressure fluctuations and mass flow rates through the injection dome,injectors and the combustion chamber.Based on sound speeds in propellants and combustion products,injection domes and combustion chambers should have similar tangential eigen frequencies in liquid propellant rocket engines.
The injection pressure oscillations accompany the flow oscillations that cause the velocities of the liquid particles to vary with time.Then a large proportion of fluid particles are superposed together at certain point where the liquid particles with high velocities overtake those with low velocities.This phenomenon is called the Klystron effect,and has been reported in impinging jet injectors1,33and swirl injectors.34,35
Most observations of acoustic combustion instabilities are carried out in nonlinear where the system oscillates at a limit cycle,36,37especially for liquid-propellant rocket engines.High amplitudes of acoustic pressure fluctuations always accompany with periodicity of acoustic pressure fluctuations in occurrence of combustion instabilities;low amplitudes of acoustic pressure fluctuations always accompany with chaos of acoustic pressure fluctuations in absence of combustion instabilities.Kashinath et al.38indicated that turbulent noise could stabilize unstable states in nonlinear systems.It is possible that injection and atomization possess some nonlinear responsive characteristics because of their turbulent flow features.
The purpose of the present study is to investigate the nonlinear responsive characteristics of generic impinging jet injector elements in terms of injection and atomization.The paper is organized as follows.In Section 2,the experimental apparatus and optical measuring method are presented.In Section 3,based on time-resolved atomization backlitimages,the responses of injection and atomization to periodic pressure fluctuations at different frequencies and amplitudes are demonstrated.In Section 4,time-resolved Mie-scattering images of atomized droplets illuminated by a laser beam are analyzed. In Section 5, forced periodic atomization characteristics are concluded and the effect of periodic atomization on acoustic combustion instabilities is discussed.
2.Experimental setup and measurement
As a fundamental atomization study,this research consists of a series of cold- flow experiments conducted at atmospheric pressure.Testing at atmospheric conditions allows for unobstructed access to atomization fields and allows greater flexibility in the placement of instrumentation.The liquid propellant simulant is tap water,and the ambient environment is air.The measured kinematic viscosity ν of water at 20 °C is approximately 1.2×10⁻⁶m2/s.
2.1.Injector element
A schematic of the Like-On-Like(LOL)impinging jet injector is shown in Fig.1.The orifice diameter doof the jet injector element is 1 mm,the half angle θ between two jets is 30°and the axial distance from impingement point to the injector plate Diis 3 mm.The average injection pressure drops of all tests were approximately identical,1 MPa.The mean jet velocity Ujwas about 31.7 m/s.The Reynolds number Rejbased on the orifice diameter do,the measured kinematic viscosity ν and the mean jet velocity Ujis 2.64×10⁴in the range of turbulent flow.
2.2.Hydrodynamic mechanical pulsator
As is shown in Fig.2,a hydrodynamic rotating-disk mechanical pulsator was designed to generate flow-line pressure fluctuations in feeding pipe.The hydrodynamic pulsator and jet injector element were parallelly connected to a pressurized water supply system in the experiments.The pressure drop of the jet injector element is modulated by periodically opening and closing the orifice which connects the pulsator with the supply pipe.The amplitude of pressure drop fluctuations is changed by altering different orifice diameters.The frequency of pressure fluctuations the pulsator generated ranges from 1 to 4600 Hz.This device is theoretically similar to that mentioned by Bazarov et al.39.It should be pointed out that our research background is acoustic combustion instabilities,although pressure fluctuations were generated in the feeding pipe in this study.Pressure fluctuations should be generated in combustion chambers in occurrence of acoustic combustion instabilities.However,our aim is just to study the effect of injection modulated by pressure drop fluctuations on atomization fields.The hydrodynamic mechanical pulsator can be used to simulate pressure drop fluctuations which would be modulated by back pressure fluctuations in unstable combustion chambers.The hydrodynamic mechanical pulsator was chosen due to experimental convenience and optical access to atomization regions.

Fig.1 Schematic of LOL impinging jet injector element.

Fig.2 Schematic of hydro-mechanical pulsator.
2.3.Schematic of experimental setup
Fig.3 shows a schematic of experimental system for the atomization backlit image tests.The experimental system consists of a pressurized water supply system,an impinging jet injector element,pressure sensors,a data acquisition system and a high-speed camera system.The injector unit was instrumented by piezoresistive and piezoelectric sensors which monitored the static and high-frequency pressure,respectively.
High speed images of backlit atomization fields were captured by using a Phantom V12.1 high speed camera set up perpendicular to the mean jet flow.The images were sampled at a 28000 frame/s with a 512 pixel×384 pixel resolution.The pixel resolution corresponds approximately to a physical test section resolution of 0.142 mm.For the highest fluctuation frequency of 3568 Hz in this study,we captured about 8 frames per cycle.A 500 W steady Light Emitting Diode(LED)array light was set up on the side of the injector unit opposite to the high speed camera,and a diffusion plate was used to create a diffuse light.

Fig.3 Schematic of experimental system for atomization backlit image tests.
The sample rates of the data collector are up to 102.4 kHz.The piezoelectric sensor has the same order of effectively responsive frequency as the data collector with pressure measuring in the range of 0–5 MPa and measuring error of 0.15%.The piezoelectric sensor is capable of effectively responsive frequency up to 200 Hz with pressure measuring in the range of 0–2 MPa and measuring error of 0.5%.A TTL falling edge signal generated by a DG535(Delay/Pulse Generator)was used to synchronize the pressure signals with the high speed image records.
Fig.4 shows a schematic of experimental system for the atomization Mie scatter image tests.Compared with the atomization backlit image tests,the LED array light was replaced with a copper vapor laser.The copper vapor laser has a power of mean 20 W at a fixed pulse frequency of 4500 Hz.The laser wavelengths are 511 nm and 578 nm.Two square signals of 4500 Hz generated by a synchronized-signal generator were used to synchronize the copper vapor laser and the high speed camera which was set to an external clock mode.Through a set of optical lens,the spanwise dimension and intensity of the laser beam remained unchanged.The laser sheet was perpendicular to the axis of the injection element and parallel to the injector plate with a distance of 50 mm in this experiment.The atomization fields were illuminated by the laser sheet.Mie scatter images were captured by the high speed camera located at an angle of 60°to the laser sheet.
The Mie-scattering signal intensity detected on a camera pixel,Gs(x,y),can be expressed as follows40:

where I0(x,y)is the intensity of the incident light at(x,y),Niis the number of the droplets of ith size class di,csis a constant and bmequals 2.0965 according to experimental data fitting of Ref.40.
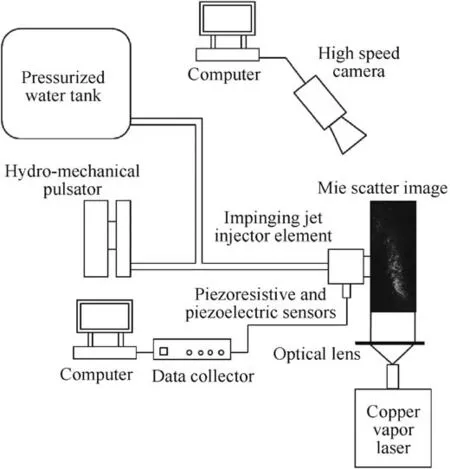
Fig.4 Schematic of experimental system for atomization Mie scatter image tests.
3.Atomization backlit image tests
3.1.Experimental conditions
To study injection and atomization dynamic characteristics of the LOL impinging jet injector element,the pressure fluctuations pf(t)of 8 different frequencies from 447 Hz to 3567 Hz were generated by the hydrodynamic mechanical pulsator in atomization backlit image tests.Several different amplitudes of pressure drop fluctuations were set at each fluctuation frequency by altering different orifice diameters of the hydrodynamic mechanical pulsator.In this paper,the amplitude of pressure drop fluctuations was defined as Ap,which was Fast Fourier Transform(FFT)amplitude corresponding to FFT dominant frequency.4096 images were captured at 28000 frame/s for every operating point.Strouhalnumber St=fpdo/Ujbased on the orifice diameter do,the mean jet velocity Ujand the pressure drop fluctuation frequency fpis shown in Table 1 for different fluctuation frequencies.
3.2.Analysis methodology of image
In order to obtain time-varying trend of mass flow rate through some locations in atomization fields,the reversed grayscale intensity of atomization backlit images was calculated by using an in-house code of image processing in MATLAB.The reversed grayscale intensity of atomization backlit images could qualitatively character density of fluid mass particle.
As is shown in Fig.5,a series of interrogation windows are set up with dimensions of LX=3doand LY=20doand a spatial interval of doalong the injector axis.H is the distance from the injector plate to the center position of the interrogation window.H equals 10do,20doand 30dofor the blue,cyan and red interrogation windows,respectively.
In this paper,grayscale intensity of images ranges from 0 to 1.The original grayscale intensity of atomization backlit images g0(X,Y)is reversed to g(X,Y),as is shown in the following equation:

where(X,Y)is Cartesian coordinates of the atomization backlit images.(H,NΔt)is the average reversed grayscale intensity of the interrogation windows with time.Three of the interrogation windows are shown in Fig.5,where N is the sequence number of images and Δt is the time interval of two adjacent backlit images.

Table 1 Strouhal number of impinging jet injector element at different fluctuation frequencies in atomization backlit image tests.
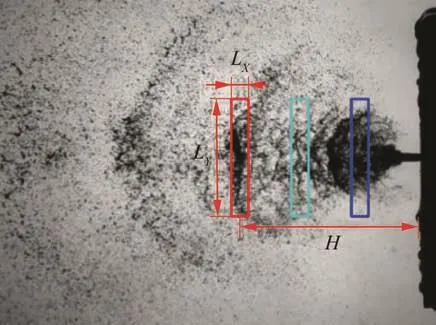
Fig.5 A backlit image of atomization at fluctuation frequency of 2230 Hz.
3.3.Correlation analysis
In order to analyze the correlation between atomization and pressure fluctuations,correlation analysis was used.The maximum correlation value is given by the following equation:

where Cormaxis the maximum correlation value of A and B,which are respectively subtracted by their average,T is the period of the pressure fluctuation,Δt is the time interval of sample,tdis the phase difference between A and B,Nsis the sum of sampling.
3.4.Results
Fig.6 shows atomization backlit images at a pressure drop fluctuation frequency of 447 Hz with three different amplitudes and without pressure fluctuations.In this study,all amplitudes of pressure fluctuations Apare FFT amplitudes at the dominant frequency.As is shown in Fig.6(a),atomization fields feature an obvious Klystron effect phenomenon at a pressure amplitude of 423.1 kPa.Massive fluid particles are superposed to be together and near the red interrogation window.On the contrary,there are not obvious Klystron effect phenomena in atomization fields at pressure amplitudes of 76.3 kPa and 11.7 kPa and without pressure fluctuations,as is shown in Fig.6(b)–(d),respectively.
Fig.7 shows the temporal average reversed grayscale intensity(H,NΔt)and the corresponding pressure fluctuations of 447 Hz at three different amplitudes Apand without pressure fluctuations.(H,NΔt)was subtracted by its temporal mean value.The colors of grayscale intensity lines represent locations of interrogation windows corresponding to Fig.6.H equals H1,H2and H3for the blue,cyan and red interrogation windows,respectively.Black lines label instants of corresponding atomization backlit images in Fig.6.As is shown in Fig.7(a),the time-varying trend of mass flow rates through the three interrogation windows features the same obvious periodicity as pressure drop fluctuations at the pressure amplitude Apof 423.1 kPa.(H,NΔt)at the pressure amplitude of 76.3 kPa also features periodicity but less obvious than that at the pressure amplitude of 423.1 kPa,as is shown in Fig.7(b).Higher frequency fluctuations are superposed to be on the dominant frequency fluctuations of(H,NΔt).No periodicity at pressure fluctuation frequency of 447 Hz can be discerned when the pressure amplitude is 11.7 kPa,as is shown in Fig.7(c).Instead,(H,NΔt)features a much higher mean frequency than the fluctuation frequency of447 Hz.These high frequency fluctuations correspond to atomization fields without pressure drop fluctuations,as shown in Fig.7(d).The details of dynamics of impinging atomization without pressure fluctuations can be found in Refs.26,27.
Fig.8 shows the FFT dominant frequencies faof(H,NΔt)along the injector axis at two different pressure drop fluctuation frequencies.These FFT dominant frequencies can be considered as primary atomization frequencies of impinging jets.Each sub figure shows three operating points of different pressure drop fluctuation amplitudes at the same frequency.For the two pressure fluctuation frequencies,(H,NΔt)almost all feature the same FFT dominant frequency as pressure drop fluctuations at the two highest pressure drop fluctuation amplitudes,which does not manifest at the lowest.
Fig.9 shows maximum correlation values Cormaxbetween(H,NΔt)along the injector axis and the pressure drop fluctuations pf(t)at two different pressure drop fluctuation frequencies.Corresponding to Fig.8,every sub figure consists of three operating points of different pressure drop fluctuation amplitudes at the same frequency.(H,NΔt)of 4096 images were substituted into Eq.(3)as A and the pressure drop fluctuations pf(t)were substituted into Eq.(3)as B.pf(t)were resampled by Δt.The strongest correlation between pressure fluctuations and g-(H,NΔt)is obtained at the highest of three pressure fluctuation amplitudes for the two fluctuation frequencies and vice versa.Cormaxis smaller near the injector plate than other locations,since the two circular jets have not yet impinged together near the injector plate.To the highest pressure fluctuation amplitude,Cormaxis larger than 0.7,which means strong correlation between pressure drop fluctuations and atomization fields.To the lowest pressure fluctuation amplitude,the maximum correlation value is smaller than 0.3,which means that correlation between pressure drop fluctuations and atomization fields is very limited.
Fig.10 shows FFT dominant amplitudes Aaof(H,NΔt)along the injector axis at two different pressure drop fluctuation frequencies.The corresponding FFT dominant frequencies are shown in Fig.8.As is shown in Fig.10,the higher pressure fluctuation amplitude,the higher FFT dominant amplitudes of(H,NΔt).The FFT dominant amplitude of(H,NΔt)at the lowest pressure fluctuation amplitude remains very minute along the injector axis compared to those at the two other higher pressure fluctuation amplitudes.To the two higher pressure fluctuation amplitudes,the FFT dominant amplitude of(H,NΔt)increases with the distance from the injector plate at the beginning and then reaches a plateau in Fig.10(a).It is worth noting that the correlation value in Fig.9(b)and the FFT dominant amplitude of(H,NΔt)in Fig.10(b)have a similar varying trend with the distance from the injector plate.They both gradually decrease with the distance from the injector plate after reaching the maximum.
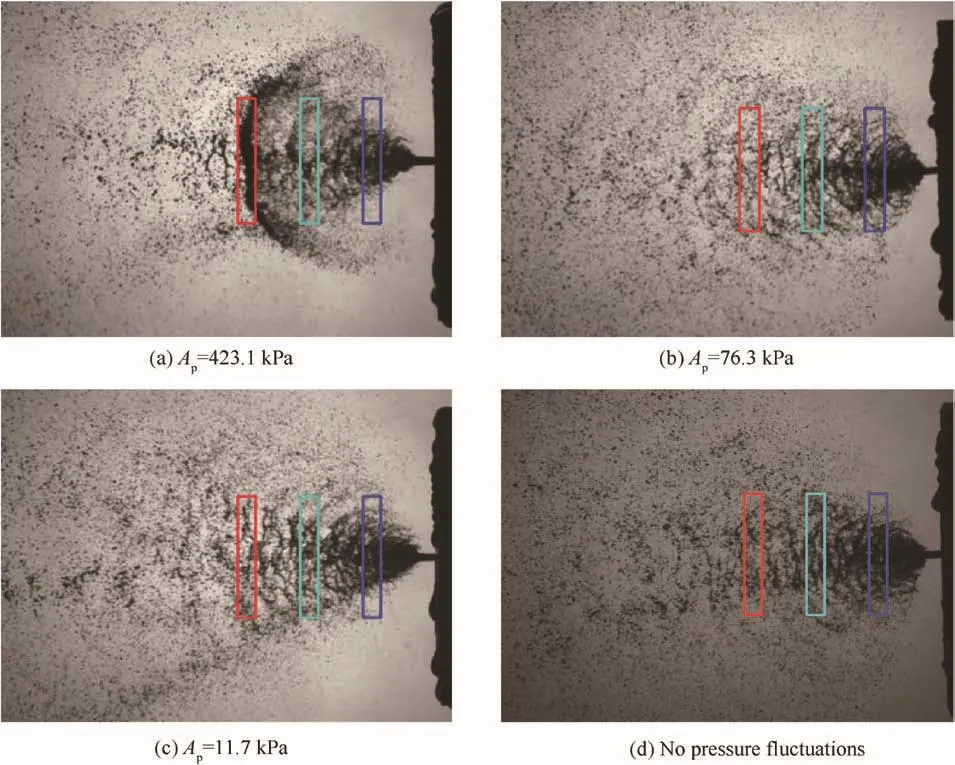
Fig.6 Atomization backlit images at different pressure fluctuation amplitudes.
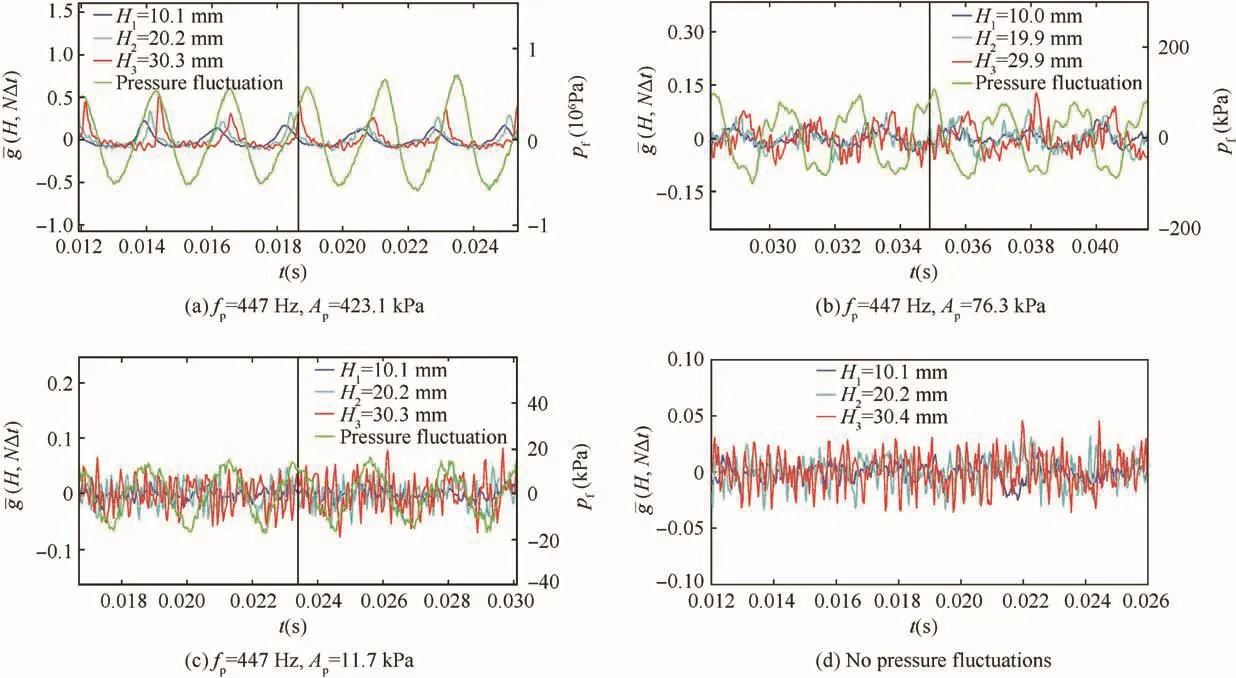
Fig.7 (H,NΔt)at different pressure fluctuation amplitudes.
Fig.11 shows correlation values Cormaxbetween pressure drop fluctuations and(H,NΔt)of all interrogation windows along the injector axis at different pressure fluctuation frequencies and amplitudes.The relative amplitude of pressure fluctuations is defined as=Ap/Pd,where Pdis the average injection pressure drop.It is demonstrated that there is a threshold of the relative pressure fluctuation amplitudethat governs correlation between pressure drop fluctuations and(H,NΔt).The average correlation values Cormaxalong the injector axis is larger than 0.7 ifis larger than about 0.1,which means a strong correlation between pressure drop fluctuations and(H,NΔt).The average correlation values Cormaxare smaller than 0.3 ifis smaller than about 0.01,which means that pressure drop fluctuations and(H,NΔt)can be considered to be irrelevant.This result is suitable to all pressure drop fluctuation frequencies from 447 Hz to 3568 Hz,although threshold values of relative pressure amplitudes are different possibly.

Fig.8 FFT dominant frequencies of(H,NΔt).
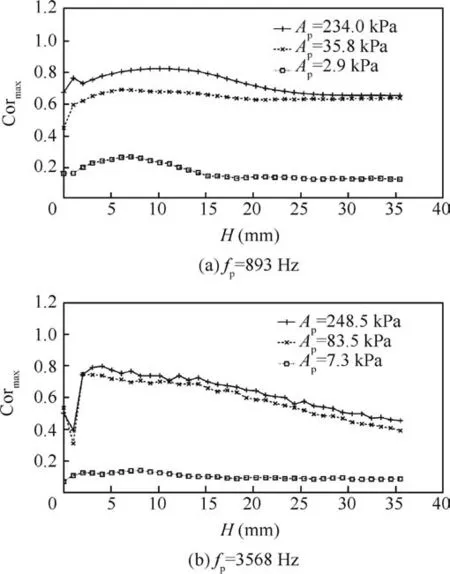
Fig.9 Maximum correlation values Cormaxbetween(H,NΔt)and pf(t).
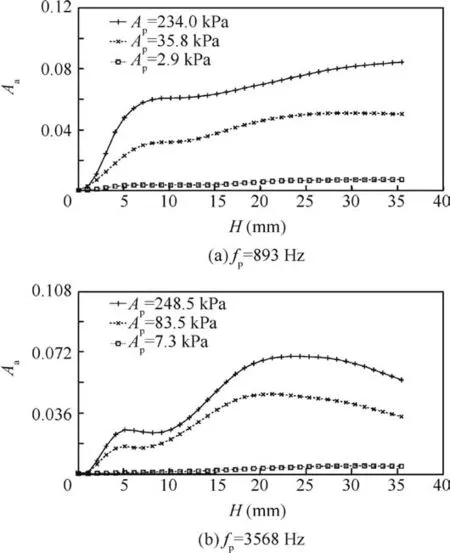
Fig.10 FFT dominant amplitudes of (H,NΔt).

Fig.11 Correlation values Cormaxbetween pf(t)and (H,NΔt).
Fig.12 shows phase differences θpdbetween(H,NΔt)along the injector axis and pressure drop fluctuations pf(t)at two different pressure drop fluctuation frequencies.H ranges from 3 mm to 34 mm.Every sub figure consists of three operating points of different pressure drop fluctuation amplitudes at the same frequency.Compared with pressure drop fluctuation frequencies,the effect of pressure drop fluctuation amplitudes on the phase differences is relatively less obvious.Discrepancies between different pressure drop fluctuation amplitudes could attribute to different wave shapes of pressure fluctuations,since pressure fluctuations modulated by the hydrodynamic mechanical pulsator are not purely sinusoidal.Thus,the phase differences between(H,NΔt)and pressure drop fluctuations pf(t)could be considered to be insensitive to pressure drop fluctuation amplitudes.
Fig.13 shows the phase differences θpdbetween(H,NΔt)along the injector axis and pressure drop fluctuations pf(t)at five different pressure drop fluctuation frequencies fp.As mentioned above,our research background is acoustic combustion instabilities.According to Rayleigh criterion,the phase relation between atomization fields and acoustic pressure fluctuations should be paid an attention.Generally,acoustic pressure fluctuations in combustion chambers are out of phase with injection pressure drop fluctuations.In this study,it is postulated that the phase difference of the two pressure fluctuations is 180°.It is an acceptable approximation if modulated pressure fluctuations in feeding pipes are smaller than acoustic pressure fluctuations in combustion chambers.Based on this approximation,the in-phase regions of(H,NΔt)and hypothetical back pressure fluctuations are from 90°to 270°and from 450°to 630°,as is shown in Fig.13.

Fig.12 Phase differences between(H,NΔt)and pf(t)at two different fp.
For the fluctuation frequency of 448 Hz,the phase differences are always smaller than 90°,which means that atomization fields are out of phase with hypothetical back pressure fluctuations in the interrogation regions where H ranges from 3 mm to 34 mm.For the fluctuation frequency of 893 Hz,the phase differences are located in the in-phase region from 90°to 270°if H is larger than about 13 mm.Contrary to 893 Hz,the phase differences are located in the in-phase region if H is smaller than about 20 mm at the fluctuation frequency of 1338 Hz.At the fluctuation frequency of 1784 Hz,there are two in-phase regions:ranging from 3 mm to 10 mm and from 27 mm to 34 mm,respectively.The situation of 2230 Hz is similar to that of 1784 Hz.

Fig.13 Phase differences between (H,NΔt)and pf(t)at five different fp.
In order to further assess the phase relation between(H,NΔt)and hypothetical back pressure fluctuations,correlation valuesbetween(H,NΔt)along the injector axis and-pf(t)are calculated,as is shown in the following equation:
where Ntis the sum of sampling of correlation calculation.
Fig.14 shows correlation valuesbetween(H,NΔt)along the injector axis and-pf(t)at different pressure drop fluctuation frequencies.Correlation values are always minus in all interrogation regions at the pressure fluctuation frequency of 448 Hz,as is shown in Fig.14(a).Correlation values are larger than zero when H is larger than about 13 mm at the pressure fluctuation frequency of 893 Hz,as is shown in Fig.14(b).The maximum correlation value is up to 0.74 at the distance H=31 mm.As is shown in Fig.14(c),for the pressure fluctuation frequency of 2230 Hz,there are two positive regions of correlation values,where H ranges from 3 mm to 4 mm and from 17 mm to 29 mm,respectively.The first maximum correlation value is 0.4 at the distance H=3 mm and the second maximum correlation value is 0.79 at the distance H=24 mm.

Fig.14 )between(H,NΔt)and-pf(t).
4.Atomization Mie scatter image tests
4.1.Experimental conditions
Although backlit image photography can be used to assess periodicity of atomization and to display time-varying trend of mass flow rates in atomization fields,it is just a qualitative measurement and cannot further show physical quantities relating to combustion.Atomization Mie scatter images were captured according to the experimental setup in Fig.4.Miescattering intensity is approximately proportional to surface area of droplets,as is shown in Eq.(1).Time-varying integral of Mie-scattering signal intensity on some cross-section represents variation of gross surface area of droplets,which is strongly relevant to propellant evaporation rates in combustion chambers.Droplet size of atomization was measured by using a PDPA(Phase Doppler Particle Analyzer)in our study since validation of Eq.(1)depends on droplet sizes.Sauter mean diameter(D32)ranges from 123 μm to 137 μm in the cross-section of which the vertical distance from the injector plate(ZPDPA)is 30 mm,as shown in Fig.15.Fig.16 shows a typical distribution of droplet sizes at one point.
In our study,atomization Mie scatter images were captured at five different pressure drop fluctuation frequencies from 224 Hz to 1116 Hz,due to limitation of laser pulse frequency of 4500 Hz.Strouhal number St=fpdo/Ujand the pressure drop fluctuation frequency fpis shown in Table 2 for five different fluctuation frequencies.
4.2.Results
Fig.17 shows atomization Mie scatter images and timevarying integral of Mie-scattering signal intensity on the cross-section(t)at the distance from the injector plate H=50 mm.Fig.17(a)and(b)respectively show atomization Mie scatter images with maximum and minimum signal intensity at pressure drop fluctuation frequency of 670 Hz and fluctuation amplitude of 187 kPa.Corresponding relative timevarying integral of Mie-scattering signal intensity(t)is shown in Fig.17(c),which is labeled with instants of Fig.17(a)and(b)by using vertical solid and dashed lines respectively.(t)is defined as the following equations:

Fig. 15 Distribution of Sauter mean diameter(ZPDPA=30 mm).

Fig.16 Number distribution of droplet sizes(XPDPA=0 mm,YPDPA=3 mm,ZPDPA=30 mm,D32=130 μm).

Table 2 Strouhal number of impinging jet injector element at different frequencies of pressure drop fluctuations in atomization Mie scatter image tests.
where Nsmis the sampling number of Mie scatter images,Δtcsis sampling time interval of Mie scatter images,Ics(iΔtcs)is time-varying integrals of Mie-scattering signalintensity,Gs(k,j,iΔtcs)is Mie-scattering signal intensity detected on a camera pixel with the time,m and n are dimensions of atomization Mie scatter images.
As is shown in Fig.17,atomization Mie-scattering intensity with pressure drop fluctuations features high amplitude fluctuations and obvious periodicity.The ratio of maximum to minimum is larger than 2 at pressure drop fluctuation frequency of 670 Hz and fluctuation amplitude of 187 kPa.It is indicated that the gross surface area of propellant droplets could change drastically with time in occurrence of combustion instabilities.It is known that vaporization rate of propellants relies strongly on the gross surface area of propellant droplets.Thus,it is possible that vaporization rate of propellants is periodic in unstable combustion chambers due to Klystron effect of injection modulated by pressure drop fluctuations.
Fig.18 shows temporal FFT amplitudeofwith pressure drop fluctuation amplitude at different fluctuation frequencies.basically increases with pressure drop fluctuation amplitude for the five different fluctuation frequencies.This result corresponds to that of atomization backlit image tests and quantitatively certifies the Klystron effect of periodic injection modulated by pressure drop fluctuation on subsequent atomization and vaporization processes.
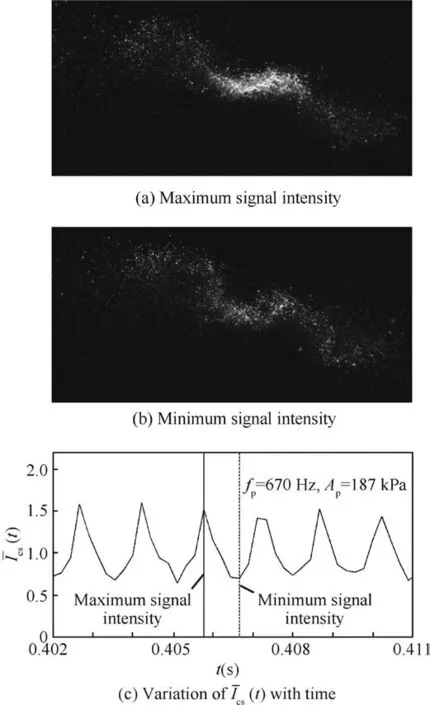
Fig.17 Atomization Mie scatter images and

Fig.18 Dominant FFT amplitudeofwith pressuredrop fluctuation amplitude.
5.Conclusions
In this paper we describe an experimental study on the Klystron effect of periodic injection modulated by pressure drop fluctuations on subsequent atomization. Time-resolved atomization backlit images and atomization Mie scatter images were captured by using the high speed camera.
In atomization backlit image tests,the average reversed grayscale intensity of the interrogation windows(H,NΔt)with time qualitatively characters time-varying trend of mass flow rate through some locations in atomization fields.The strength of Klystron effect is governed by the pressure drop fluctuation amplitude.Correlation between(H,NΔt)and pressure drop fluctuations strongly relies on the pressure drop fluctuation amplitude.It is found that there is a threshold of pressure drop fluctuation amplitude to periodic atomization,although the precise threshold cannot be determined in this paper.Approximately,the correlation between atomization and pressure drop fluctuations is strong(Cormax>0.7)ifis larger than about 0.1,and atomization is irrelevant with pressure drop fluctuations ifis smaller than about 0.01.This feature of periodic atomization induced by Klystron effect corresponds to periodicities and high amplitudes of pressure fluctuations in unstable combustion chambers and chaos and low amplitudes of pressure fluctuations in stable combustions chambers.Strouhal number of periodic atomization of the impinging jet injector element ranges from 0.007 to 0.110 in this paper.The Strouhal number of modulated periodic atomization is obviously smaller than that of free atomization(the average Strouhal number is about 0.2).Besides,there are no discerned differences of periodic atomization thresholds at different fluctuation frequencies.Approaching to the average natural frequency of atomization does not mean that atomization is more sensitive to pressure drop fluctuations.Accordingly,modulated atomization of impinging jetinjector elements is a quite different process from free atomization of those.
The phase differences between(H,NΔt)and pressure drop fluctuations pf(t)are insensitive to pressure drop fluctuation amplitudes.These phase differences mainly rely on pressure drop fluctuation frequencies.If it is postulated that the distance between heat release regions and the injector plate ranges from 20doto 35do,there would be an in-phase relation between atomization and imaginary back pressure fluctuations at frequencies of 893 Hz,1784 Hz and 2230 Hz respectively corresponding to St of 0.028,0.056 and 0.070.
In atomization Mie scatter image tests,it is found that the Klystron effect of injection modulated by pressure drop fluctuations can lead to drastic varying of gross surface area of droplets with time.The ratio of maximum to minimum is larger than 2 in this study.It is known that the gross surface area of droplets strongly relates to vaporization rates of propellants.
Although the importance of periodic impinging jet atomization modulated by pressure drop fluctuations for acoustic liquid propellant combustion instabilities was illustrated,the specific role of periodic atomization played in acoustic combustion instabilities with impinging jet injectors should be investigated further.Especially in simulation of combustion instabilities with impinging jet injectors,the threshold phenomenon of periodic atomization and the phase difference between periodic atomization and pressure fluctuations should be taken into account.
Acknowledgements
This work was supported by the National Natural Science Foundation of China(Nos.11502186 and 51606138);the National Key Basic Research Program of China;National Key Scientific Instrument and the Equipment Development Projects of China(No.2012YQ04016408).
杂志排行

CHINESE JOURNAL OF AERONAUTICS的其它文章
- Review on active thermal protection and its heat transfer for airbreathing hypersonic vehicles
- Computational study of wing deformation and sting interference effects with the CAE-AVM test case
- Experimental investigation and correlation development of jet impingement heat transfer with two rows of aligned jet holes on an internal surface of a wing leading edge
- Turbulent characteristics and rotation correction of wall function in rotating channel with high local rotation parameter
- Training effectiveness evaluation of helicopter emergency relief based on virtual simulation
- Integrating BDS and GPS for precise relative orbit determination of LEO formation flying