基于温度植被干旱指数的兖州煤田煤炭开采影响边界遥感提取
2018-10-11殷守强
李 晶,韩 颖,杨 震,苗 辉,殷守强
基于温度植被干旱指数的兖州煤田煤炭开采影响边界遥感提取
李 晶,韩 颖,杨 震,苗 辉,殷守强
(中国矿业大学(北京)地球科学与测绘工程学院,北京 100083)
为识别植被覆盖区煤炭开采的生态影响边界,该文以兖州煤田为研究区域,应用温度植被干旱指数TVDI (temperature vegetation drought index)反演沉陷积水区外围的土壤湿度空间分布特征,利用MATLAB拟合TVDI变化趋势并依据其趋于稳定的渐近线,反解煤炭开采活动对矿区生态的影响边界,将其与采用MSCS(mining subsidence prediction system,MSCS)软件预计获得的下沉10 mm沉陷边界进行对比。结果表明:不同距离的TVDI中位数随距积水区边缘距离的变化表现为先增加后趋于平稳、呈指数变化特征;基于TVDI分析得到的煤炭开采的非积水影响范围,仅相当于沉陷积水面积的2.07倍,预计沉陷非积水面积与预计沉陷积水面积之比为4.63倍。通过模型拟合遥感指数随距离的变化特征,能够获得煤炭开采的影响边界;兖州煤田基于TVDI获取的煤炭开采影响面积,相对小于预计的开采沉陷面积。该研究可为确定煤炭开采对生态影响的边界提供参考。
遥感;生态;矿区;煤炭开采;沉陷积水区;温度植被干旱指数;土壤湿度;影响边界
0 引 言
煤炭是中国的基础能源,主要开采方式为井工开 采[1],开采过程不可避免地导致地表沉陷,并对土地利用、土壤质量、植被生长等造成影响。煤炭开采引起的生态环境影响一定程度上具有空间传递或空间扩散性,一直以来,学术研究与规划实践中一般采用《建筑物、水体、铁路及主要井巷煤柱留设与压煤开采规程》(安监总煤 装〔2017〕66号)(简称《三下采煤规程》)中地表下沉 10 mm边界作为采煤对地表的扰动边界,该边界是基于对建筑物的影响划定的。编制土地复垦方案时普遍选取地表水平变形、附加倾斜、下沉深度、沉陷后潜水位埋深以及耕地生产力下降等指标对土地损毁程度分级评定,但土地复垦范围仍以预计10 mm下沉等值线作为边界。一方面,机械地用对建构筑物的影响边界10 mm下沉等值线作为对植被覆被区的土地生态的影响边界不适宜,另一方面,大范围监测开采影响范围或定量评估煤炭开采的生态累积效应时,采用传统变形监测或沉陷预计确定的10 mm下沉边界并不适用,有必要从典型土壤因子、典型植被因子等角度进行研究并提出适用的煤炭开采影响边界界定方法。有关学者的试验研究证明:煤炭开采对土壤含水量[2-8]、植被长势[4,9-12]等的影响从沉陷盆地下坡、中坡、上坡至非沉陷区存在有一定规律的空间变化特征。因此,选取典型土壤或植被参量进行研究,即可能形成适用于植被覆盖区的煤炭开采的影响边界界定方法。
近年来,遥感以其大范围、快速和多谱段周期性观测、信息量大等特点,在定量反演陆地表面参量及矿区生态变化动态监测中的应用日益广泛。除采用野外调查、试验分析等传统方法研究煤炭开采对土壤含水量理化特征及空间变化特征的影响[2-8]、采煤沉陷区与非沉陷区植被长势空间分异特征[4,9-12]、矿区耕地损毁程度评价[13-14]等外,相关学者在基于时序遥感方法监测煤炭开采对地表扰动影响方面也取得了长足进展[15-17]。在前述研究基础上,本文以中国东部高潜水位平原煤矿区兖州煤田为例,基于土地生态要素空间异质性和距离衰减规律,通过分析与土壤湿度满足线性关系的温度植被干旱指数TVDI(temperature vegetation drought index)的空间分布特征[7,18-19],确定开采沉陷对土壤湿度的影响边界,并分析其与预计地表下沉10 mm边界的差异,为科学确定煤炭开采的生态影响边界提供一种思路。
1 研究区概况与数据来源
1.1 研究区概况
兖州煤田地处山东省兖州、曲阜、邹城等三市交界地带,其地理位置为东经116°10¢~117°00¢,北纬35°10¢~35°40¢(如图1所示),是国家重点建设的八大能源基地之一,主要包括南屯、兴隆庄、鲍店、东滩、北宿、杨村等矿井,研究区面积合计258 km2。兖州煤田煤层厚且煤质优良,自20世纪80年代后期逐步进入大规模开发时期,设计总产能2451×104t,研究区气候温和,四季分明,雨热同期;地下水埋深较浅,平均为3~5 m。采煤沉陷导致矿区内大面积土地沉陷并形成积水区,农作物减产甚至绝产,对矿区内生产和生活产生了严重影响。
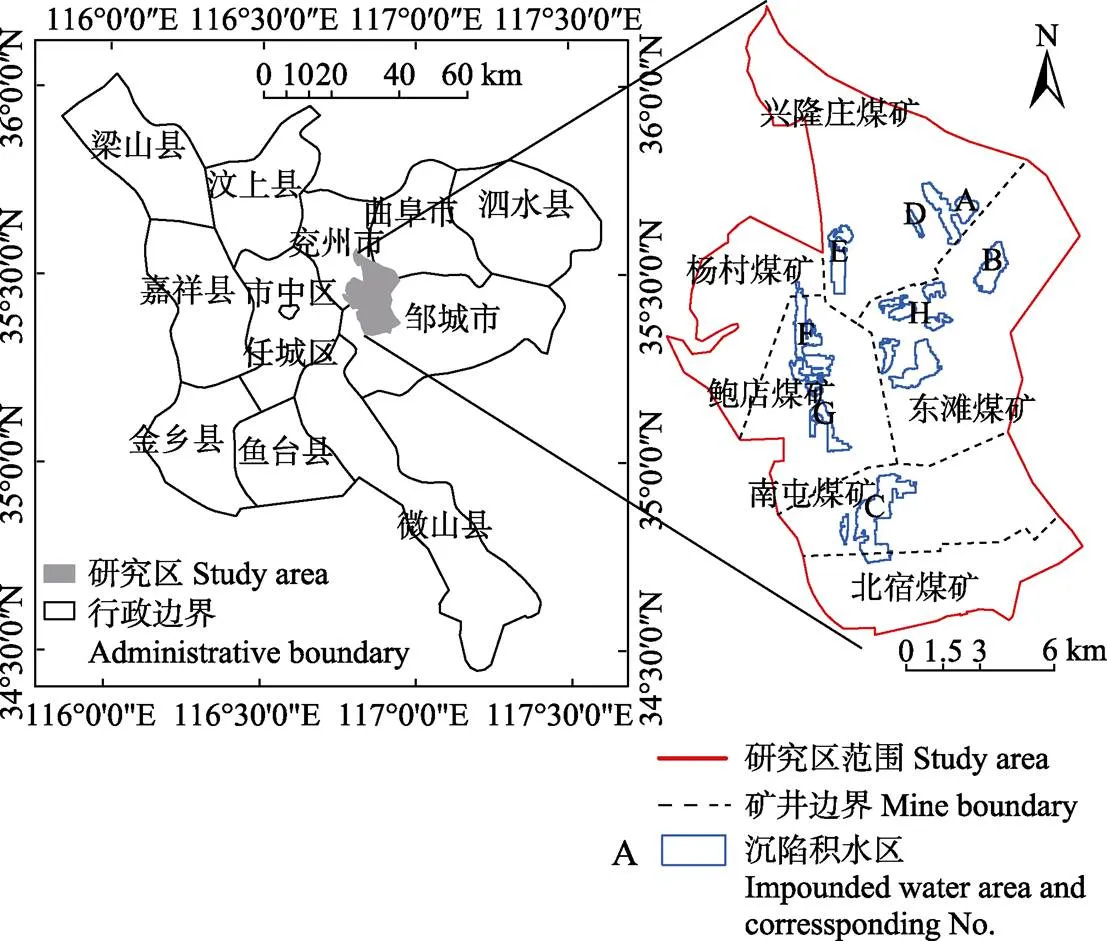
图1 研究区及沉陷积水区位置图
1.2 数据来源
选取了2009年8月30日的Landsat TM影像作为遥感数据源(http://www.gscloud.cn/),其中热红外波段空间分辨率已被重采样至30 m。影像条带号122、行编号35,空间分辨率30 m,含云量3.66%。开采计划、沉陷预计参数、地下水位观测数据通过实地调查获取,采用开采沉陷预计系统(mining subsidence prediction system,MSCS)并结合地下水位观测数据,得到10 mm下沉等值线边界和预计沉陷积水区。根据获取的TM影像数据并结合Google Earth影像,目视解译得到影像获取时间的沉陷积水区,如图1b所示。
2 研究方法
高潜水位平原矿区煤炭开采影响区域的地表形态多形成下沉盆地,在沉陷盆地底部形成常年积水区,向外至盆地边缘依次为季节性积水区和非积水坡地区,积水区通过遥感影像易于识别,难点在于非积水影响区尤其是外围边界的识别。
本文为识别高潜水位煤田区煤炭开采对矿区土地生态影响范围边界,以温度植被干旱指数TVDI为例,以每一沉陷积水区边缘为起点,自积水区边缘向外以30 m为间隔划分不同的空间梯度距离,分析不同距离像元温度植被干旱指数TVDI的中位数随距积水区距离的变化,并通过指数拟合变化趋势,依据TVDI趋于稳定的渐近线反解出煤炭开采活动对矿区生态影响的范围边界,将其与沉陷预计下沉10 mm边界进行对比分析两者差异。技术流程见图2。
2.1 数据预处理
本文对遥感影像所做的预处理包括影像的辐射校正、几何校正、波段合成、影像裁剪等。
根据开采计划进行了开采沉陷预计[20]。将开采沉陷数据等进行格式转换,应用6个矿井采掘工程平面图、相关地下水位观测数据等资料并结合下沉系数()、水平移动系数()、主要影响角正切(tan)、拐点偏移距()、开采影响传播角()等地表移动预计参数,采用概率积分法,利用开采沉陷预计系统(MSCS)获得预计地表下沉10 mm等值线以及预计地表沉陷积水区范围。
2.2 地表TVDI的反演
2.2.1 温度植被指数
研究表明,土壤水分与地表温度有关,且土壤水分与地表植被存在一种胁迫关系。研究区内像元对应的植被指数和地表温度构成的散点图呈三角/梯形空间,在三角/梯形空间中,地表温度与植被指数存在明显的负相关关系,TVDI可以由地表温度与植被指数的关系斜率来表示[21-25],能从很大程度上反映土壤湿度的状况。最大地表温度在干边上与植被覆盖度成线性关系,其原理见图3所示。
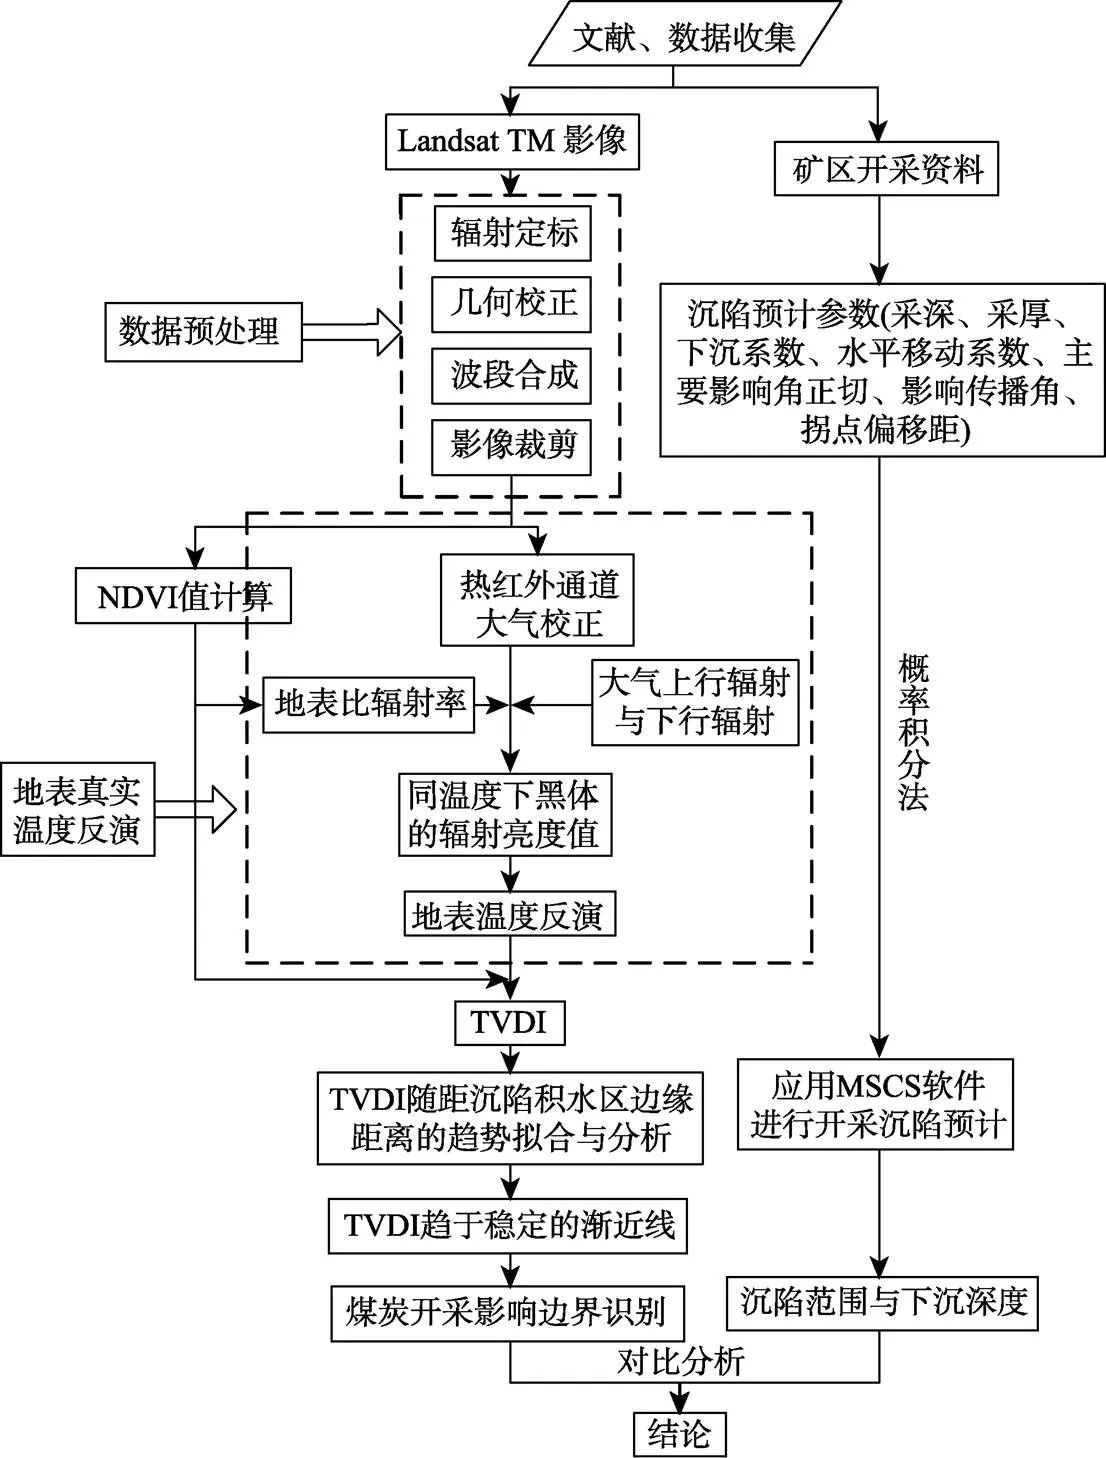
图2 煤炭开采影响边界识别研究技术流程图
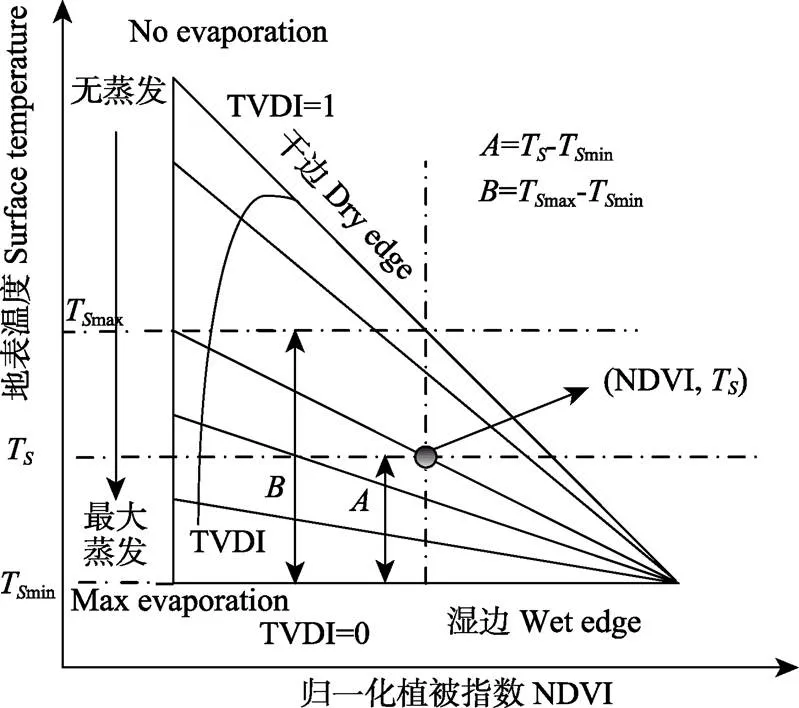
图3 地表温度与NDVI特征空间原理图
TVDI计算见式(1)。

式中T表示任意像元的地表温度;Tmin表示相同NDVI值的最小地表温度,对应T-NDVI特征空间的湿边;Tmax表示相同NDVI值的最大地表温度,对应T-NDVI特征空间的干边。其中,在T-NDVI特征空间中对湿边和干边进行模拟分别见式(2)和(3):


式中1、1、2和2分别是湿边和干边拟合方程的系数。TVDI取值范围为0~1,TVDI越大,表明越接近干边,对应的土壤水分越低。
2.2.2 NDVI和地表温度的反演
1)归一化植被指数NDVI的反演
NDVI是反映地表植被覆盖及其生长状态的重要指标,通常用红外波段与红光波段反射率差与和之间的比值表示,NDVI在植被检测方面具有灵敏度高的优势,在矿区土地利用/土地覆盖变化LUCC(land use and land cover change)检测中也得到了极为广泛的应用[17,26],其计算方法见式(4):
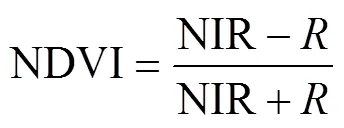
式中NIR为近红外波段的反射率,为红光波段的反射率。
2)地表温度的反演
本研究使用辐射传输方程算法,在大气参数已知的情况下根据普朗克方程来反演地表温度,该方法反演精度较高,结果也比较可靠[27-30]。温度为T的黑体在热红外波段的辐射亮度(T),见式(5):

式中为地表比辐射率,T为地表真实温度(K),(T)为普朗克定律推到得到的黑体热辐射亮度,为大气在热红外波段的透过率,↑为大气向上辐射亮度,↓为大气向下辐射亮度。式中大气在热红外波段的透过率()、大气向上辐射亮度(↑)、大气向下辐射亮度(↓)可从NASA官网(http://atmcorr.gsfc.nasa.gov/)查询。
通过式(5)以及大气辅助参数计算得到黑体热辐射亮度(T),地表真实温度(T)计算方法见式(6):
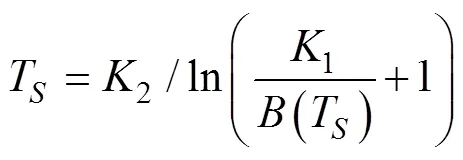
式中1,2均为常量,对于TM影像数据,1=607.76 W/(m2·sr·m),2=1260.56 K。反演得到的Landsat TM数据各像元对应的地表温度数据,主要集中在20~30 ℃之间,地表温度的低温区所占比例大。
2.2.3 温度植被干旱指数反演
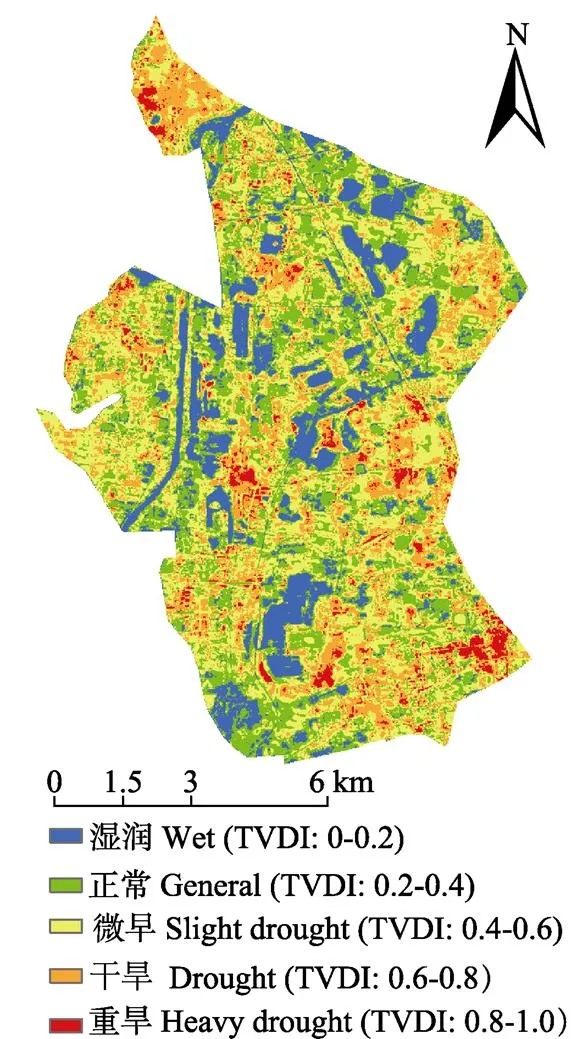
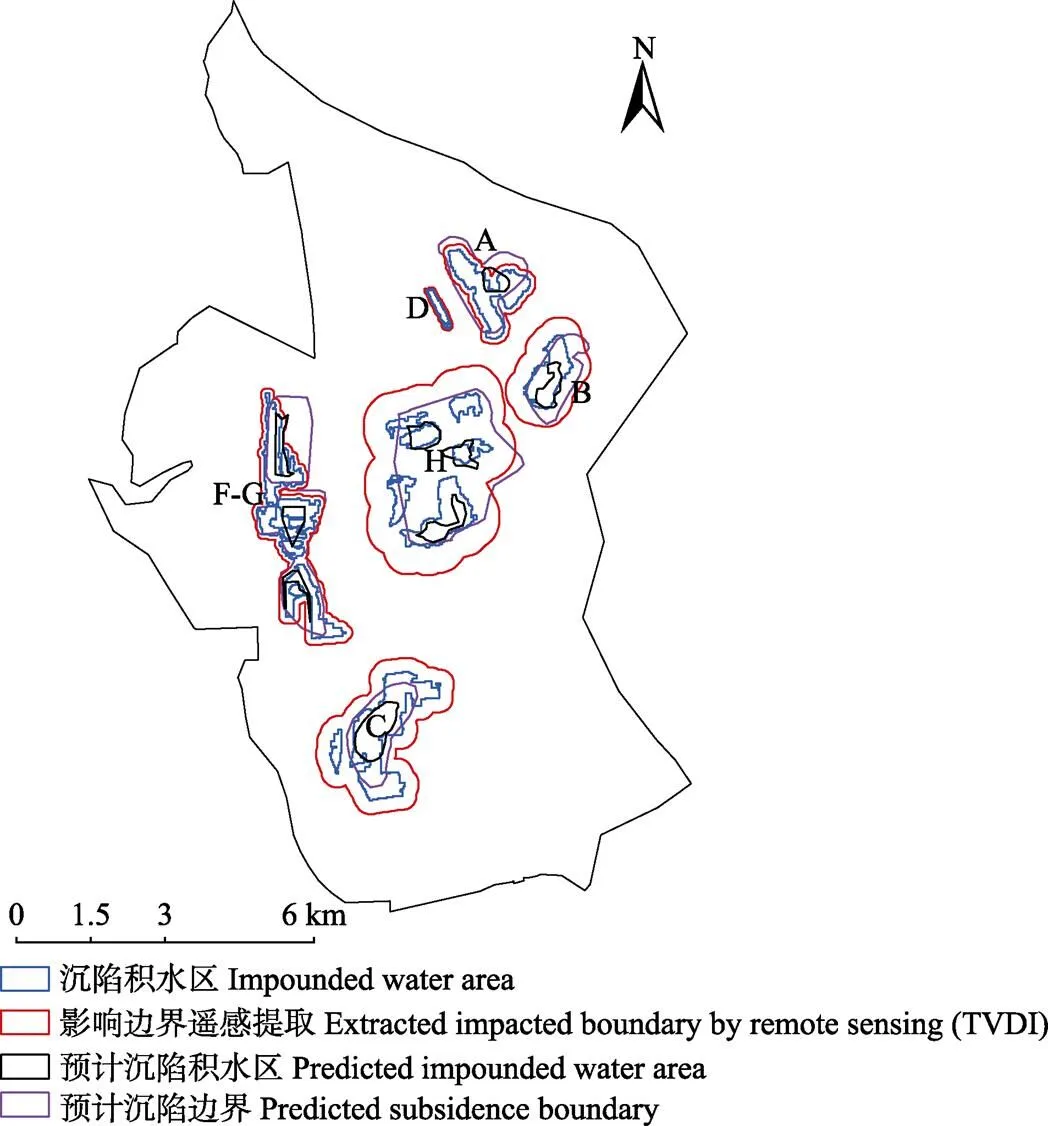
在MATLAB中以0.005为步长,提取像元NDVI值域内对应相同位置像元地表温度最大值和最小值,并绘制相应的散点图(图4)。“干边”总趋势不是一条直线,其散点可分为3段-0.14 (8) 从线性拟合的效果来看,干边线性拟合的效果更好。利用式(1)和相应的干湿边方程式(7)及式(8),计算得到TVDI空间分布数据集[31],如图5所示。研究区内TVDI集中分布在0.2~0.4、0.4~0.6之间,土壤湿度主要集中在“正常”和“微旱”2个等级,“正常”土壤湿度等级比重最大,占研究区面积的45.17%,其次“微旱”土壤湿度等级占研究区面积的40.09%,适宜植被生长;且NDVI集中分布在0.2~0.8之间,均值为0.6,在指数函数拟合的时候不会出现较大的误差项。 煤矿区及周边,理论上存在地表生态受采煤“扰动”与“非扰动”、“有影响”与“无影响”的边界,从不同角度或不同目的,边界的划分方法不同。本研究仅考虑采煤沉陷对地表生态的直接影响(不考虑对地下水、煤炭运输、物质迁移等引起的间接影响),将反映土壤湿度状况的温度植被干旱指数(TVDI)作为生态影响的一项直接检测指标。检测指标从积水区边缘向外变化到接近“周边正常值”、趋于稳定的临界距离定义为采煤对地表生态的影响边界。兖州煤田是中国典型的高潜水位煤矿区,煤炭开采造成的地表沉陷积水区相对容易识别,而难点则在于确定非积水区开采沉陷直接影响的“边界”。 图5 研究区TVDI空间分布 在ArcGIS中提取沉陷积水区边缘TVDI像元中心点,从沉陷积水区边缘向外,以像元分辨率30 m为距离间隔,由近及远划分不同的空间距离梯度。分析不同距离的TVDI中位数随距积水区边缘距离的变化规律,并求出TVDI趋于稳定的值,见式(9): 式中代表拟合值;代表拟合初始值(沉陷积水区边缘向外第一个像元距离的TVDI中位数);¢代表变化速度,代表渐近线(即TVDI趋于稳定的值),代表距沉陷积水区边缘的距离。 根据渐近线(TVDI的稳定值),确定对地表生态影响边界。将拟合模型引入误差项,TVDI的变化范围很小,取0.005倍的稳定值(即0.005)作为误差项,对随积水区往外TVDI达到稳定的距离()进行估计,见式(10): 式(10)取“=”时,得到采煤沉陷对土壤湿度的影响边界。 研究区内TVDI不仅受到采煤沉陷的影响,也受到建设活动、土地利用差异等其他因素的影响,为了减少其他因素影响:1)自然水体、建设用地光谱特征与植被覆盖区域差异大,且几何分布特征不同,容易识别。剔除积水区边缘的自然水体、建设用地、未利用地像元,利用纯净的有植被像元点的TVDI研究采煤沉陷积水区对土壤湿度空间特征分布的影响;2)空间交互受到距离衰减效应的影响,空间上相近的区域具有更高的属性相似性和交互强度[32],为减小空间交互作用的影响,剔除沉陷积水区边缘以外300 m范围内其他小范围积水区的像元点。东滩矿区的沉陷积水区之间最小距离60 m,空间交互作用显著,将其作为一个整体从其外缘向外进行分析;3)位于研究区边界的沉陷积水区,同一沉陷单元仅部分位于研究区内,故不做分析(如图1中的沉陷积水区E,距离研究区边界最近距离为220 m)。通过式(9)拟合不同距离的TVDI中位数随距积水区边缘距离的变化规律,如图6所示。以沉陷积水区A为例,越靠近沉陷积水区边缘TVDI值越低,在其向外90 m范围内,TVDI变化幅度最明显,周边土壤湿度所受影响最大,在120 m范围外,TVDI值在0.395左右小幅度上下波动。其他沉陷积水区也有相同的变化规律,随着距积水区边缘距离增加,TVDI均呈现先增加后趋于稳定的趋势。 图6 TVDI随距积水区边缘距离的变化特征 根据不同距离TVDI中值变化确定井工煤炭开采对地表生态的扰动边界,式(9)拟合的结果较好,各积水区向外TVDI趋于稳定的稳定值在0.38~0.43之间,相关系数均达到0.6以上,且最高达到0.95,均方根误差均小于0.02。受煤层及赋存特征、开采规模与方法、最大下沉深度、地下水位变化、沉陷积水区范围等因素影响,各沉陷积水区边缘向外TVDI趋于稳定的稳定值()与距离()均有差异。根据图6知,截止2009年底煤炭产量最多的东滩矿区,其破碎且不规则的沉陷积水区H,空间交互作用明显,影响范围最大,距积水区边缘达到了781 m;积水区D面积最小,影响范围也最小,为53 m。其他沉陷积水区A、B、C、F、G的影响范围分别为143、501、386、119、181 m。 2009年的预计沉陷积水区和预计地表沉陷边界图,与兖州煤田煤炭开采沉陷积水对土壤湿度的影响边界图叠加,如图7所示。统计兖州煤田实际沉陷积水面积、提取的煤炭开采非积水影响范围、预计沉陷积水面积与预计沉陷非积水面积,见表1所示。2009年实际沉陷积水总面积为14.91 km2,基于TVDI提取的兖州煤田煤炭开采非积水影响面积为30.91 km2;预计沉陷积水面积为4.69 km2,预计沉陷非积水面积为21.72 km2。预计的沉陷积水面积普遍小于实际沉陷积水面积,这是由于预计的沉陷积水区是根据当地地下潜水位测算的,且实际开采情况相比于最初的开采计划发生了变化,在这样的情况下进行2种方法得到的开采影响面积绝对值比较的意义不大。 图7 2009年兖州煤田影响边界空间分布 表1 提取结果与沉陷预计结果比较 上述数据相对比较分析仍能发现:采用10 mm下沉等值线作为开采影响边界,预计沉陷非积水面积是预计沉陷积水面积的4.63倍,而基于TVDI分析得到的煤炭开采非积水影响范围,仅相当于实际沉陷积水面积的2.07倍。由此推测,煤炭开采对以地表土壤湿度等生态因子的影响面积要小于以地表下沉10 mm作为影响边界的范围。需要说明的,采用本文提出的方法与采用10 mm下沉等值线确定煤炭开采影响边界,两者不存在优劣的差异,只是两者适用条件不同,前者更适用于采煤对建构筑物影响边界的界定,后者更适用于确定植被覆盖区煤炭开采对地表生态的影响边界,尤其是针对大范围的煤炭开采影响范围或累积效应界定时将更为适宜。 本文以东部高潜水位平原区兖州煤田为研究区,分析了沉陷积水区边缘向外600 m范围内像元中心的TVDI中位数随距离的变化特征,提取了典型区地下开采对地表生态的影响边界,将之与开采沉陷预计下沉10 mm边界进行了对比分析。结论如下: 1)从沉陷积水区边缘向外,以像元分辨率30 m为距离间隔,由近及远TVDI中位数随距积水区边缘距离的增加呈现先增加后趋于稳定的趋势,TVDI值在某一值附近小幅度上下波动并趋于平稳。指数模型拟合表明,相关系数均达到0.6以上,且最高达到0.95,均方根误差均小于0.02。 2)采用10 mm下沉等值线作为预计开采沉陷边界,预计沉陷非积水面积是预计沉陷积水面积的4.63倍,而基于TVDI分析得到的煤炭开采的非积水影响范围,则仅相当于实际沉陷积水面积的2.07倍。两者比较说明,以地表土壤湿度等生态因子测算的煤炭开采影响面积要小于以地表下沉10 mm作为影响边界的范围。 煤炭开采对地表生态影响是多维的,涉及地形、土壤、植被、动物、地表及地下水环境、大气等,本研究在传统的仅依据地表下沉值等确定开采影响范围的基础上,提出了基于遥感指数随距离变化的趋势拟合和变化趋于稳定的渐近线来反解开采沉陷对地表生态的影响边界的方法。虽然不能全面、综合、系统地揭示煤炭开采的影响范围,但是从一个新的视角——遥感生态指数空间变化趋于稳定的理论边界来进行研究,有助于改进仅应用10 mm下沉等值线确定煤炭开采生态影响边界过于“机械”和不适用于植被覆盖区的弊端,且可以应用于大范围、长时序的研究,有助于定量研究煤炭开采影响范围及其时空生态累积效应。 [1] 张发旺,侯新伟,韩占涛,等. 采煤塌陷对土壤质量的影响效应及保护技术[J]. 地理与地理信息科学,2003,19(3):67-70. Zhang Fawang, Hou Xinwei, Han Zhantao, et al. Impact of coal mining subsidence on soil quality and some protecting technique for the soil quality[J]. Geography and Geo- Information Science, 2003, 19(3): 67-70. (in Chinese with English abstract) [2] Zhang Fawang, Song Yaxin, Zhao Hongmei, et al. changes of precipitation infiltration recharge in the circumstances of coal mining subsidence in the Shen-Dong coal field, China[J]. Acta Geologica Sinica- English Edtion, 2012, 86(4): 993-1003. [3] 邹慧,毕银丽,朱郴韦,等. 采煤沉陷对沙地土壤水分分布的影响[J]. 中国矿业大学学报,2014,43 (3):496-501. Zou Hui, Bi Yinli, Zhu Chenwei, et al. Effect of mining subsidence on soil moisture dynamic changes of sandy land[J]. Journal of China University of Mining &Technology, 2014, 43(3): 496-501. (in Chinese with English abstract) [4] 王尚义,牛俊杰,朱炜歆,等. 晋西北矿区、非矿区不同植被下土壤水分特征[J]. 干旱区研究,2013,30(6):986-991. Wang Shangyi, Niu Junjie, Zhu Weixin, et al. Change of soil moisture content under different plant species in mining and non-mining areas in Northwest Shanxi province[J]. Arid Zone Research, 2013, 30(6): 986-991. (in Chinese with English abstract) [5] 卞正富,雷少刚,常鲁群,等. 基于遥感影像的荒漠化矿区土壤含水率的影响因素分析[J]. 煤炭学报,2009,34(4):520-525. Bian Zhengfu, Lei Shaogang, Chang Luqun, et al. Affecting factors analysis of soil moisture for arid mining area based on TM images[J]. Journal of China Coal Society, 2009, 34(4): 520-525. (in Chinese with English abstract) [6] 王纯枝,毛留喜,何延波,等. 温度植被干旱指数法(TVDI)在黄淮海平原土壤湿度反演中的应用研究[J]. 土壤通报,2009,40(5):998-1005. Wang Chunzhi, Mao Liuxi, He Yanbo, et al. Application of temperature-vegetation dryness index (TVDI) in estimation of soil moisture in the Huanghuaihai Plain[J]. Chinese Journal of Soil Science, 2009, 40(5): 998-1005. (in Chinese with English abstract) [7] 顾和和,胡振琪. 开采沉陷对耕地生产力定量评价[J]. 中国矿业大学学报,1998,27(4):414-417. Gu Hehe, Hu Zhenqi. Quantitative evaluation of impact of mining subsidence on farmland productivity[J]. Journal of China University of Mining& Technology, 1998,27(4): 414-417. (in Chinese with English abstract) [8] 孙灏,陈云浩, 孙洪泉. 典型农业干旱遥感监测指数的比较及分类体系[J]. 农业工程学报,2012,28(14):147-154. Sun Hao, Chen Yunhao, Sun Hongquan. Comparisons and classification system of typical remote sensing indexes for agricultural drought[J]. Transactions of the Chinese Society of Agricultural Engineering (Transactions of the CSAE), 2012, 28(14): 147-154. (in Chinese with English abstract) [9] 许传阳,马守臣,张合兵,等. 煤矿沉陷区沉陷裂缝对土壤特性和作物生长的影响[J]. 中国生态农业学报,2015,23(5):597-604. Xu Chuanyang, Ma Shouchen, Zhang Hebing, et al. Effect of cracks on soil characteristics and crop growth in subsided coal mining areas[J]. Chinese Journal of Eco-Agriculture, 2015, 23(5): 597-604. (in Chinese with English abstract) [10] 吴立新,马保东,刘善军. 基于SPOT卫星NDVI数据的神东矿区植被覆盖动态变化分析[J]. 煤炭学报,2009,34(9):1217-1222. Wu Lixin, Ma Baodong, Liu Shanjun. Analysis to vegetation coverage change in Shendong mining area with SPOT NDVI data[J]. Journal of China Coal Society, 2009,34(9): 1217-1222. (in Chinese with English abstract) [11] 廖程浩,刘雪华. 阳泉煤炭开采对区域植被影响范围的3S识别[J]. 自然资源学报,2010,25(2):185-191. Liao Chenghao, Liu Xuehua. Identifying the mining impact range on the vegetation of Yangquan coal mining region by using 3S technology[J]. Journal of Natural Resources, 2010, 25(2): 185-191. (in Chinese with English abstract) [12] 张沛沛,刘文锴,吕鹏,等. 采煤沉陷区积水对作物产量的影响研究[J]. 煤炭工程,2016,48(5):94-97. Zhang Peipei, Liu Wenkai, Lv Peng. Effects of coal mining subsidence ponding on crop yield[J]. Coal Engineering, 2016, 48(5): 94-97. (in Chinese with English abstract) [13] 李晶,刘喜韬,胡振琪,等. 高潜水位平原采煤沉陷区耕地损毁程度评价[J]. 农业工程学报,2014,30(10):209-216. Li Jing, Liu Xitao, Hu Zhenqi, et al. Evaluation on farmland damage by underground coal-mining in plain area with high ground-water level[J]. Transactions of the Chinese Society of Agricultural Engineering (Transactions of the CSAE), 2014, 30(10): 209-216. (in Chinese with English abstract) [14] 程琳琳,赵云肖,陈良. 高潜水位采煤沉陷区土地损毁程度评价[J]. 农业工程学报,2017,33(21):253-260. Cheng Linlin, Zhao Yunxiao, Chen Liang. Evaluation of land damage degree of mining subsidence area with high groundwater level[J]. Transactions of the Chinese Society of Agricultural Engineering (Transactions of the CSAE), 2017, 33(21): 253-260. (in Chinese with English abstract) [15] 李晶,Zipper Carl E,李松,等. 基于时序NDVI的露天煤矿区土地损毁与复垦过程特征分析[J]. 农业工程学报,2015,31(16):251-257. Li Jing, Zipper Carl E, Li Song, et al. Character analysis of mining disturbance and reclamation trajectory in surface coal-mine area by time-series NDVI[J]. Transactions of the Chinese Society of Agricultural Engineering (Transactions of the CSAE), 2015, 31(16): 251-257. (in Chinese with English abstract) [16] Li Jing, Zipper C E, Donovan P F, et al. Reconstructing disturbance history for an intensively mined region by time-series analysis of Landsat imagery[J]. Environmental Monitoring and Assessment, 2015, 187(9): 1-17. [17] 李晶,焦利鹏,申莹莹,等. 基于IFZ与NDVI的矿区土地利用/覆盖变化研究[J]. 煤炭学报,2016,41(11):2822-2829. Li Jing, Jiao Lipeng, Shen Yingying, et al. Land use and cover change in coal mining area by IFZ and NDVI[J]. Journal of China Coal Society,2016, 41(11): 2822-2829. (in Chinese with English abstract) [18] Sandholt I, Rasmussen K, Andersen J A, et al. A simple interpretation of the surface temperature/vegetation index space for assessment of surface moisture status[J]. Remote Sensing of Environment, 2002, 79(23): 213-224. [19] Zawadzki J, Przeździecki K, Miatkowski Z. Determining the area of influence of depression cone in the vicinity of lignite mine by means of triangle method and LANDSAT TM/ETM+satellite images[J]. Journal of Environmental Management, 2016, 166: 605-614. [20] 蔡来良. 适宜倾角变化的开采沉陷一体化预测模型研究[D]. 北京:中国矿业大学,2011. Cai Lailiang . For Any Dip Angle and Integrated Mining Subsidence Calculation Model Research[D]. Beijing: China University of Mining and Technology, 2011. (in Chinese with English abstract) [21] Carlson T. An overview of the "Triangle Method" for estimating surface evapotranspiration and soil moisture from satellite imagery[J]. Sensors, 2007, 7(8): 1612-1629. [22] Carlon T N, Gillies R R, Perry E M. A method to make use of thermal infrared temperature and NDVI measurements to infer surface soil water content and fractional vegetation cover[J]. Remote Sensing Reviews, 1994, 9(1): 161-173. [23] 李芳花,辛景峰,刘迪,等. 特征空间法与墒情监测应用分析[J]. 黑龙江水专学报,2005,32(2):1-3. Li Fanghua, Xin Jingfeng, Liu Di, et al. Application analysis of the characteristic space method in soil moisture monitoring [J]. Journal of Heilongjiang Hydraulic Engineering College, 2005, 32(2): 1-3. (in Chinese with English abstract) [24] 刘英,吴立新,岳辉. 基于梯度结构相似度的矿区土壤湿度空间分析[J]. 武汉大学学报(信息科学版),2018,43(1):87-93. Liu Ying, Wu Lixin, Yue Hui. Spatial distribution characteristics analysis of soil moisture in desertification mining areas based on gradient-based structural similarity[J]. Geomatics and Information Science of Wuhan University, 2018, 43(1): 87-93. (in Chinese with English abstract) [25] 张顺谦,卿清涛,侯美亭,等. 基于温度植被干旱指数的四川伏旱遥感监测与影响评估[J]. 农业工程学报,2007,23(9):141-146. Zhang Shunqian, Qing Qingtao, Hou Meiting , et al. Remote sensing and impact estimation for Sichuan hot-drought based on temperature vegetation dry ness index[J]. Transactions of the Chinese Society of Agricultural Engineering (Transactions of the CSAE), 2007, 23(9): 141-146. (in Chinese with English abstract) [26] 马保东,陈绍杰,吴立新,等. 基于SPOT-VGT NDVI的矿区植被遥感监测方法[J]. 地理与信息科学,2009,25(1):84-87. Ma Baodong, Chen Shaojie, Wu Lixin, et al. Vegetation monitoring method in mining area based on SPOT-VGT NDVI[J]. Geography and Geo-Information Science, 2009, 25(1): 84-87. (in Chinese with English abstract) [27] 覃志豪,李文娟,徐斌. 陆地卫星TM6波段范围内地表比辐射率的估计[J]. 国土资源遥感,2004,16(3):28-41. Qin Zhihao, Li Wenjuan, Xu Bin. The estimation of land surface emissivity for Landsat TM6[J]. Remote Sensing for Land &Resource, 2004, 16(3): 28-41. (in Chinese with English abstract) [28] 覃志豪, Zhang Minghua, Arnon Karnieli, 等. 用陆地卫星TM6数据演算地表温度的单窗算法[J]. 地理学报,2001,56(4): 456-466. Qin Zhihao, Zhang Minghua, Arnon Karnieli, et al. Mono- window algorithm for retrieving land surface temperature from Landsat TM6 data[J]. Acta Geographica Sinica, 2001, 56(4): 456-466. (in Chinese with English abstract) [29] 白洁,刘绍民,扈光. 针对TM/ETM+遥感数据的地表温度反演与验证[J]. 农业工程学报,2008,24(9):148-154. Bai Jie, Liu Shaomin, Hu Guang. Inversion and verification of land surface temperature with remote sensing TM/ETM+ data[J]. Transactions of the Chinese Society of Agricultural Engineering (Transactions of the CSAE), 2008, 24(9): 148-154. (in Chinese with English abstract) [30] 张戎垦,朱俊杰,范湘涛. 遥感数据的温度反演方法及其试验算例[J]. 工程勘察,2010(4):56-58. Zhang Rongken, Zhu Junjie, Fan Xiangtao. Inversion of temperature data from remote sensing[J]. Geotechnical Investigation & Surveying, 2010(4): 56-58. (in Chinese with English abstract) [31] Han Yang, Wang Yeqiao, Zhao Yunsheng. Estimating soil moisture conditions of the greater Chang-bai mountains by land surface temperature and NDVI[J]. IEEE Transactions on Geoscience and Remote Sensing, 2010, 48(6): 2509-2515. [32] 刘瑜,龚俐,童庆禧. 空间交互作用中的距离影响及定量分析[J]. 北京大学学报,2014,50(3):526-534. Liu Yu, Gong Li, Tong Qingxi. Quantifying the distance effect in spatial interactions[J]. Acta Scientiarum Universitatis Pekinensis, 2014, 50(3): 526-534. (in Chinese with English abstract) Identification of boundary about coal-mining influence on ecology by remote sensing in Yanzhou Coalfield based on temperature vegetation drought index Li Jing, Han Ying, Yang Zhen, Miao Hui, Yin Shouqiang (100083,) How to determine the ecological impact boundary of coal mining is one of the difficulties in the research field of land ecology in mining areas. For a long time, surface subsidence depth of 10 mm is generally used as the coal mining disturbance boundary not only to the developed land but also to the vegetation-covered land in the academic research and planning practice. Land reclamation is still bounded by the subsidence contour with the expected surface subsidence depth of 10 mm as the boundary. In fact, many scholars and other professionals have realized that 10 mm sinking is not adaptable as the boundary of mining influence on land ecology. Our research goal was to find a remote sensing method to identify mining impact boundary, which could be used to evaluate ecological accumulating effect of coal mining on vegetated area. Yanzhou coal field, a typical coal mine area with high groundwater level in the eastern China, was taken as the study area, where the coal mining has caused a lot of impounded water areas, and the spatial distribution characteristics of the temperature vegetation drought index (TVDI), which is linear with soil moisture, were analyzed. Then the influence boundary of mining subsidence on soil moisture was determined, and the difference between the influence boundary using TVDI spatial changing tendency and the expected surface subsidence of 10 mm was analyzed. Firstly, the authors calculated TVDI and found it was mainly concentrated in the range of 0.2-0.6, which meant soil moisture levels were mainly “normal” and “slight drought”. The areas belonging to “normal” level and “slight drought” accounted for 45.17% and 40.09% of the whole study area respectively. Secondly, the authors tried to obtain the influence boundary of soil moisture and analyzed the spatial distribution characteristics of TVDI from the edge of the impounded water area by mining subsidence. The impounded water areas i.e. A, B, C, D, F, G and H were taken as the research objects and the different distance ranges from the edge of the impounded water area were divided. With the increase of the distance from the edge of the impounded water area, the median TVDI value increased and then tended to be stable. Due to the differences in coal seam, mining methods and processes, the influence range of coal mining on soil moisture varied in different subsided areas. The authors proposed an exponential model to identify the mining influence boundary, in which the value of asymptotic line was defined as the disturbed boundary. Study results showed that TVDI stable value in each impounded water area is between 0.38 and 0.43. Fitting TVDI value with exponential function, it could be found that the correlation coefficients are greater than 0.60,and the mean square root errors are less than 0.02. The impounded water area H is fragmented, irregular and has strong internal spatial interaction, which has the largest influence distance reaching 781 m. Finally, the ecological disturbance range of coal mining based on TVDI extraction method was expected to be smaller than subsidence depth boundary, namely 10 mm. The paper¢s innovation is to propose a new method to identify the mining influence boundary, which is the theoretical boundary is the asymptotic line of ecological index changing from the edge of impounded water area to the unmined area by increased disturbance range. remote sensing; ecosystems; mining water area; coal mining; impounded area by mining subsidence; temperature vegetation drought index; soil moisture; influence boundary by mining 10.11975/j.issn.1002-6819.2018.19.033 F205;X171.4 A 1002-6819(2018)-19-0258-08 2018-04-20 2018-09-06 国家自然科学基金资助项目(41501564) 李 晶,女(汉族),吉林农安人,教授,博士,博士生导师,主要研究方向为土地利用与土地复垦、生态遥感、3S应用。Email:lijing@cumtb.edu.cn 李 晶,韩 颖,杨 震,苗 辉,殷守强. 基于温度植被干旱指数的兖州煤田煤炭开采影响边界遥感提取[J]. 农业工程学报,2018,34(19):258-265. doi:10.11975/j.issn.1002-6819.2018.19.033 http://www.tcsae.org Li Jing, Han Ying, Yang Zhen, Miao Hui, Yin Shouqiang. Identification of boundary about coal-mining influence on ecology by remote sensing in Yanzhou Coalfield based on temperature vegetation drought index[J]. Transactions of the Chinese Society of Agricultural Engineering (Transactions of the CSAE), 2018, 34(19): 258-265. (in Chinese with English abstract) doi:10.11975/j.issn.1002-6819.2018.19.033 http://www.tcsae.org
2.3 煤炭开采影响边界提取方法


3 结果与分析
3.1 煤炭开采影响边界提取

3.2 预计边界与提取边界的对比分析

4 结论与讨论
