A Spectrum Prediction-Based Frequency Band Pre-Selection over Deteriorating HF Electromagnetic Environment
2018-09-06XiChenJianYang
Xi Chen, Jian Yang*
1 School of Mechanical Engineering, Nanjing University of Science and Technology, Nanjing 210094, China
2 The 63rd Institute, National University of Defense Technology, Nanjing 210007, China
Abstract: As the earliest invented and utilized communication approach, shortwave,known as high frequency (HF) communication now experience the deterioration of HF electromagnetic environment. Finding quality frequency in efficient manner becomes one of the key challenges in HF communication.Spectrum prediction infers the future spectrum status from history spectrum data by exploring the inherent correlations and regularities. The investigation of HF electromagnetic environment data reveals the correlations and predictability of HF frequency band in both time and frequency domain. To solve this problem, we develop a Spectrum Prediction-based Frequency Band Pre-selection (SP-FBP) for HF communications. The pre-selection of HF frequency band mainly incorporated in prediction of HF spectrum occupancy and prediction of HF usable frequency, which provide the frequency band ranking of spectrum occupancy and alternative frequency for spectrum sensing,respectively. Performance evaluation via real-world HF spectrum data shows that SP-FBP significantly improves the efficiency of finding quality frequency in HF communications.
Keywords: HF electromagnetic environment;spectrum prediction; frequency band pre-selection; HF correlation; HF predictability
I. INTRODUCTION
1.1 Background and motivation
Shortwave, known as high frequency band(HF), is the midrange/long range communication approach that human earliest invented and utilized. HF can achieves short-range transmission by ground-wave, and can achieves the cross-ocean transmission by the ionosphere refraction of sky-wave. HF communication is low-cost and hard to destroy, and maybe the only long-range transmission way when satellites are unavailable. HF is used in many services (such as aeronautical, maritime, land,fixed and mobile) and many field (such as communications, radar, broadcasting and navigation), which involved several subjects and is necessary in economics and national defense.
In the past decades, HF transmitter with about 10 watts (transmit power) can achieves hundreds miles or even thousands miles communication. Currently, the radio technology is high developed, while HF transmitter with hundreds watts or even thousands watts (transmit power) usually cannot achieve an efficient communication, which seriously affects the application and development of HF. This is an emerging problem in the radio development.Today, HF sky-wave communication has become the only non-cooperative competitive frequency utilization mode for the characteristics of global transmission, i.e. HF transmission is inseparable in geographical and spectrum resources [1].
1.2 Challenges
One of the key challenges in HF communications is finding a quality frequency that will support the desired quality of service (QoS)from a transmitter to a receiver. The deteriorating HF electromagnetic environment triggers the urgent need for quality HF frequency. The challenge caused by two reasons: Firstly, the HF electromagnetic environment is deteriorating currently, accompanying with the increasing of HF transmitter and transmission power,the background noise in HF frequency band raises year by year, which in essence lead to the decrease of quality HF frequency. Second,the cross-ocean HF communications often use sky-wave propagation paths provided by ionospheric refraction, which results to the usable frequencies time-varying throughout the day,the season, the sunspot cycle, and the radio locations, etc [2].
In currently advanced HF communication systems, we perform spectrum sensing before link quality analysis (LQA) for detecting the occupancy or interference within each channel. However, without a pre-selection of HF frequency band, the spectrum sensing is blind and inefficient. The development of spectrum prediction technology provides a promising solution for finding a quality HF frequency.Spectrum sensing applies various signal detection methods to determine the current HF spectrum status, while spectrum prediction infers the future HF spectrum status from history spectrum data by exploring the inherent correlations and regularities [3]. Spectrum prediction can provide a forward-looking of the spectrum utilization for HF frequency band.
1.3 Contributions
To solve this problem, we develop a SP-FBP framework, i.e. Spectrum Prediction based Frequency Band Pre-selection for improving the efficiency of HF spectrum sensing. The main contributions of this paper are summarized as follows:
• We illustrate the deterioration of HF electromagnetic environment by real-world HF spectrum data, and the results indicate that the background noise of HF frequency band increase at the rate of 1 dB per year, which show the necessity and urgency of improving HF electromagnetic environment.
• We reveal the correlations and predictability of HF spectrum data in both time and frequency domains through real-world HF spectrum data analysis, and further derive the upper-bound predictability of HF spectrum data, which provide the basis and guideline for designing the spectrum prediction based frequency band pre-selection.
• We develop a spectrum prediction based frequency band pre-selection scheme (SPFBP) for finding a quality HF frequency band,and the comparisons with popular spectrum sensing-based schemes show that the throughput performance is greatly enhanced, which significantly improve the efficiency of HF spectrum sensing.
The remainder of the paper is organized as follows. In Section II, related studies are presented. In Section III, we illustrate the deterioration of HF electromagnetic environment by real-world HF spectrum data. In Section IV, we investigate the correlation and predictability of HF spectrum data. In Section V,we present the framework of SP-FBP, the experimental results are shown simultaneously.Conclusions and discussions are provided in Section VI.
We developed a spectrum prediction-based frequency band pre-selection over deteriorating HF electromagnetic environment in this paper.
II. RELATED WORK
People make efforts to improve the efficiency in finding quality HF frequency. In the early stage, the real time channel evaluation (RTCE) and automatic link establishment (ALE)have emerged to solve this problem [4].The first generation ALE provides the optimal frequencies by HF channel detection, the main problem is the hysteresis lead by the separation of the channel detection system and communication system. The second generation ALE based on the standards such as MILSTD-188-141A [5] and FED-STD-1045 [6],which have integrated the link quality analysis(LQA), automatic link establishment (ALE)and automatic link maintenance (ALM). In the early 21 century, the third generation ALE(3G-ALE) emerged, which carries more traffic and supports larger networks [7]. Through synchronization, the calling time to achieve a link may be reduced to no more than 10 seconds. The 3G-ALE modem signal also provides better robustness and can work in a more deteriorating channel conditions compared to 2G-ALE [8, 9].
HF transmission is inseparable in geographical and spectrum resources, i.e. HF transmission inevitably affects the HF transmission in the same frequency thousands miles away.Cognitive radio technology allows radio devices to dynamically access unoccupied channels by learning time-varying electromagnetic environment [10]. As the rapid development of HF communication technologies and the emerging of cognitive radio research, introducing the concept such as spectrum sensing,spectrum prediction and adaptive configuration in HF systems maybe one direction in future HF communications. The elementary work in [11] firstly introduced prediction technology to infer the ionospheric propagation loss in HF communications. Then, [12] introduced neural network to predict the maximum usable frequency (MUF) in HF communications. However, these predictions mainly serve as the RT-CE, which are separated with HF communication system. After that, some cognitive radio based spectrum predictions have been proposed for providing unoccupied frequency for HF communications. Based on Hidden Markov Model (HMM), [13] performed activity prediction for HF cognitive communication. [14] developed a machine learning strategy to output optimal frequency for HF band. Nevertheless, spectrum predictions were not incorporated into the procedure of HF communications.
Although the topic of HF communications has been extensively studied, there are still some important issues needed to be addressed,especially in the context of the deteriorating of HF electromagnetic environment. First, it is important to find quality HF frequency in efficient manner, which ensures the QoS of HF links. Secondly, it is urgent to incorporate spectrum prediction into the procedure of HF communications and develop efficient way to find quality HF frequency.
III. THE DETERIORATION OF HF ELECTROMAGNETIC ENVIRONMENT
3.1 Measurements of HF electromagnetic environment data
In the following, the real-world spectrum data analysis is presented to show the deterioration of HF electromagnetic environment. The measurements of HF electromagnetic environment are performed at Hangzhou, Zhejiang province, China from 2011 to 2015. The measurements were performed in the early winter (end of November or early December) and lasted for over 24 hours each year. The equipment are ESMB Monitoring Receiver and HA230-V Antenna provided by R&S Company. The frequency range of ESMB Monitoring Receiver is from 9 kHz to 3 GHz and in accordance with ITU recommendations. HA230-V Antenna is omnidirectional. The resolution bandwidth is con figurated to be 1 kHz. Table.I has listed the detailed configurations of the measurements are listed in Table. I.
Several configurations need to be explained. First, the measurements lasts over 5 years to capture the evolution of HF electromagnetic environment. The conclusions draw by long-term spectrum monitoring under the same configurations and in the same place is convincible. Second, the measurements were performed in the same time each year to eliminate the impact of time, season and the sunspot cycle on the HF electromagnetic environment. Third, the measurements were performed in early winter as the ionospheric activity is relatively stable [15].
3.2 The processing of HF electromagnetic environment data
Considering the HF electromagnetic environment data are conducted in terms of field strength E(dBµ V/m), in order to eliminate the uncertainty of receiving-system losses and receiving antenna gain, it is necessary to convert the field strength E(dBµ V/m) to available power from receiving antenna Pa(dBm).The relationship between measured field strength and available power from receiving antenna depends on the receiving-system losses and the impedances of the antenna and receiver. Generally speaking, the receiving-system losses and the antenna impedance are frequency-depend factors. Let Vmrepresents the median receiver input voltage (dBµ V/m).Assuming Rayleigh fading, the available power from receiving antenna Pa(dBm) is given as [15]

equation (1) can be used to relate measured values of Vmto Pawhen the various system losses are known. If it is not possible to determine L and T, the alternatively Pamay be given in terms of field strength E(dBµ V/m)

where f is the frequency (MHz) and Gris the receiving antenna gain. The antenna factors of HA230-V are shown in Table. II and figure 1.According to equation (2), the measured field strength (dBμV/m) is converted to measured power (dBm). Figure 2 shows the 3D view of 24 hours real-world spectrum measurement of HF frequency band.
3.3 The analysis of HF electromagnetic environment data
In the HF frequency band, it is virtually impossible to find a frequency that is free of emissions for the whole 24 hours, because unforeseen occupancy could occur during the measurements. In order to determine the noiselevel in the HF frequency band, it is recommends to do a scan over a frequency range instead of measuring one frequency alone [16].The noise levels are determined in every 1 MHz. We determine the noise of HF frequency band through the “20% method” recom-mended in [16]. Unwanted occupancies can be eliminated from the result by using only the samples with the lowest 20% level and discard the other 80%.

Table I. Con figurations of HF electromagnetic environment measurements.
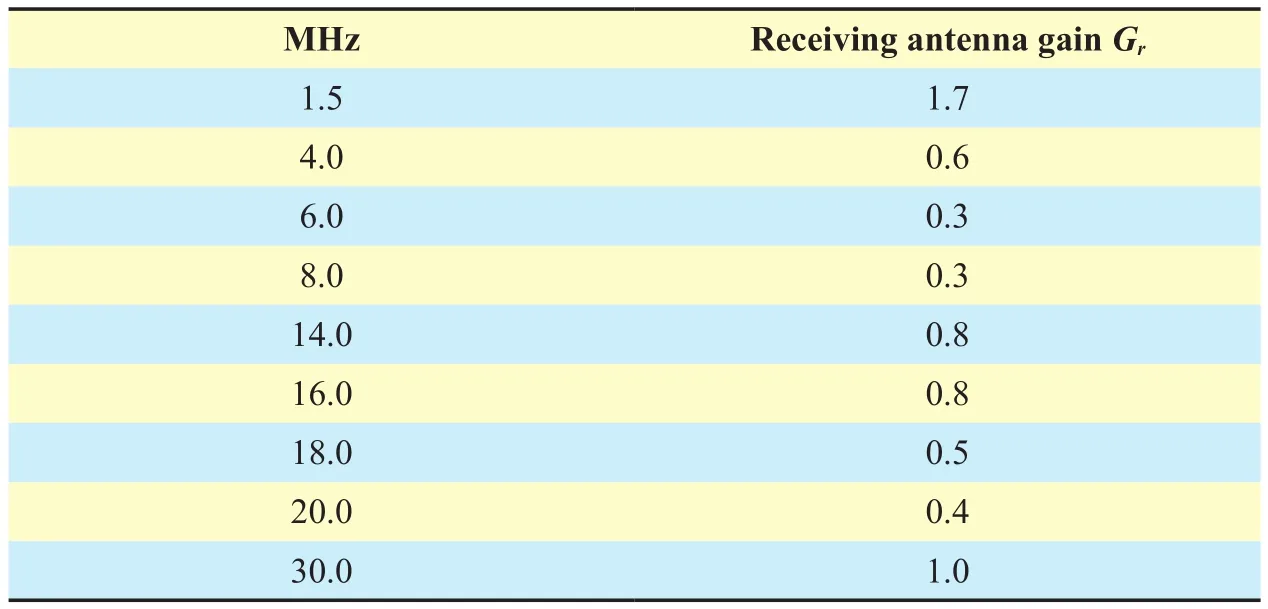
Table II. Antenna factor of HA230-V.
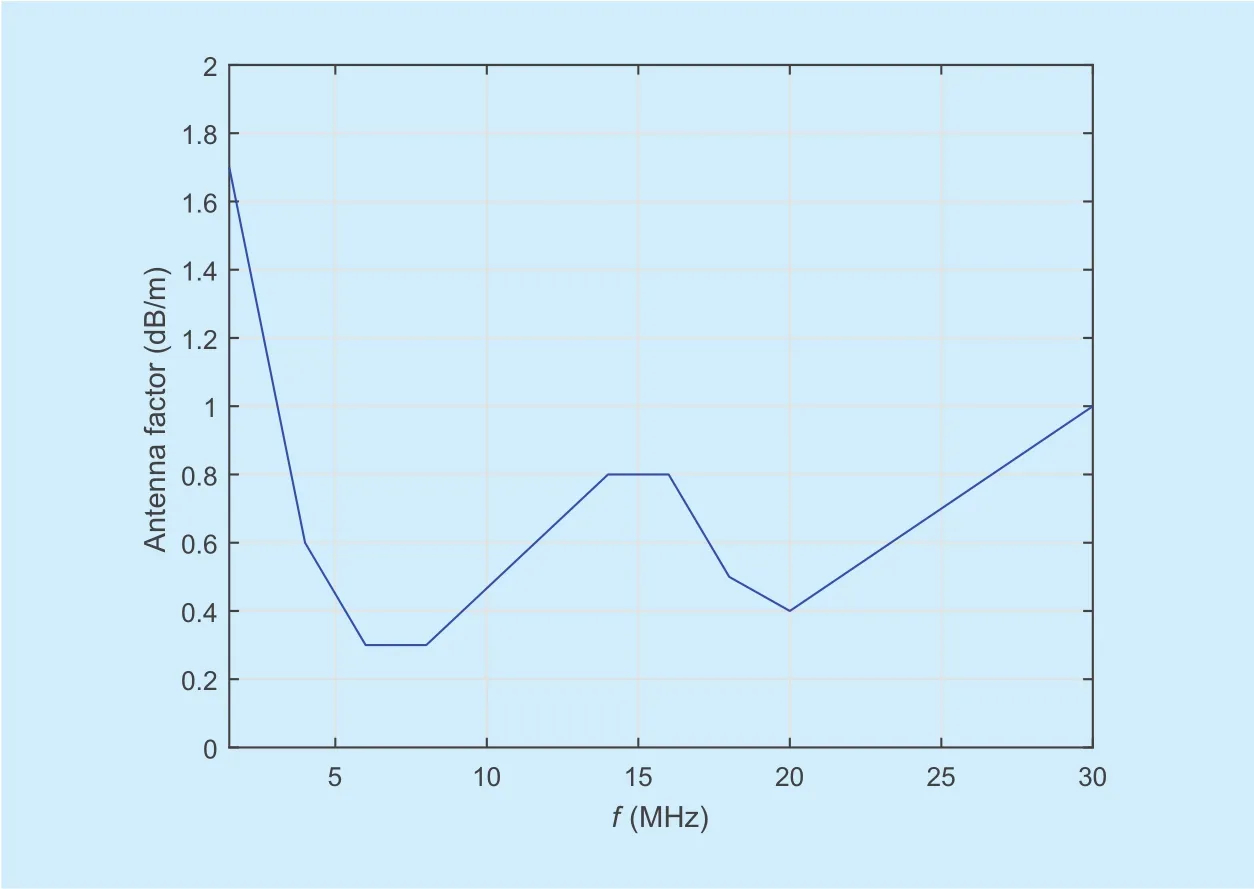
Fig. 1. Antenna factors of HA230-V.

Fig. 2. The 3D view of 24 hours real-world spectrum measurement of HF frequency band.
The available power from receiving antenna of HF frequency band from 2011 to 2015 are shown in figure 3, with different color lines indicating the measured power of each year. Obviously, we can observe that the magnitude of transmit power are increasing year by year. It is also observed that the number of HF emissions is increasing year by year. Given the number of HF channels, the increasing of HF emissions will inevitably lead to the decrease of quality HF frequency, and further lead to the deterioration of HF electromagnetic environment.
The HF background noise levels from 2011 to 2015 are shown in figure 4. As we can see,although the background noise levels arefluctuating, the comparison of background noise levels over 5 years indicate the HF background noise levels are increasing, and increase rate is about 1 dB per year. From the figure 3 and figure 4, we can draw the conclusions that the HF electromagnetic environment is deteriorating now.

Fig. 3. The available power from receiving antenna of HF frequency band from 2011 to 2015.

Fig. 4. The background noise levels of HF frequency band from 2011 to 2015.
IV. THE CORRELATIONS AND PREDICTABILITY OF HF SPECTRUM DATA
Spectrum prediction is presented for a pre-selection of HF frequency band before spectrum sensing, which infers the future HF spectrum status by exploring the inherent correlations and regularities of HF spectrum data. In this Section, we investigate the correlations and predictability of HF spectrum data, which serve as the foundations of HF spectrum prediction.
4.1 The correlations of HF spectrum data
The correlation coefficient are applied to analyze the correlations of HF spectrum data in spectral and temporal, which serve as the basis of HF spectrum prediction. The correlation coefficient between two vectors is known as

where cov(·) and E(·) denote covariance operator and expectation operator, respectively.α and β denote the vectors, and the means of which are μαand μβ, and their standard deviation are σαand σβ, respectively. The value of ρα,βranges from -1 to 1. Generally, the value of the coefficient is closer to 1, imply the correlation is high. For a HF spectrum data matrix, let its two columns x·,i,i ∈ {1,… ,T }and x·,j, j∈ {1,… ,T} respectively corresponds to the random variables α and β in equation(3). The correlations in time domain are shown in figure 5(a). We can observe that the values of correlations in time domain are very close to 1, which indicating the HF spectrum data are highly correlated in time domain.
The correlations in frequency domain are derived similarly. For a HF spectrum data matrix, let its two columns xi,·,i ∈ {1,… ,F} and xj,·, j∈ {1,… ,F} respectively corresponds to the random variables α and β in equation(3). The correlations in frequency domain are shown in figure 5(b). It is observed that the correlations in frequency domain are obviously, while majority of the correlations in frequency domain are not as significant as those in time domain, the correlations in frequency domain widely exist.
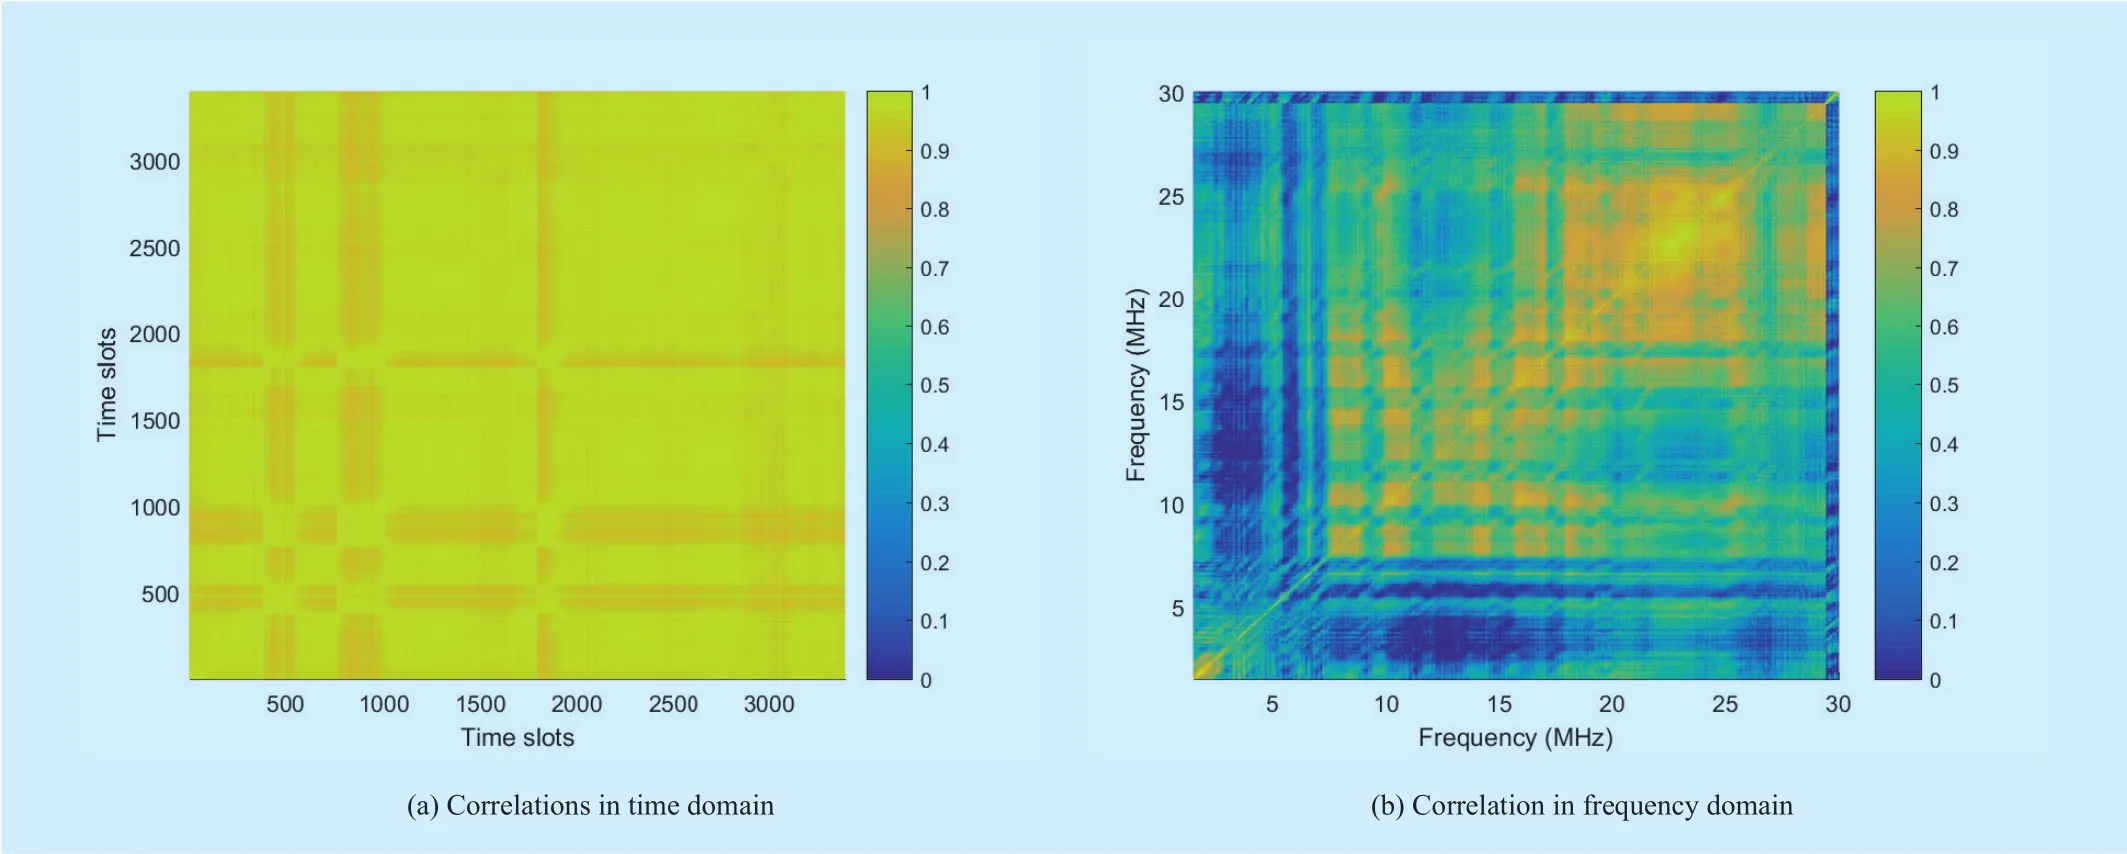
Fig. 5. Correlations of HF spectrum data.
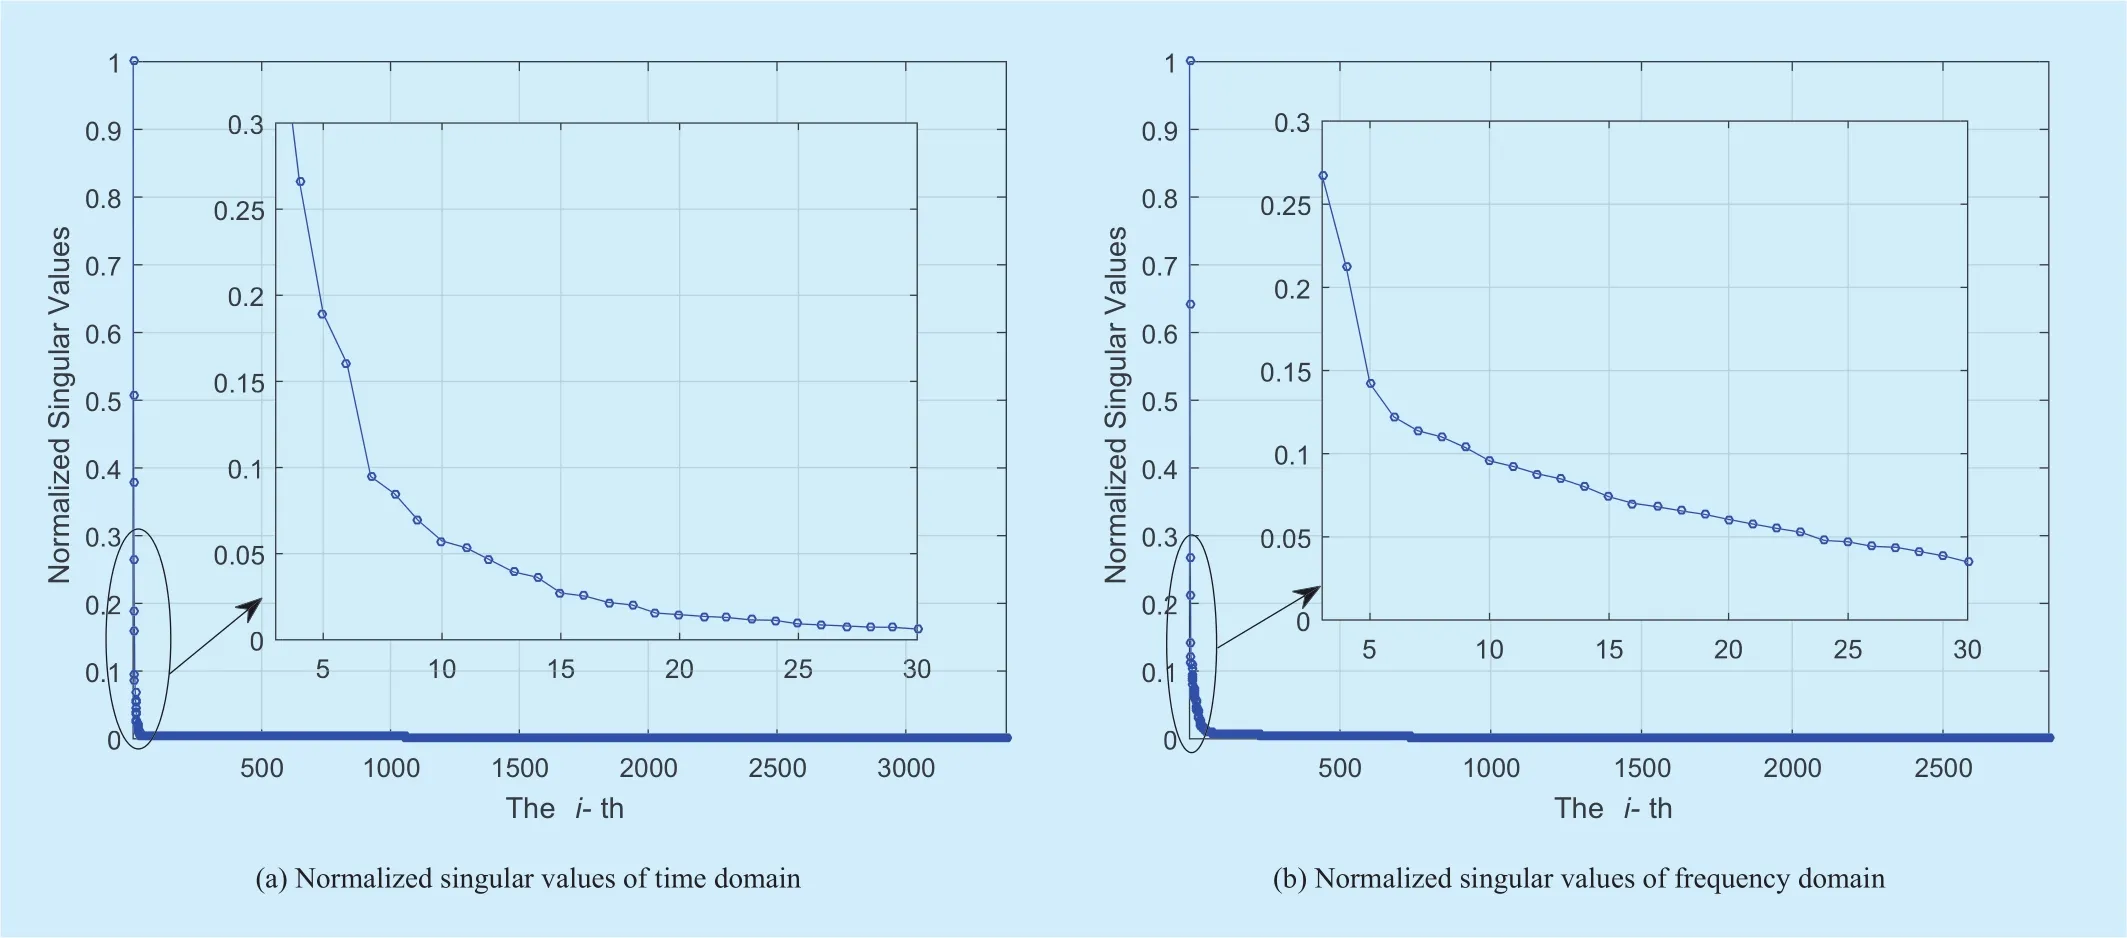
Fig. 6. Normalized singular value distribution of HF spectrum data.
The correlations in time and frequency domain sever as foundation in HF spectrum prediction. Furthermore, according to linear algebra, high correlation of a matrix generally indicates that it is of low-rank. The rank of HF spectrum data matrix is examined as follow to show the low-rank characteristics. The HF spectrum data matrix is first subtracted by its mean value for each row (col). Then the singular value decomposition is performed to show the rank distribution in figure 6. We can observe the low-rank characteristic is very obviously from the normalized singular values of both time domain and frequency domain.Notably, the 7th normalized singular value of time domain is below 0.05, and the 25th normalized singular value of frequency domain is below 0.05, which implies that the correlations of time domain are stronger than that of frequency domain. From the figure 5 and figure 6, we can observe that the correlations are widely exist in HF frequency band, which provide the basis of the following analysis of predictability of HF spectrum data.
4.2 The predictability of HF spectrum data
The correlations of HF spectrum data in time domain and frequency domain imply the future HF spectrum status is predictable. Then,to what degree is future HF spectrum status predictable?
Entropy is the popular tool to characterize the predictability of random variable sequence.Lower entropy implies higher predictability,and vice versa. To analyze the predictability of HF spectrum data, we first perform quantize the power values into Q levels. Let St={ X1,f,X2,f,… ,Xt,f,… ,XT,f} denote the series of sequence at T consecutive time slots,and Sf= { Xt,1,Xt,2,… ,Xt,f,… ,Xt,F} denote the series of sequence at F consecutive frequency band. Three entropies characterize the predictability of HF spectrum data [17].
a) Random entropy Erand=log2Qcapturing the degree of predictability of the given sequences of HF spectrum status, which imply that the power level occurs with equal probability in each time slot.
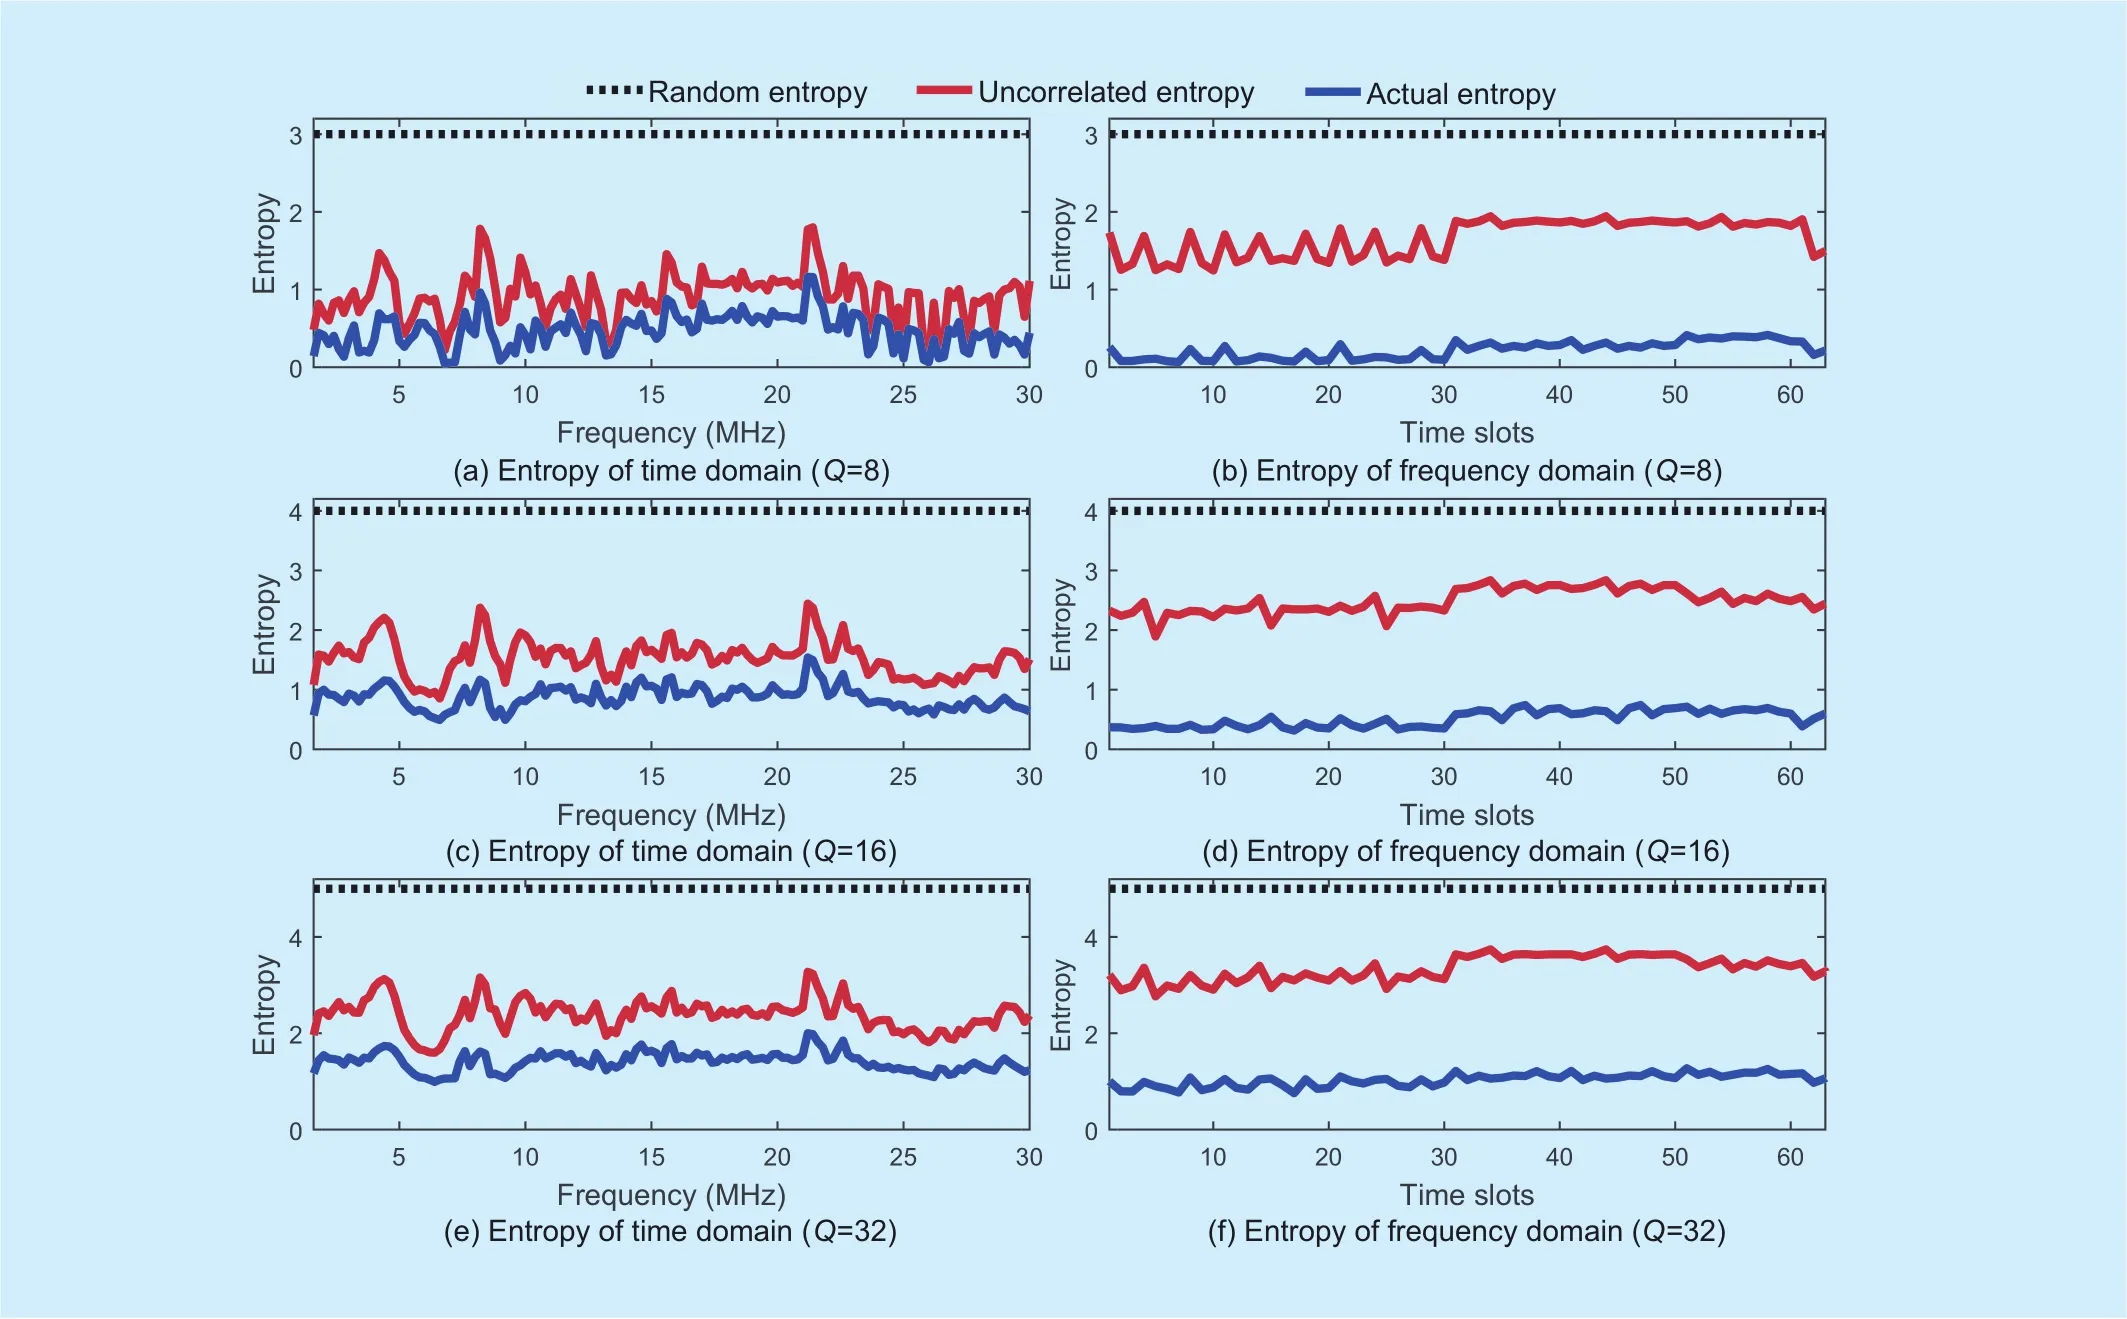
Fig. 7. Entropies of time domain and frequency domain.
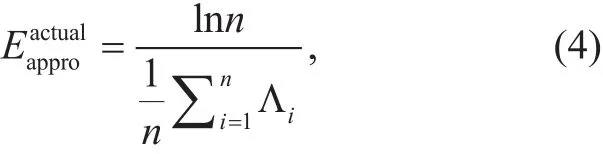
where Λiis the length of the shortest subsequence starting at the i-th time slot which does not appear [18]. Generally, we have 0≤ Eactual≤ Eunc≤Erand. Extremely, if Eactual=0 for a time/frequency sequence, the changes of power levels at this frequency/time is completely regular and without any randomness. On the other hand, if Eactual= Eunc=Erandfor a time/frequency sequence, the changes of power levels at this frequency/time is completely random and without any regularity. For this situation, there is no spectrum prediction algorithm with the prediction accuracy exceed 1/Q in statistical. We examine the three kinds of entropies of HF spectrum data, under time/frequency domain and three quantized interval(Q=8/16/32). The results are shown in figure 7. From the entropies of time domain and frequency domain, we can see all actual entropies between 0 and Erand, indicating the changes of each time/frequency have both randomness and regularity. The regularity is the basis for the spectrum prediction in the HF frequency band. Secondly, low entropy values indicate high regularity, which further implies high predictability. As we can see, the regularity of time domain is higher than that of frequency domain, indicating that the predictability of time domain is higher than that of frequency domain. Thirdly, from the comparisons of uncorrelated entropy and actual entropy under different quantization levels, it can be observed that both the value of uncorrelated entropy and actual entropy increase with the number of quantization, indicating the prediction difficulty increases with the number of quantization.
As is known to all, entropy is the index used to measure information uncertainty. The low entropy value indicates low uncertainty and high predictability, while the high entropy value indicates high uncertainty and low predictability. From above analysis of entropy,the predictability of HF spectrum data can be further obtained, i.e. the degree of accuracy that the future HF spectrum status predictable,also can be known as the degree that the spectrum prediction algorithms approximate the prediction accuracy.
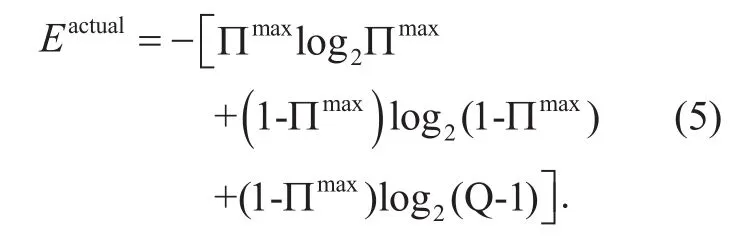
Theorem 1 With quantization Q and actual entropy Eactualof HF spectrum data, the predictability satis fies Π≤Πmax, the upper bound Πmaxcan be determined by equation (5) [18].
Based on the relationship in equation (5),for each HF frequency band, we can obtain the upper-bound predictability Πmaxthrough numerical calculations, which are shown in figure 8. The upper-bound predictability indicates no matter what spectrum prediction algorithm is applied, the prediction accuracy can’t exceed Πmax. From the comparisons of different quantization levels, we can see more quantization levels indicate lower predictability. As the number of quantization levels increase, the options and uncertainty for spectrum prediction also increase. From the comparisons of the predictability of time domain and frequency domain, we can see the fluctuation of predictability in frequency domain is relatively mild while that in time domain is relatively drastic,indicate the predictability of time domain is more dependent on the frequency utilization.
From the calculation of upper-bound predictability, we can draw the conclusion that the HF spectrum evolution is predicable. On the other hand, HF frequency bands have different upper-bound predictability, the prediction accuracy cannot exceed the upper bound no matter what prediction algorithm is applied. The upper-bound predictability of HF spectrum evolution provides guidelines for designing the spectrum prediction algorithms, and serves as the index for evaluating the performance of spectrum prediction algorithms.
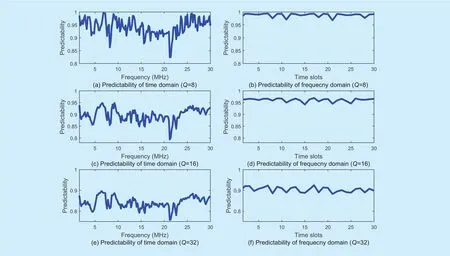
Fig. 8. Upper-bound predictability max of time and frequency domain.
V. SPECTRUM PREDICTION BASED HF FREQUENCY PRE-SELECTION
The deterioration of HF electromagnetic environment triggers urgent need for finding quality frequency in HF communications. In current advanced HF communication systems,spectrum sensing is applied for detecting the occupancy within each channel before LQA[2]. In order to improve the efficiency of spectrum sensing, spectrum prediction is presented for a pre-selection of HF frequency band before spectrum sensing, which infers the future HF spectrum status by exploring the inherent correlations and regularities of HF spectrum data. In this Section, we present the Spectrum Prediction based HF Frequency Band Pre-selection (SP-FBP). In our perspective, spectrum prediction improves the efficiency of HF spectrum sensing in two specific ways:
• Prediction of HF spectrum occupancy,which outputs the ranking of spectrum occupancy for frequency band. Based on this output, the frequency bands with higher probability of being idle are selected for spectrum sensing.
• Prediction of HF usable frequency, which outputs the HF usable frequency in the HF frequency subband. Based on this output, the HF usable frequencies are selected for spectrum sensing.
Spectrum sensing determines the spectrum status using various signal detection methods,which serves in a passive manner, and with some hysteresis. The detection of other signals in the occupied channels generally means the frequency collisions occur, and then the interference is inevitable. Different from spectrum sensing, spectrum prediction infers the unknown spectrum status from history spectrum data by exploring the correlations of spectrum data, which serves as a proactive manner.
?
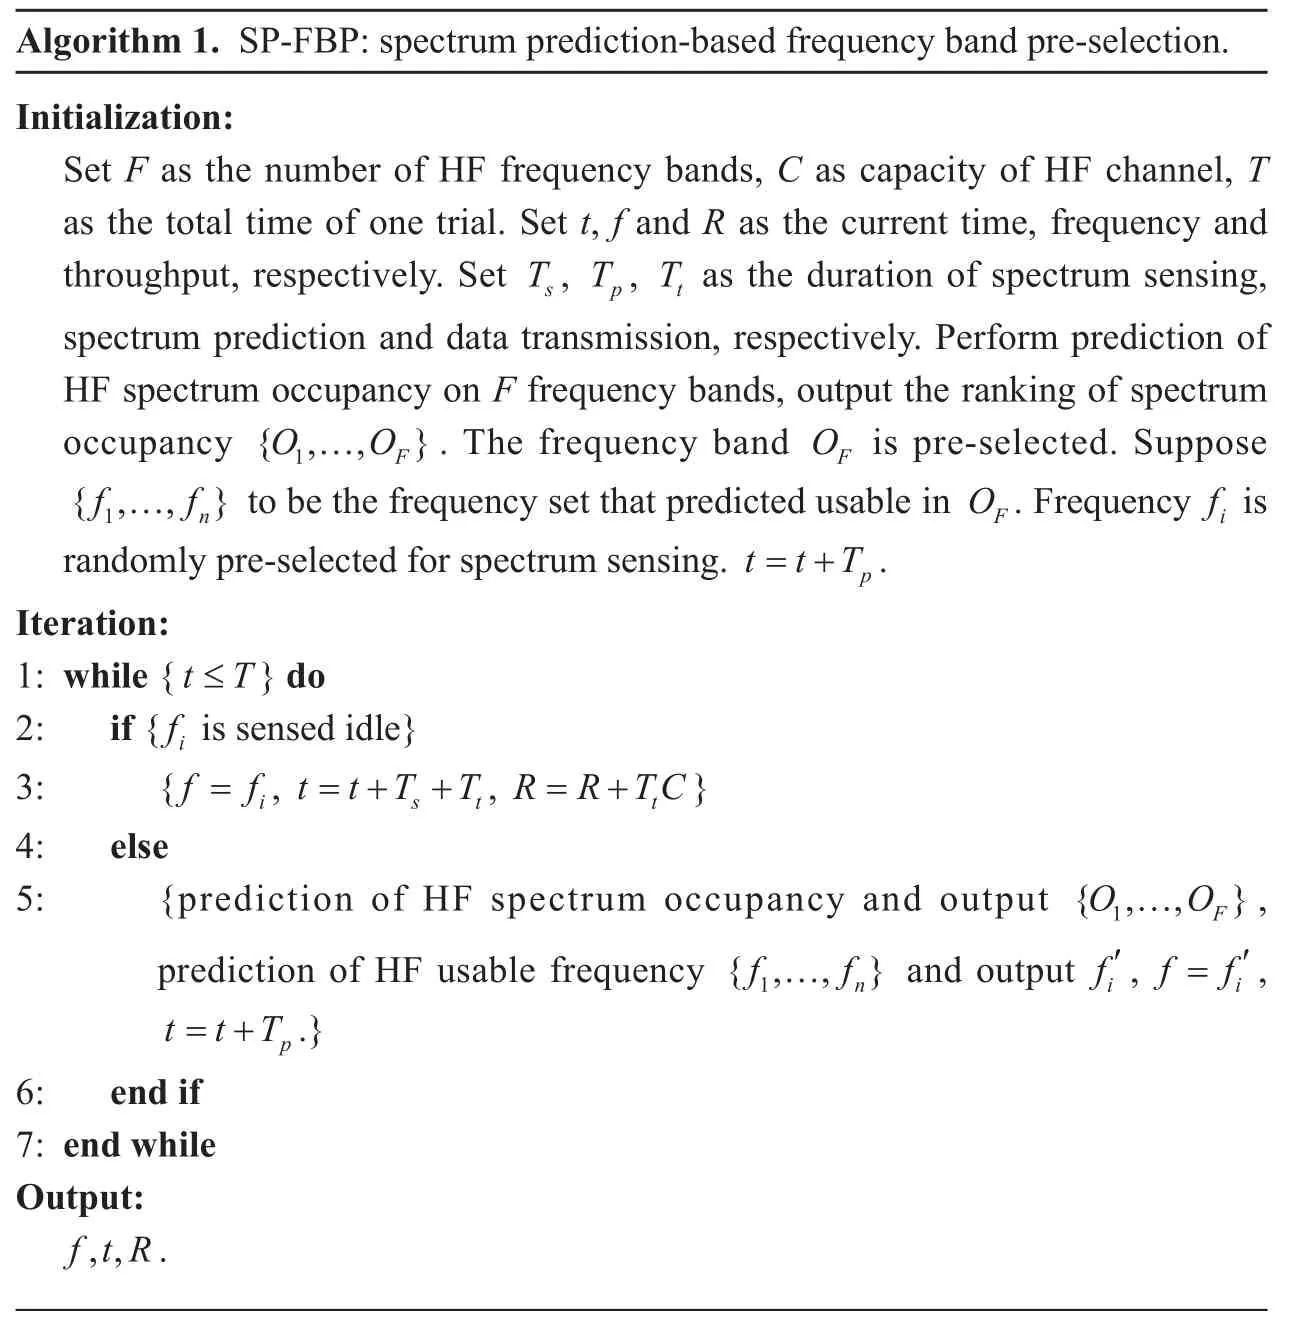
The process of this scheme can be described as follows. First, system performs prediction of HF spectrum occupancy based on history HF spectrum data, and output the ranking of spectrum occupancy for frequency band. Second, the frequency band with lowest occupancy is selected, and system randomly picks a frequency up from the frequencies that predicted usable. Then, spectrum sensing is performed on the picked frequency, the LQA is performed and the transmission starts if the frequency is sensed idle, otherwise above process will be executed again when the frequency is sensed occupied. For the next time slot, the spectrum sensing will be directly performed on the same frequency, the system will not perform previous spectrum prediction until the frequency is sensed occupied. The detailed procedure of SP-FBP is summarized in Algorithm 1. As an emerging technology, numerous prediction algorithms have been proposed in recent years [19, 20]. Neural network has been proposed as a popular spectrum prediction approach for its high prediction accuracy and capability of learning [21, 22]. In the following,the neural network based spectrum prediction is performed as the prediction algorithm for SP-FBP.
5.1 Prediction of HF spectrum occupancy
For the consideration of simplicity and calculation speed, the prediction of HF spectrum prediction is performed on the frequency band of 20-30 MHz. In the following experiments,the first 1000 time slots are used for training the neural network, and HF spectrum prediction begins at 1011th time slots. Figure 9 shows the comparisons of HF original data and the HF prediction output, in the unquantizated and quantizated manner (Q=8/16/32).First, the comparisons of unquantizated and quantizated prediction output show that the unquantizated spectrum output achieves the best capture of HF spectrum evolution. Second, the comparisons of different quantizated levels show that the more quantizated levels,the harder it is to accurate capture the HF spectrum evolution. From the sketch-map of 20-30 MHz, we perform frequency band ranking of HF spectrum occupancy, the occupancy of HF frequency band is calculated according to thresholds, which is derived by the predefined background noise in figure 4 plus 5 dB. The occupancy of HF frequency band is counted at intervals of 1 MHz for the following experiments. Based on the prediction of HF spectrum occupancy, the frequency bands with higher probability of idle will be selected as the candidate bands for spectrum sensing.
5.2 Prediction of HF usable frequency
Fig. 9. HF spectrum prediction for frequency band 20-30 MHz.
From the frequency band of 20-30 MHz, a typical frequency f=28.6 MHz is selected to illustrate the prediction of HF usable frequency, which is shown in figure 10. As we can see, the unquantizated prediction captures all details of the spectrum evolution. While the quantizated prediction (Q=8) only capture a main hopping in time domain. As the increasing of quantization levels, spectrum prediction captures detailed evolutions of time domain.For the quantizated prediction of Q=32, it nearly captures all detailed evolution. Then,if the frequency f=28.6 MHz is predicted usable according to a predefined thresholds,it may be selected for spectrum sensing and later LQA. Based on prediction of HF usable frequency, the HF usable frequency will be selected for spectrum sensing.
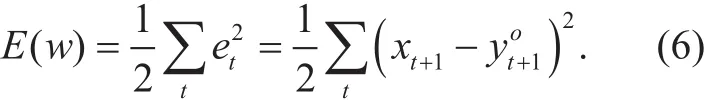
For the typical frequency f=28.6 MHz,in order to evaluate the performance of neural network based spectrum prediction, the prediction error measured by the mean square error (MSE) is presented under different quantization levels. MSE denotes as E( w), which can be compute as
The MSE performance under different quantization levels are shown in figure 11. Obviously, the MSE of unquantizated HF spectrum prediction is the lowest. The MSE of the quantizated HF spectrum prediction are almost the same and acceptable. Therefore, above analysis and discussion show the HF spectrum evolution is not only predictable, but also with high predictability. Based on history HF spectrum data, the prediction of spectrum occupancy and the prediction of usable frequency are workable.
5.3 Throughput performance evaluation for SP-FBP
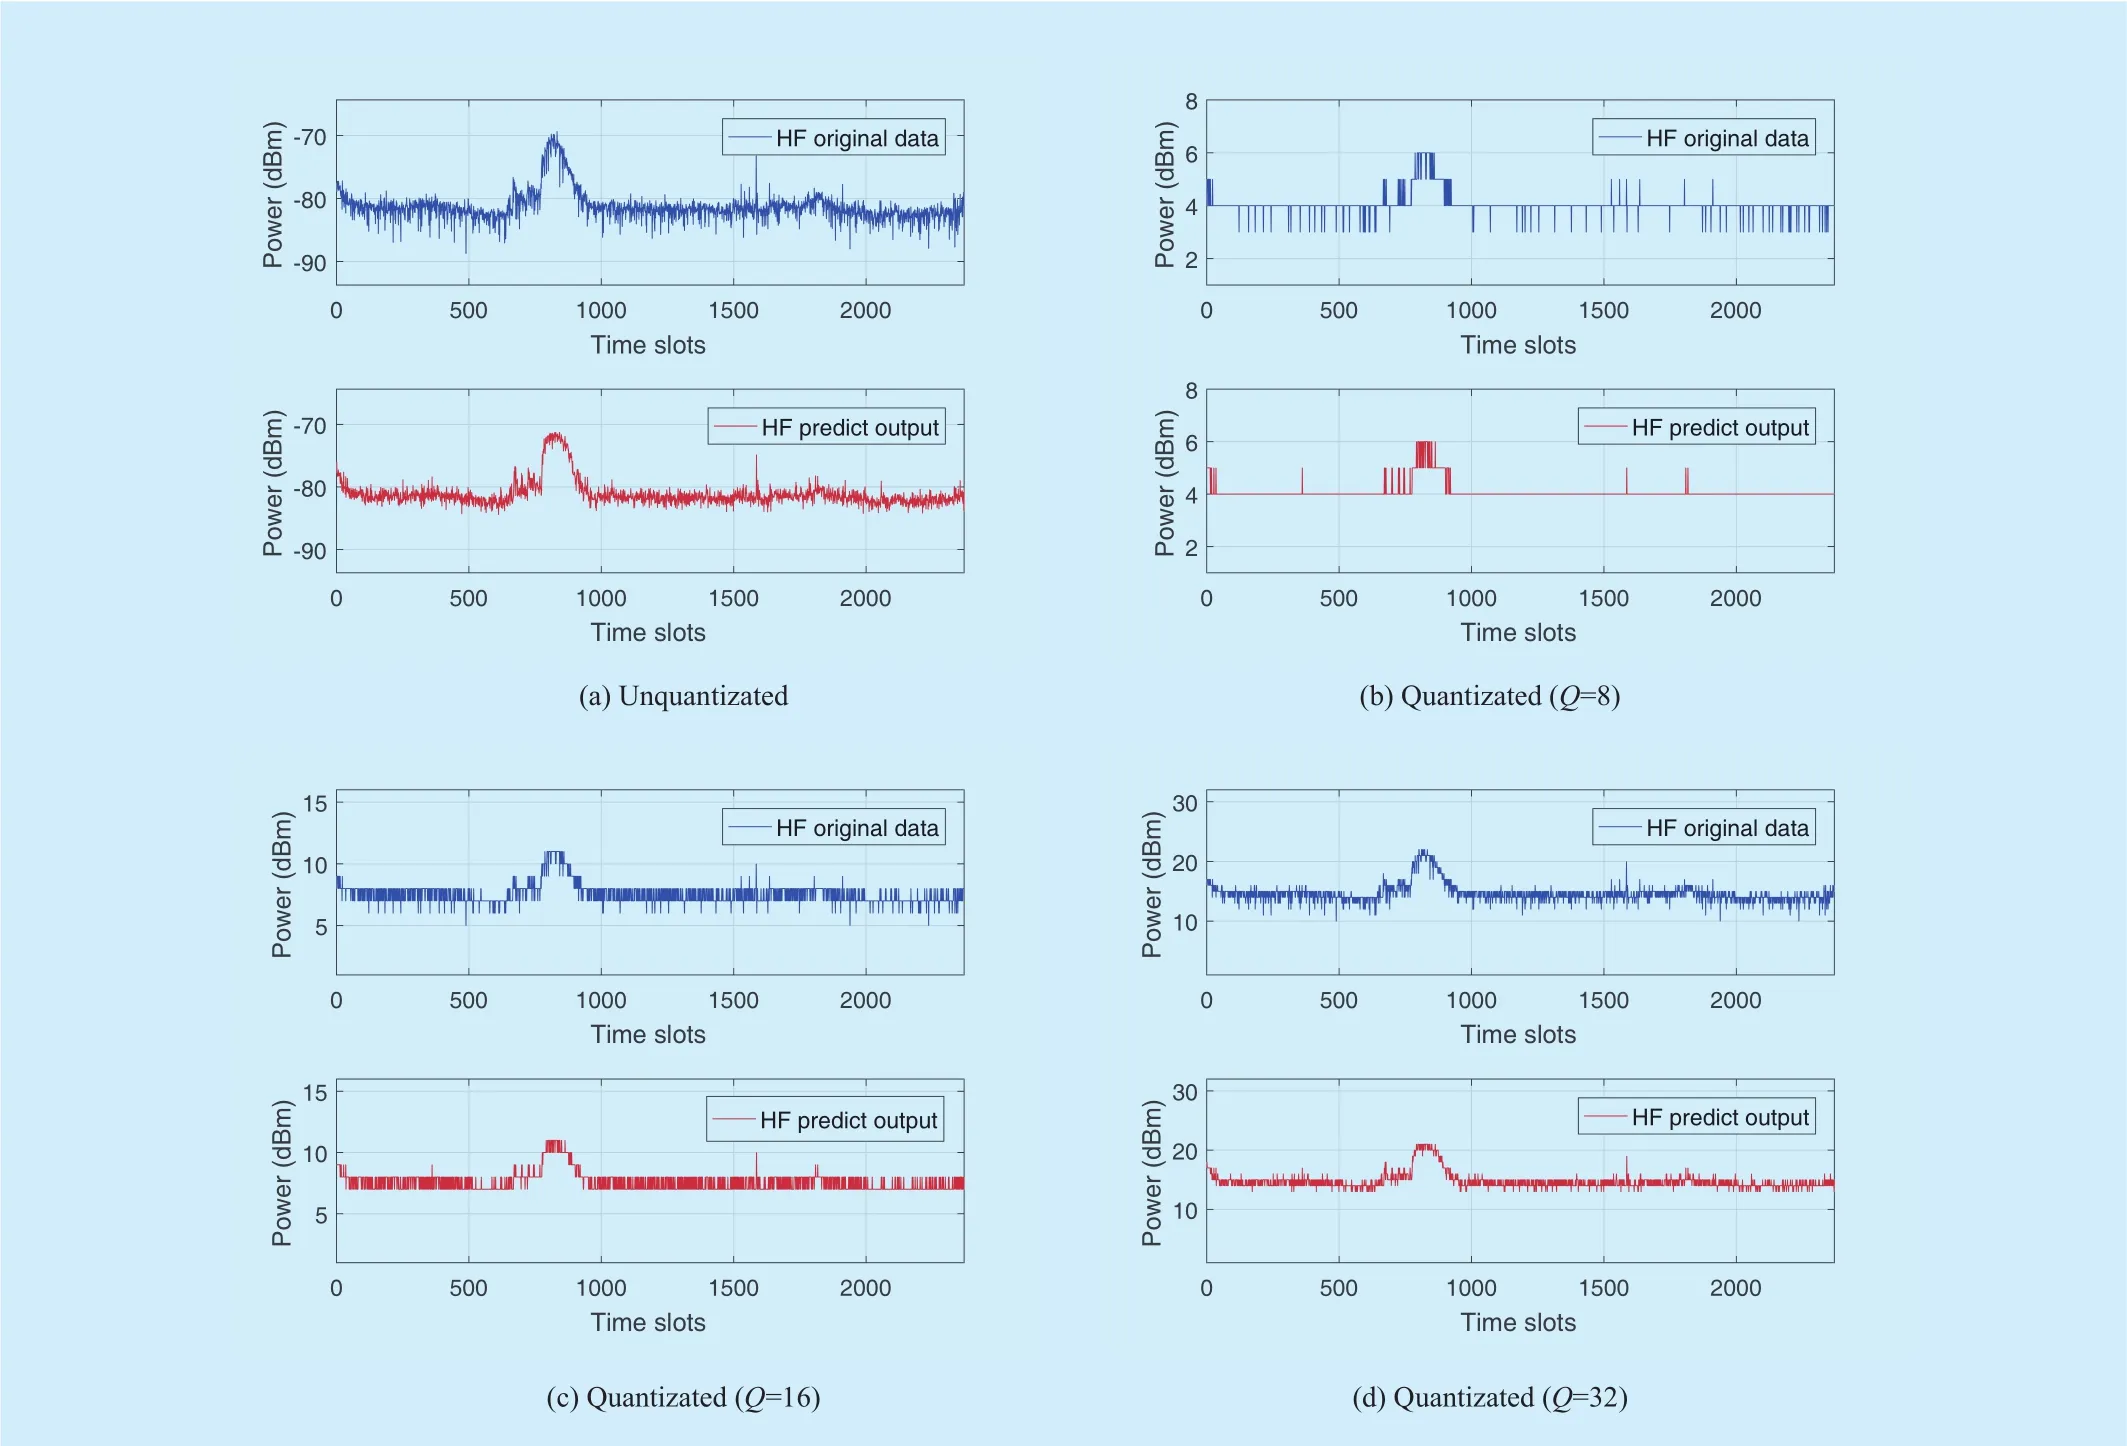
Fig. 10. Spectrum prediction for frequency F = 28.6 MHz.
Parameter setup: The real-world spectrum data are applied as the original spectrum matrices. The duration of periodical time slot is set to 2 seconds, with the proportion of spectrum prediction and spectrum sensing are same as [22], [23]. The SNR for HF transmission is assumed to be 20 dB, thus capacity C=log2(1+SNR)=6.6582. The throughput is calculated as the summation of transmission duration multiply capacity.
Baseline scheme: For the comparison purpose, several candidate spectrum sensing based schemes are selected for baseline, such as Random Spectrum Sensing (R-SS) and Sequential Spectrum Sensing (S-SS). For R-SS,system randomly select a frequency to sense,the LQA is performed and the transmission starts if the frequency sensed idle, otherwise another frequency is randomly selected when the frequency is sensed occupied. In the next time slot, the spectrum sensing will be directly performed on the same frequency, the system will not switch frequency until the frequency is sensed occupied. For S-SS, the spectrum sensing will be sequential performed on the adjacent frequency until the sensing result is idle, the other procedures are same as R-SS.To eliminate the performance difference caused by randomly frequency selection, 2000 Monte Carlo trials are performed.
Performance comparison: The throughput performance of SP-FBP (Q=8/16/32 and unquantizated), R-SS and S-SS are shown in figure 12, when upper levels are applied as the thresholds. The upper levels are the upper rounding Q values corresponding to the soft value threshold of each frequency band. First,the comparison show SP-FBP obtains the best throughput performance among SP-FBP,S-SS, R-SS, indicates the spectrum prediction based pre-selection of HF frequency band significantly improves the efficiency of spectrum sensing. Note that the throughput performance is highly depend on the HF spectrum occupancy. Under low HF spectrum occupancy,the throughput of S-SS and R-SS may even exceed the throughput of SP-FBP. The essence of SP-FBP lies in the pre-selection of HF frequency band, which enables HF users avoiding the HF frequency band with high occupancy.

Fig. 11. HF spectrum prediction for frequency band 20-30 MHz.
Specially, the deviation intervals of indicate the throughput of SP-FBP are more stable than that of S-SS and R-SS, the initial selections have an obvious influence on the stability of throughput, which further indicates the pre-selection of frequency band indeed eliminate the blindness of HF spectrum sensing. Third, the comparison among SP-FBP (Q=8/16/32) show less quantizated levels achieve higher throughput performance, which is at the expense of reducing the protection to active users, i.e. reducing the quantizated levels will leads to the reduction of detection probability.
In this Section, we develop SP-FBP to find a quality HF frequency band, the comparisons with popular spectrum sensing schemes show the throughput performance of developed scheme is greatly enhanced, which indicates the efficiency of HF spectrum sensing is significantly improved.
VI. CONCLUSION AND FUTURE WORK
We developed a spectrum prediction-based frequency band pre-selection over deteriorating HF electromagnetic environment in this paper. Performance evaluation through real-world HF spectrum data has shown that SPFBP can improve the efficiency of spectrum sensing, to efficiently find quality HF frequency. As one part of future work, we plan to develop the complete spectrum prediction-based frequency band pre-selection for 3G-ALE system. Furthermore, one interesting but critical research direction is to avoid frequency conflicts between HF users without interaction.The applications of game theory in dynamic spectrum access provide a good example [24,25, the distributed learning may be a promising method to solve this problem.
ACKNOWLEDGMENT
This work has been performed in the Project of National Natural Science Foundation of China (Grant No. 61471395, No. 61301161,and No. 61501510), and partly supported by Natural Science Foundation of Jiangsu Province (Grant No. BK20161125 and No.BK20150717). We also gratefully acknowledge the HF data provided by research group of ITU-Questions 258/5 [1].
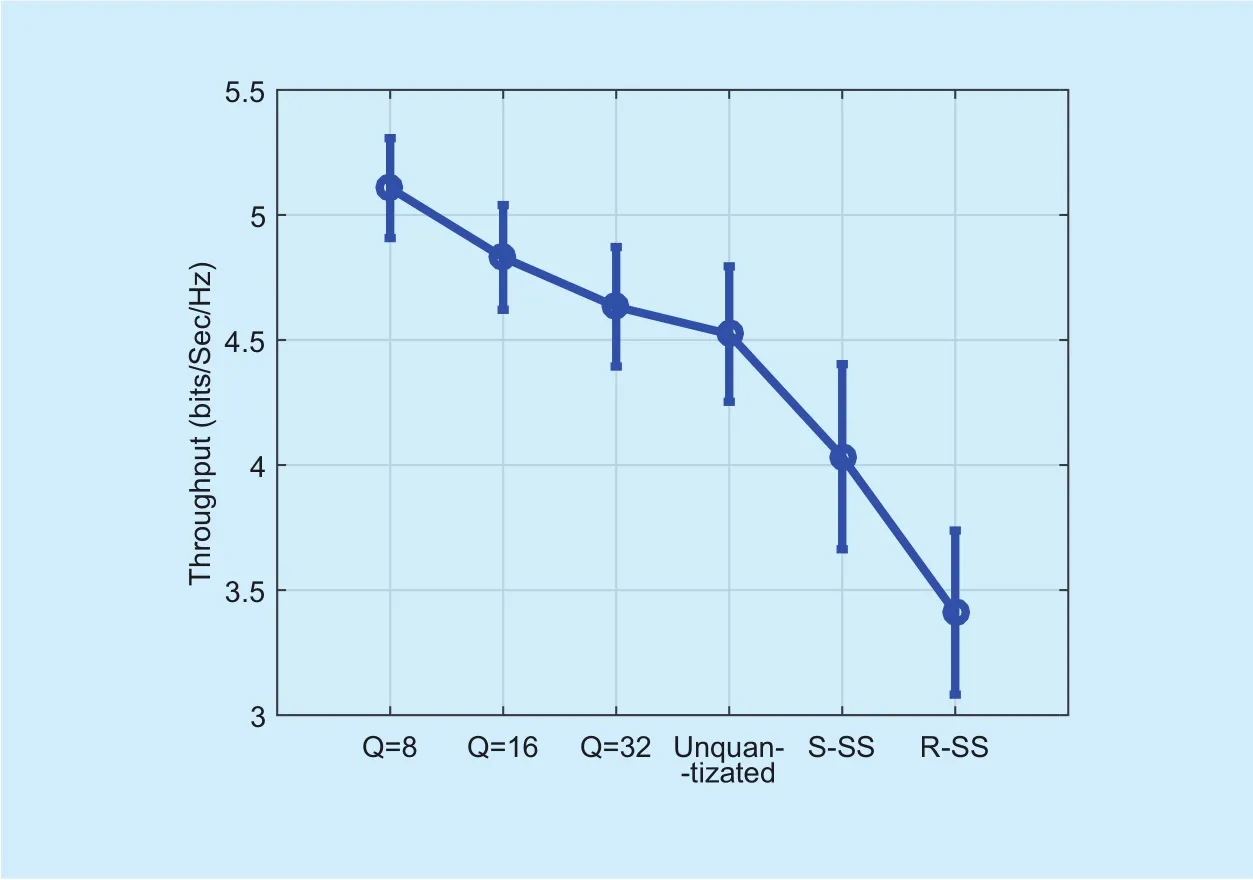
Fig. 12. HF spectrum prediction for frequency band 20-30 MHz.
杂志排行
China Communications的其它文章
- DNN-Based Speech Enhancement Using Soft Audible Noise Masking for Wind Noise Reduction
- Delay-Based Cross-Layer QoS Scheme for Video Streaming in Wireless Ad Hoc Networks
- An MAC Layer Aware Pseudonym (MAP) Scheme for the Software De fined Internet of Vehicles
- Asymptotic Analysis for Low-Resolution Massive MIMO Systems with MMSE Receiver
- Golay Pair Aided Timing Synchronization Algorithm for Distributed MIMO-OFDM System
- Joint Non-Orthogonal Multiple Access (NOMA) &Walsh-Hadamard Transform: Enhancing the Receiver Performance