Development of cryptotanshinone-loaded pellets for angina chronotherapy:In vitro/in vivo prediction and evaluation✩
2018-09-05ZhenghuaLiShuangshuangZhangHongxiangYanJianpingLiu
Zhenghua Li,Shuangshuang Zhang,Hongxiang Yan,Jianping Liu
Department of Pharmaceutics,China Pharmaceutical University,No.24 Tongjiaxiang,Nanjing 210009,China
Keywords:Chronotherapy Deconvolution Angina pectoris Cryptotanshinone In vitro/in vivo performance Control release
ABSTRACT The clinical manifestations of variant angina is unevenly distributed during the 24h,thus the in vivo performance of drugs should be tailored according to the angina circadian rhythm.Cryptotanshinone(CTN)is one of the representative bioactive lipid-soluble components of Danshen which has been commonly used for cardiovascular diseases such as angina pectoris.The aim of this study was to develop a novel CTN sustained-released pellets(CTN-SRPs)to precisely synchronize the CTN plasma concentrations with predicted occurrence of angina pectoris for angina chronotherapy.A deconvolution-based method was applied to develop and optimize the CTN-SRPs.The plasma concentration-time curve of CTN immediate-released formulation after oral administration in rats was used as the weight function.The predicted plasma concentration-time curve of CTN-SRPs simulated according to the incidence of variant angina during 24h was used as the response function.Then the desired drug release profile of CTN-SRPs was calculated based on deconvolution using weight function and response function,and subsequently used for guiding the formulation optimization.CTN-SRPs were prepared with the combinations of PVP,poloxamer 127 and EC as matrix using fluidized bed technology.An orthogonal design was employed to obtain the optimal formulation with its release profile similar with the desired one.Pharmacokinetic studies validated that the actual plasma concentration-time curve of these optimized CTN-SRPs was similar with the predicted one.In addition,the percent errors(%PE)of CTN plasma concentrations in 8–12h were less than 10%.In conclusion,this deconvolution-based method could be applied to adjust the in vivo performance of drugs for angina chronotherapy.
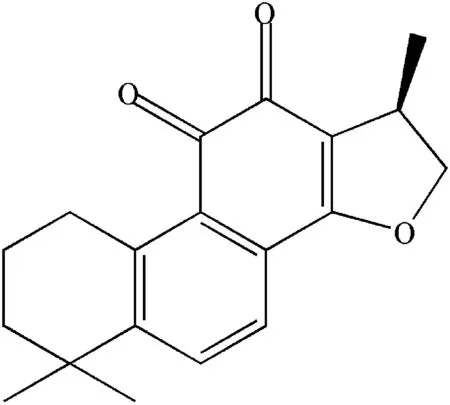
Fig.1–Chemical structure of CTN.
1. Introduction
The cardiovascular system is highly organised in time and pathophysiological events within the cardiovascular system are also not random,as shown for instance by symptoms of variant angina[1].Researches have demonstrated that the occurrence of the clinical manifestations of variant angina is unevenly distributed during the 24h with greater than expected events between 02:00 and 06:00 of the early morning[2,3].Thus,requirement for preventive and therapeutic interventions varies during the 24h and therapeutic strategies should also be tailored according to the angina circadian rhythm[4,5].In other words,a precise synchronization of drug plasma concentrations with predicted occurrence of angina pectoris should be ensured by drug delivery technology.
Convolution and deconvolution are standard mathematical tools widely used for the analysis of in vivo/in vitro correlation of dosage forms[6–9].In the present study,an attempt was made to design and optimize chronotherapeutic drug delivery system based on deconvolution method.It was used from a new perspective to synchronize the drug plasma concentration with the circadian rhythm of angina pectoris during 24h.The plasma concentration-time curve of immediatereleased formulation after oral administration was used as the weight function.The predicted plasma concentration-time curve which was simulated according to the incidence of variant angina during 24h was used as the response function.Then,the desired drug release profile was obtained by calculation based on deconvolution,and subsequently used for guiding the formulation optimization.
Danshen(Salvia miltiorrhiza),a traditional herb medicine with low toxicity and few side effects,have been commonly used for treating cardiovascular diseases[10–12].Its active compounds tanshinones and phenolic acids have bioactivities against myocardial infarction[13–15]and inflammation[16].Cryptotanshinone(Fig.1,CTN),one of the representative bioactive lipid-soluble components of Danshen,has been reported to possess a variety of cardiovascular activities[15–19].CTN has poor water-solubility,short half-life and low oral bioavailability(2%)which limits the desired drug ef-fect[20,21].However,little conventional and previously developed pharmaceutical preparations of CTN such as inclusion complexes[22],solid lipid nanoparticles[23]have taken the chronobiological phenomenon of variant angina into consideration.Obviously,these preparations of CTN could not suit for chronotherapy for this cardiovascular disease.Therefore,the development of novel CTN sustained-release formulation is necessary to achieve highest blood concentrations for maximal protection when angina pectoris is of greatest risk and occurrence.In this study,a deconvolution-based method was used to develop the CTN-SRPs.Three polymers,PVP,poloxamr 127(F127)and EC were used in combination to adjust CTN release from CTN-SRPs.An orthogonal design with three factors:the amount of PVP(X1),F127(X2)and EC(X3)was employed to obtain the optimal formulation with release profile similar with the desired one.Scanning electron microscopy(SEM)was performed to characterize the prepared CTN pellets.Finally,pharmacokinetics in rats was investigated to verify whether the CTN-SRPs optimized based on deconvolution had a desirable plasma drug concentration-time profile.
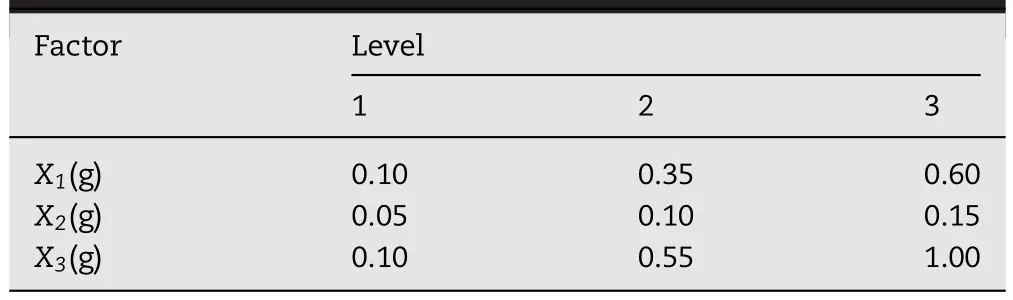
Table 1–Levels of the independent variables in coded and physical form.
2. Materials and methods
2.1. Materials
CTN(98.2%)was purchased from Nanjing Zelang Biotechnology Co.(Nanjing,china).CTN standard was purchased from the National Institute for the Control of Pharmaceutical and Biological Products(Beijing,China).PVP-K30 and Ethyl cellulose was kindly donated by China Division,ISP Chemicals Co.(Shanghai,China)and Colorcon.Poloxamer 127(PluronicF127)was obtained from BASF Aktiengesellschaft(Ludwigshafen, Germany).Sugar spheres(0.55–0.60mm)were from JRS Pharma(Germany).Gelatin capsules(size 5)were obtained from Suzhou Capsugel Ltd(Zhejiang,China).All reagents were of analytical grade except methanol and acetonitrile of chromatographic grade.
2.2. Preparation of CTN pellets
CTN immediate-released and sustained-released pellets with different formulation composition were prepared,respectively.Firstly,CTN,PVP and F127 at ratio of 1:4:1.5(w/w)were dissolved in a mixed solvent of 95%anhydrous ethanol/ethyl acetate(2:3,v/v)to form a clear solution to prepare CTN immediate-released pellets.PVP,EC,F127 and CTN at different ratios shown in Table 1 were dissolved in a mixed solvent of 95%anhydrous ethanol/ethyl acetate(2:5,v/v)to form a clear solution to prepare CTN-SRPs.
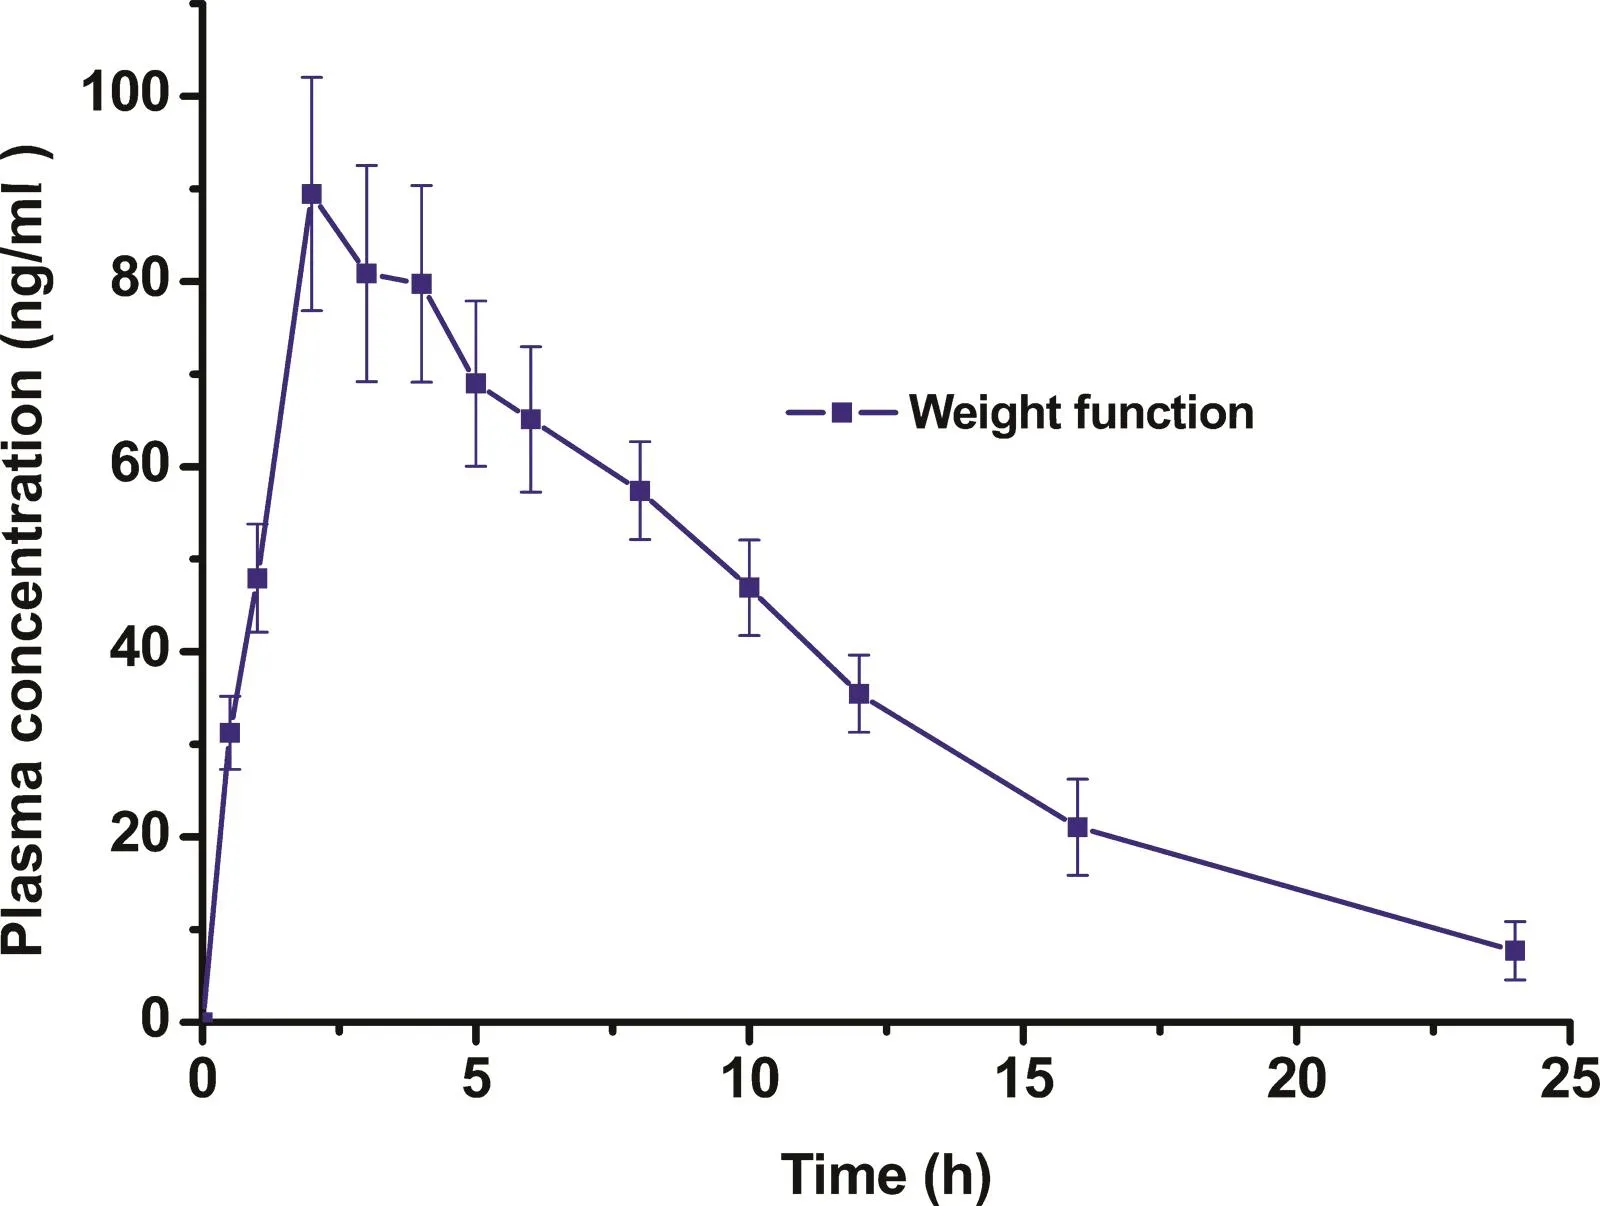
Fig.2–The plasma concentration-time curve of CTN in rats after oral administration of CTN immediate-released pellets(n=6).
Deposition of CTN solution on sugar pellets was performed in a fluid-bed granulator and coater(JHQ-100,Shenyang,China).The mixture solution was bottom-sprayed through a nozzle onto sugar pellets.The operation conditions were as follows:inlet air temperature,30–40°C;air flow rate,80–100 m3/min;spray rate,0.2–0.5ml/min;atomizing air pressure,0.2–0.5MPa;spray nozzle diameter,0.5mm.Finally,the pellets were dried for a further 60min at30–40°C in the coating chamber.
2.3. Design of CTN-SRPs based on deconvolution
2.3.1. Calculation of the desired drug release profile of CTNSRPs
In this study,deconvolution method was used to predict the desired drug release profile of CTN-SRPs.The convolution deconvolution equation was as follows:
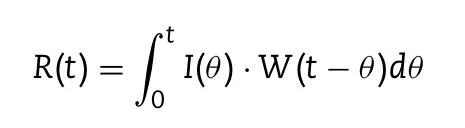
Where R(t)is the body response to any product with delayed input,W(θ)represents the borderline response after a bolus input,e.g.plasma concentration after an i.v.or an oral solution,the input function I(θ)represents drug release of a dosage form[9].The point-area methods which interpret the values of I(θ)and W(θ)as trapezoidal areas was used and the deconvolution was calculated by Microsoft Excel[9,24].
The plasma concentration-time curve of CTN in rats after oral administration of CTN immediate-released pellets(shown in Fig.2)was used as a weight function.The expected plasma concentration-time curve of CTN-SRPs which was simulated and fitted according to the statistical relative percentage of variant angina attacks during 24h[2,3](starting from 18:00,shown in Fig.3)was used as a response function.Then,the desired drug release profile of CTN-SRPs as an input function was calculated via the point-area deconvolution procedure and subsequently used for guiding the formulation optimization of CTN-SRPs.
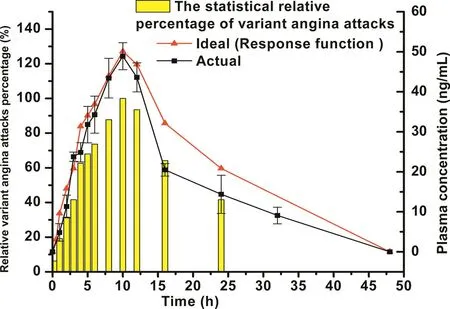
Fig.3–The statistical relative percentage of variant angina attacks during 24h(starting from 18:00);the expected plasma concentration-time curve of CTN which was simulated and fitted according to the statistical relative percentage of variant angina attacks;the actual plasma concentration-time curve of CTN in rats after oral administration of the optimal CTN-SRPs.
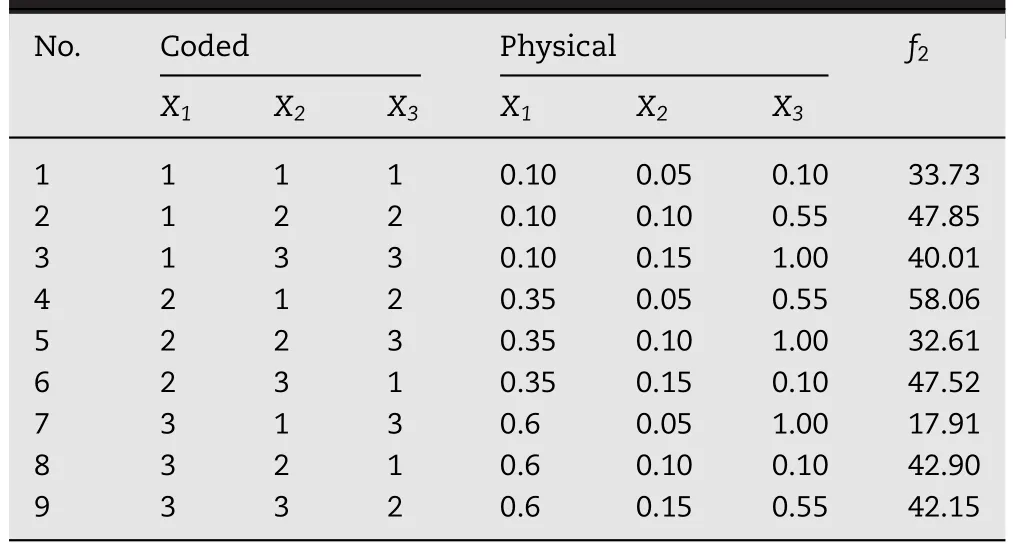
Table 2–The orthogonal design table and resultant f2values.
2.3.2. Orthogonal design
The ratios of polymers were adjusted to control CTN release.An orthogonal design with three factors:the amount of PVP(X1),F127(X2)and EC(X3)was employed to obtain the optimal formulation with its release profiles similar with the desired one.Preliminary studies provided the settings for the levels of each factor(shown in Table 2).The factor level combinations of each experimental run were given in Table 1.Then CTN-SRPs were prepared under parallel conditions according to different factor levels at each experimental run.In addition,their release behavior was investigated and compared with the ideal one by the similarity factor(f2).Then,f2was used as a response(Y).Data were analyzed by Orthogonality Experiment Assistant II software.The effects were evaluated statistically at 0.1 level(α=0.1).Each experiment was performed in triplicate.In addition,the optimal formulation predicted according to the results of orthogonal design was prepared and its release behavior was investigated.
2.4. In vitro release studies
2.4.1. Determination of CTN
CTN in release medium was quantified by ultraviolet spectroscopy.The detection wavelength was 263nm.The linearity of the method was studied in the concentration range of 2.4–8.4μg/ml(R2=0.9997).The RSD of the intraday and interday precision for CTN were less than 2%.The recovery rates for CTN were in the range of 98%–102%,and the RSD were below 2%.
2.4.2. In vitro release tests
The release studies were performed in ZRS-8G dissolution apparatus(rotating basket method)(Tianjin,China).Samples containing 5mg of CTN were sealed in hard gelatin capsules(CapsulCN,Zhejiang,China),then put into the rotating basket and immersed in the release medium(900ml of distilled water contained 0.2%sodium dodecyl sulfate)thermostatically maintained at 37±0.5°C at a rotation speed of 100rpm.At predetermined time intervals,10ml of the sample was withdrawn and an equal volume of fresh release medium was supplemented to keep constant volume.The samples were filtered through 0.45μm filter and analyzed by UV for CTN as described above.All the release tests were implemented in triplicate(n=3)and the cumulative dissolved percents and standard deviations were calculated.
2.4.3. Investigation of drug release stabilities
The drug release stability studies of CTN-SRPs were performed in ZRS-8G dissolution apparatus(Tianjin,China)in triplicate(n=3)to investigate the influence of different release method,rotation rate and pH condition on CTN release.Two release methods were rotating basket method and paddle method.The rotation rates were investigated at 50,75,100rpm,separately.Distilled water containing 0.2%SDS,0.1M HCl and pH 6.8 phosphate buffer solutions(PBS)were used as release medium,respectively.All the sampling method and analysis were same as the descriptions in Section 2.4.2.
2.4.4. Analysis of release data
Differences in the release profiles were assessed using the model-independent approach based on the similarity factor(f2)(f2≥50,difference≤10%)[25].Equation off2is shown as follows:
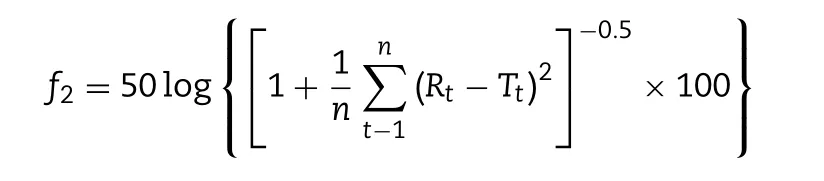
Where n is the number of time points,Rtand Ttare the release values of the reference and test at time t,respectively.
2.5. Scanning electron microscopy(SEM)
Scanning electron microscope(S-3000N,Hitachi,Japan)was used to examine the shape,surface and cross-section morphology of the CTN-SRPs.Prior to the examination,samples were fixed on a brass specimen club by double-side adhesive tape and coated with the gold in argon atmosphere using a Hitachi Iron Sputter(E-1030)to assure conductivity.
2.6. Pharmacokinetic studies
2.6.1. Animals
Sprague–Dawley rats(190–210g)were obtained from Experimental Animal Center of China Pharmaceutical University(Nanjing,China)and housed with free access to food and water.The rats were fasted for 12h before the pharmacokinetics study.All experiments were approved by the Institutional Animal Care and Use Committee of China Pharmaceutical University.
2.6.2. Animal experiments
Twelve male Sprague–Dawley rats divided randomly into two groups were fasted for 12h with free access to water.Two formulations(CTN immediate-released pellets and the optimal CTN-SRPs)at a dose equivalent to 30mg/kg of CTN were filled into size 5 hard gelatin capsules and orally administered to these rats(n=6),respectively.Blood samples(0.5ml)were collected from the ophthalmic venous plexus before dosing and at 0.5,1,2,3,4,5,6,8,12,16,24,32 and 48h post-dose.Plasma was separated by centrifugation at 3500rpm for 10min and stored at-20°C until analysis.
2.6.3. Sample preparation
Sample preparation was carried out under subdued light.An aliquot of 200 μl plasma was pipetted in a 10ml conical centrifuge tube and vortex-mixed with 400 μl of acetonitrile for 3min.The mixture was centrifuged at 3500rpm for 10min.Then,the organic layer was taken and evaporated to dryness under a gentle stream of nitrogen flow at 40°C water bath.The residue was reconstituted with 100 μl of methanol and centrifuged at 12000rpm for 10min.Aliquots(20 μl)of the supernatant were injected into the HPLC system for analysis.
2.6.4. HPLC conditions
The HPLC system(Shimadzu LC-20A,Kyoto,Japan)equipped with a diode array detection(DAD)was set at 263nm.The separation was performed at 30°C on a Kromasil 100–5 C18 column(5μm,150mm×4.6mm,Kromasil,Sweden)protected by a C18 Securityguard column(5μm,10mm×4.6mm,Kromasil,Sweden).The mobile phase was methanol/water(85/15,v/v)and delivered at a flow rate of 1.0ml/min.
2.6.5. Data analysis
Pharmacokinetic parameters of CTN,including Cmax,Tmax,AUC0–tand AUC0-∞were calculated by non-compartmental analysis using the software program PKSolver.Data reported were arithmetic mean values±standard deviation(Mean±SD).The statistical significance of the differences was analyzed using two-tailed Student’s t-tests with an evaluation criterion of P<0.05 or 0.01.
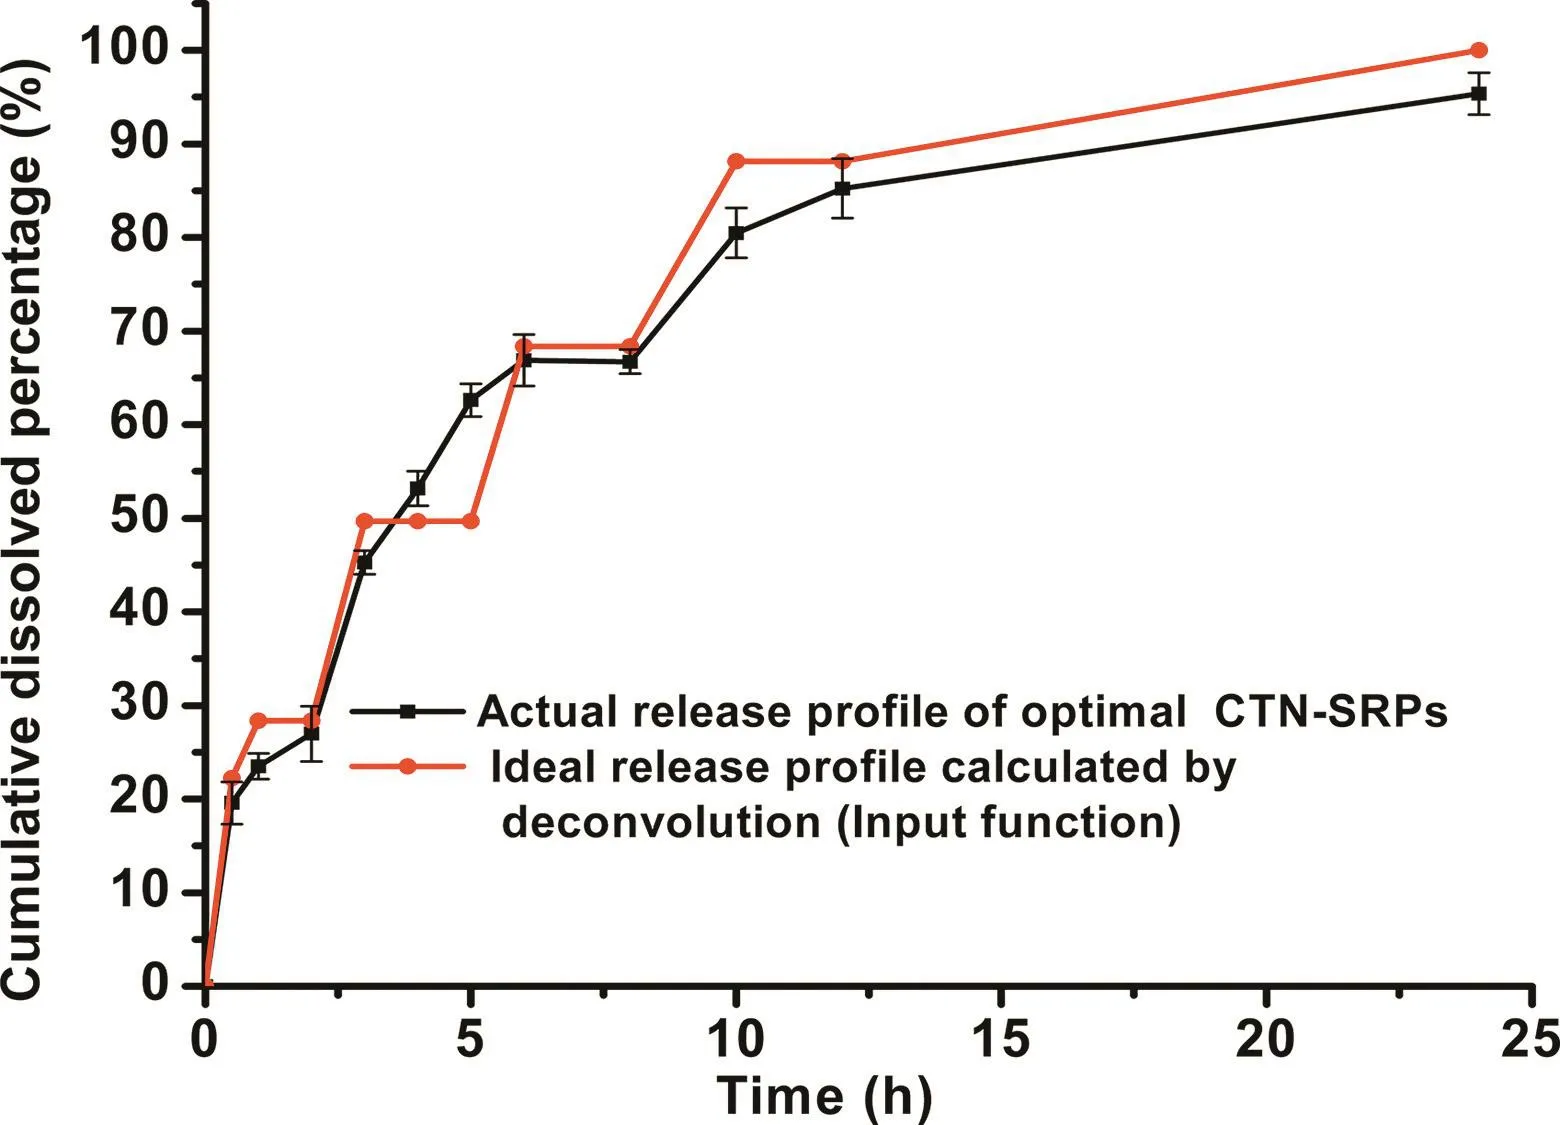
Fig.4–The desired drug release profile of CTN-SRPs calculated based on deconvolution and the actual release profile of the optimal CTN-SRPs.
3. Results and discussion
3.1. Desired drug release profile of CTN-SRPs
The desired drug release profile of CTN pellets was calculated based on the method of deconvolution.The plasma concentration-time curve of CTN in rats after oral administration of CTN immediate-released pellets(shown in Fig.2)was used as a weight function.The expected plasma concentration-time curve of CTN-SRPs(shown in Fig.3)was used as a response function.Then,the desired drug release profile of CTN-SRPs as an input function was calculated.As shown in Fig.4,a stepwise and relatively smooth curve was obtained.Then,the predicted drug release profile was used for guiding the formulation optimization of CTN-SRPs.
3.2. Formulation optimization of CTN-SRPs
The ratios of polymers were adjusted to control CTN release.To obtain the desired formulation with release profile similar with the ideal one,formulations with different ratios were screened by orthogonal design.Then,the release of pellets with different ratios was investigated and their release profiles were compared with the ideal one by f2.The f2value of each experimental run was given in Table 1.Experimental run NO.4 exhibited the largest f2value in all these nine factor level combinations.As predicted by the orthogonal design,maximum of f2values will appear when the levels of the investigated variables are 0.35g(X1),0.15g(X2)and 0.5g(X3),respectively.The release profile of this predicted optimal formulation was similar with the expected one calculated based on the method of deconvolution as shown in Fig.4.Besides,the f2value of this predicted optimal formulation was 62.5 which was larger than experimental run NO.4(P<0.05).Thus,this predicted optimal formulation was selected for the following studies.
3.3. Investigation of drug release stabilities
The influence of different release method,rotation rate and pH condition on CTN release was investigated and compared by f2analysis.As shown in Fig.5A,the release profiles tested by different method were extremely alike with f2of 77.32.In addition,with rotation rate of 100rpm as a reference,f2values for 50rpm and 75rpm were 66.33 and 77.18,respectively(shown in Fig.5B).As depicted in Fig.5C,the drug release behavior in 0.1M HCl and pH 6.8 PBS were similar to that in distilled water containing SDS(0.2%)with f2of 73.87 and 77.05,separately.These results indicated that release method,rotation rate and pH condition had no remarkable influence on the release of CTN-SRPs under sink condition.Thus,it can be implied that under the sink condition of gastrointestinal tract the pellets could show stable release after oral administration which means good correlation of in vitro and in vivo release.Then,the good correlation of in vitro and in vivo release was further in favor of the deconvolution-based formulation development.
3.4. SEM characterization of CTN-SRPs
Observed under SEM,the prepared pellets were rounded and showed a coarse surface(Fig.6A,B).Concave pores were uniformly distributed on the surface under larger magnifications(Fig.6A,B)which probably be produced during the process of spray solution volatilization from the surface of CTN-SRPs.In addition,the cross-section view indicated a layer of compact coating of solid dispersion around the sugar pellets core(Fig.6C,D).
3.5. In vivo performance
CTN in plasma could be completely separated under analytical conditions,and no significant matrix effect was observed for the analytes in the plasma samples.The linearity study was performed in the concentration range of 0.01–0.5μg/ml(R2=0.997)and the limit of quantification was 10ng/ml.Intraday and interday precision RSD values were below 10%.The relative recoveries of high,middle and low concentrations were 105.31%±16.56%,101.43%±10.74%and 97.59%±6.35%,respectively and all of the absolute recoveries were above 85%.
Pharmacokinetics in rats was investigated to verify whether the CTN-SRPs optimized based on deconvolution had a desirable plasma drug concentration-time profile.As shown in Fig.3,the plasma concentration-time curve of CTNSRPs was similar with the simulated mean predicted one.The percent prediction error(%PE)value of CTN plasma concentration at each time point was calculated according to equation%PE=(observed value-predicted value)/observed value×100%[26].The%PE values from 4 to 16h were smaller than 15%and the%PE values from 8 to 12h were smaller than 10%.These%PE values demonstrated that the actual observed plasma concentration values were very close to the predicted concentration data calculated and simulated according to the incidence of variant angina during 24h.These results further indicated that the optimized CTN sustained-release formulation succeeded in achieving highest blood concentrations for maximal protection during the time period when angina pectoris is of greatest risk and occurrence.In addition,the pharmacokinetic parameters(Cmax,Tmax,MRT,AUC0–tandAUC0–∞)of the optimized CTN-SRPs were calculated and compared with the predicted values in Table 3.These almost equivalent values further validate that the in vivo performance of these CTN-SRPs after oral administration was in accordance with the expected one.
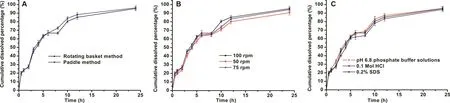
Fig.5–The influence of(A)different release method,(B)rotation rate and(C)pH condition on the release of CTN-SRPs.
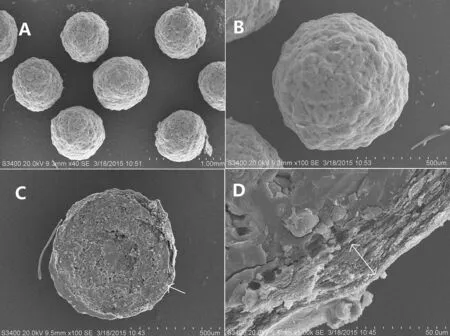
Fig.6–Scanning electron micrographs of surface(A:40×;B:100×)and the cross-section(C:100×;D:1000×)of the optimal CTN-SRPs.

Table 3–The main pharmacokinetic parameters of CTN after oral administration of the optimized CTN-SRPs in rats(n=6)in a dose of 20mg/kg and the pharmacokinetic parameters of the predicted response function.
4. Conclusion
A deconvolution-based method was applied to precisely synchronize the CTN plasma concentrations with predicted occurrence of angina pectoris for angina chronotherapy.The desired drug release profile of CTN-SRPs was calculated based on deconvolution and subsequently used for guiding the for-mulation optimization.Pharmacokinetics study in rats confirmed that the plasma concentration-time curve of the optimized CTN-SRPs was very similar with the expected one which was simulated according to the incidence of angina pectoris.This formulation development method based on deconvolution could be applied to achieve the expected in vivo performance of drugs.In addition,this method established the correlation between the in vitro and in vivo performance and could be useful in reducing the blindness and complexity in the process of formulation development.
Conflicts of interest
The authors declare that there is no conflict of interest.
Acknowledgments
This work was supported by the National Natural Science Foundation of China(No.81473151)and the Priority Academic Program Development of Jiangsu Higher Education Institutions.
REFERENCEs
[1]Smolensky MH,Portaluppi F,Manfredini R,et al.Diurnal and twenty-four hour patterning of human diseases:cardiac,vascular,and respiratory diseases,conditions,and syndromes.Sleep Med Rev 2015;21:3–11.
[2]Lemmer B.The importance of circadian rhythms on drug response in hypertension and coronary heart disease–from mice and man.Pharmacol Ther 2006;111(3):629–51.
[3]Mori H,Nakamura N,Tamura N,et al.Circadian variation of basal total vascular tone and chronotherapy in patients with vasospastic angina pectoris.Biomed Pharmacother 2002;2(1):339s–344s 56 suppl.
[4]Lemmer B.The clinical relevance of chronopharmacology in therapeutics.Pharmacol Res 1996;33(2):107–15.
[5]Portaluppi F,Lemmer B.Chronobiology and chronotherapy of ischemic heart disease.Adv Drug Deliv Rev 2007;59(9–10):952–65.
[6]Ahmed IS,Ayres JW.Comparison of in vitro and in vivo performance of a colonic delivery system.Int J Pharm 2011;409(1–2):169–77.
[7]Naeem AM,Ahmad M,Akhtar N,et al.Development and in vitro-in vivo relationship of controlled-release microparticles loaded with tramadol hydrochloride.Int J Pharm 2011;407(1–2):38–43.
[8]Royce A,Li S,Weaver M,Shah U.In vivo and in vitro evaluation of three controlled release principles of 6-N-cyclohexyl-2′-O-methyladenosine.J Control Rel 2004;97(1):79–90.
[9]Langenbucher F.Handling of computational in vitro/in vivo correlation problems by Microsoft Excel:III.Convolution and deconvolution.Eur J Pharm Biopharm 2003;56(3):429–37.
[10]McEwen BJ.Comment on"Danshen and the cardiovascular System:new advances for an old remedy".Semin Thromb Hemost 2016;42(3):323–4.
[11]Su C-Y,Ming Q-L,Rahman K,et al.Salvia miltiorrhiza:traditional medicinal uses,chemistry,and pharmacology.Chin J Nat Med 2015;13(3):163–82.
[12]Wang BQ.Salvia miltiorrhiza:chemical and pharmacological review of a medicinal plant.J Med Plants Res 2010;4(25):2813–20.
[13]Wang X,Wang Y,Jiang M,et al.Differential cardioprotective effects of salvianolic acid and tanshinone on acute myocardial infarction are mediated by unique signaling pathways.J Ethnopharmacol 2011;135(3):662–71.
[14]Maione F,De FV,Caiazzo E,De ML,Cicala C,Mascolo N.Tanshinone IIA,a major component of Salvia milthorriza Bunge,inhibits platelet activation via Erk-2 signaling pathway.J Ethnopharmacol 2014;155(2):1236–42.
[15]Maione F,Cantone V,Chini MG,De FV,Mascolo N,Bifulco G.Molecular mechanism of tanshinone IIA and cryptotanshinone in platelet anti-aggregating effects:an integrated study of pharmacology and computational analysis.Fitoterapia 2015;100:174–8.
[16]Ma S,Zhang D,Lou H,Sun L,Ji J.Evaluation of the anti-inflammatory activities of tanshinones isolated from Salvia miltiorrhiza var.alba roots in THP-1 macrophages.J Ethnopharmacol 2016;188:193–9.
[17]Li X,Lian LH,Bai T,et al.Cryptotanshinone inhibits LPS-induced proinflammatory mediators via TLR4 and TAK1 signaling pathway.Int Immunopharmacol 2011;11(11):1871–6.
[18]Jin YC,Kim CW,Kim YM,et al.Cryptotanshinone,a lipophilic compound of Salvia miltiorrriza root,inhibits TNF-α-induced expression of adhesion molecules in HUVEC and attenuates rat myocardial ischemia/reperfusion injury in vivo.Eur J Pharmacol 2009;614(1–3):91–7.
[19]Lam FF,Yeung JH,Chan KM,Or PM.Mechanisms of the dilator action of cryptotanshinone on rat coronary artery.Eur J Pharmacol 2008;578(2–3):253–60.
[20]Jing Z,Huang M,Guan S,et al.A mechanistic study of the intestinal absorption of cryptotanshinone,the major active constituent of Salvia miltiorrhiza.J Pharmacol Exp Ther 2006;317(3):1285–94.
[21]Song M,Hang TJ,Zhang ZX,Du R,Chen J.Determination of cryptotanshinone and its metabolite in rat plasma by liquid chromatography–tandem mass spectrometry.J Chromatogr B Analyt Technol Biomed Life Sci 2005;827(2):205–9.
[22]Li JF,Wei YX,Ding LH,Dong C.Study on the inclusion complexes of cryptotanshinone with beta-cyclodextrin and hydroxypropyl-beta-cyclodextrin. Spectrochim Acta A Mol Biomol Spectrosc 2003;59(12):2759–66.
[23]Hu LD,Xing Q,Meng J,Shang C.Preparation and enhanced oral bioavailability of cryptotanshinone-loaded solid lipid nanoparticles.AAPS PharmSciTech 2010;11(2):582–7.
[24]Vaughan DP,Dennis M.Mathematical basis of point-area deconvolution method for determining in vivo input functions.J Pharm Sci 1978;67:663–5.
[25]Jantratid E,De MVE.Application of biorelevant dissolution tests to the prediction of in vivo performance of diclofenac sodium from an oral modified-release pellet dosage form.Eur J Pharm Sci 2009;3(3–4):434–41.
[26]Qi X,Liu RR,Sun D,Ackermann C,Hou H.Convolution method to predict drug concentration profiles of 2,3,5,6-tetramethylpyrazine following transdermal application.Int J Pharm 2003;259(1–2):39–45.
杂志排行
Asian Journal of Pharmacentical Sciences的其它文章
- Succinylated whey protein isolate as a sustained-release excipient of puerarin derivative oral tablets:Preparation,optimization and pharmacokinetics
- Evaluation of micelles incorporated into thermosensitive hydrogels for intratumoral delivery and controlled release of docetaxel:A dual approach for in situ treatment of tumors
- Intracellular distribution and internalization pathways of guanidinylated bioresponsive poly(amido amine)s in gene delivery✩
- Development and bioequivalence study of potassium chloride extended release tablets✩
- Creation of an assessment system for measuring the bitterness of azithromycin-containing reverse micelles
- Predicting oral disintegrating tablet formulations by neural network techniques✩