Characterization of Polysaccharides Extracted from a Cultivated Brown Alga Costaria costata During the Harvest Period
2018-08-28LIUNannanWUXinFUXiaotingDUANDelinXUJiachaoandGAOXin
LIU Nannan , WU Xin FU Xiaoting , DUAN Delin, , XU Jiachaoand GAO Xin
1) College of Food Science and Engineering, Ocean University of China, Qingdao 266003, China
2) State Key Laboratory of Seaweed Bioactive Substances, Qingdao 266000, China
3) Key Laboratory of Experimental Marine Biology, Institute of Oceanology, Chinese Academy of Sciences,Qingdao 266071, China
(Received August 4, 2017; revised September 11, 2017; accepted June 1, 2018)
© Ocean University of China, Science Press and Springer-Verlag GmbH Germany 2018
Abstract In this study, variations in composition and properties of polysaccharides isolated from brown algae Costaria costata were analyzed. The algae were collected from May to July of the harvest period. The carbohydrates alginate and fucoidan were extracted with selected solvents. 1H Nuclear magnetic resonance and rheology were used to investigate the monomer composition and rheological characteristics of alginate. Gas chromatography and Fourier transform-infrared spectroscopy were employed to investigate the compositional properties of purified fucoidan. The results indicated that the composition and properties of alginate and fucoidan varied during the life of this alga. The alginate from the alga harvested in May and June had a higher molecular weight, viscosity, and proportion of mannuronic acid, whereas that harvested in July had a lower molecular weight and viscosity but a higher proportion of guluronic acid. The alginate from C. costata had a higher molecular weight and a different mannuronic acid: guluronic acid ratios compared with other algae; thus, it could be used in the chemical, food, cosmetics, and pharmaceutical industries. Fucoidan content reached the maximum in June. Substantial changes in the molecular weight distribution, monosaccharide composition,and sulfate content occurred simultaneously. The fraction of fucose in the polysaccharides decreased significantly from June to July,whereas that of mannose increased. This alga can be harvested during different growth periods to obtain fucoidans and alginates with different compositions and, therefore, with different biological properties.
Key words alginate; brown alga; Costaria costata; fucoidan; polysaccharides
1 Introduction
Brown algae contain large quantities of polysaccharides in their cell walls, and the majority is alginates and fucoidans (Fenoradosoa et al., 2010). Most brown algae are potential resources of alginate production, among which the genera Saccharina (Laminaria), Macrocystis, and Ascophyllum are the main commercial sources (McHugh,1987). Alginates are linear polymers composed of (1→4)β-D-mannuronic acid (M) and (1→4) α-L-guluronic acid(G). An alginate molecule can be considered a block consisting of MM, GG, and MG blocks opposed by two uronic acid molecules (McHugh, 1987). Alginate is present in the cell walls of brown algae in the forms of calcium, magnesium, and sodium salts of alginic acid(McHugh, 2003). In particular, Ca2+ions blended with GG blocks form a gel, which is explained by the ‘egg box’model (Grant et al., 1973). Alginic acids and their salts are widely used in various fields due to their ability to thicken, jellify, emulsify, and stabilize food (Khotimchenko et al., 2001). They are also used in the textile printing, pharmaceutical, medical, and other industries(McHugh, 2003).
The characteristics of alginate depend on the relative amount of the three blocks and the lengths of the polymers (Jothisaraswathi et al., 2006). The physicochemical properties vary among different species of seaweeds due to different structures and compositions. Alginate producers prefer buying a mixture of algal species and blending products to suit particular uses (McHugh, 2003).Thus, finding new raw materials for producing alginate with good yield or specific properties is very important.
Costaria costata is an annual brown alga that grows from April to June, and matures in July. It is distributed in the north Pacific area, including the American coastal areas from Alaska to California, as well as in Sea of Okhotsk, Japan, northeast of the Korean Peninsula, and northern Japan. In recent years, C. costata has been suc-cessfully cultivated in Rongcheng, China. The physicochemical analysis of polysaccharides from cultivated C.costata during one growth stage (Li et al., 2011) and the seasonal variations in polysaccharides from wild type C.costata at different life stages (Imbs et al., 2009) have been reported. However, the detailed composition information and rheological properties of alginate and fucoidan from cultivated C. costata at different life stages have not been reported.
The aim of this study was to isolate and purify the main carbohydrates, i.e., alginate and fucoidan, from cultivated C. costata harvested in May, June, and July, and to analyze their composition and properties including the determination of molecular weight and viscosity, a spectroscopic analysis, and the rheological determination. The results of this study will provide a theoretical basis for applying C. costata carbohydrates in the food and pharmaceutical industries, as well as provide practical suggestions for the suitable harvest time for industrial applications of this alga.
2 Materials and Methods
2.1 Materials
C. costata samples were collected between May and July, 2012 from Rongcheng (37˚9´N, 122˚24´E) that locates on the coast of the Yellow Sea of China. The samples were washed with tap water followed by washing with distilled water. Then, the samples were freeze dried before being ground. The resulting powder was stored at 4℃ for later chemical analyses.
2.2 Isolation of Alginates
Approximate 5 g of ground algae was suspended in 125 mL of distilled water for 2 h at room temperature to remove water-soluble content. Then, 0.344 mL of methanol was added to the mixture, which was held at 40℃ for 1 h.The pH of the suspension was adjusted to 11 by adding Na2CO3powder, and the suspension was stirred at 70℃for 3 h. The extracted solution was diluted with 475 mL distilled water and filtered. The pH of the collected filtrate was adjusted to 3 by adding 10% HCl. The precipitate was collected, washed with 95% ethanol, and transferred to a soluble form by immersing it in a NaOH solution of pH 8 for 40 min with stirring. The precipitate that formed was washed with 95% ethanol, freeze dried, and stored at 4℃ for further use as alginate.
2.3 Extraction and Purification of Fucoidan
Fucoidan was isolated from C. costata using water,acid, enzyme, and ultrasonic-assisted extraction methods.For the water extraction method, approximately 5 g of ground alga powder was suspended in 120 mL of distilled water and incubated at 70℃ for 3 h. For the acidic extraction method, the pH of the above water extraction system was adjusted to pH 2.5 by adding HCl. The enzymatic extraction was carried at 50℃ and a pH of 4.5 for 12 h in an enzyme reaction system by adding 0.1% Celluclast and 10 mmol L-1sodium acetate to the above water extraction system. The ultrasonic-assisted extraction method was carried out by subjecting the alga to ultrasound for 15 min,and adding 0.5% SDS to the water extraction system,followed by a 3 h incubation at 70℃.
After these extraction procedures, the algal residue was removed by filtration. The filtrate was precipitated by adding CaCl2and 20% ethanol to remove the alginate.The collected filtrate was precipitated with 80% ethanol.The precipitate was freeze dried and stored at 4℃ for further use as crude fucoidan.
Isolated fucoidan was further fractioned on a Q-Sepharose Fast Flow column (2.6 × 30 cm, GE Healthcare,Uppsala, Sweden) equilibrated with phosphate buffer(0.02 mol L-1, pH 7.2). Fractions were eluted with a 1000 mL linear gradient ranging from 0 to 2 mol L-1NaCl in equilibration buffer at a flow rate of 0.9 mL min-1(4.5 mL per tube). Each fraction was evaporated, dialyzed, freeze dried, and stored at 4℃ until use.
2.4 General Methods
The crude fucoidan yield was calculated by comparing the weight of crude fucoidan obtained to that of the dried seaweed. The yield of each purified fucoidan fraction was calculated by comparing the weight of the fraction obtained to that of the crude fucoidan before purification.Total carbohydrate was quantified by the phenol-sulfuric acid colorimetric method and expressed as a percentage of the carbohydrate obtained (Dubois et al., 1956). Fucoidan content was determined by the methylene blue colorimetric method and expressed as a percentage of the carbohydrate obtained (Liu et al., 2002). Sulfate content was estimated using the barium chloride turbidimetric method (Dodgson and Price, 1962) after the hydrolysis of the polysaccharides in 1 mol L-1, HCl and expressed as a percentage of the carbohydrate obtained. Uronic acid content in fucoidan was determined by the sulfuric acid-carbazole method and expressed as the percentage of carbohydrate obtained (Blumenkrantz and Asboe-Hansen, 1973).
The molecular weight distributions of alginate and fucoidan were estimated by gel-permeation chromatography using an Agilent 1260 instrument (Agilent Technologies,Palo Alto, CA, USA) equipped with a differential refractive detector and a TSK-gel GM PWXL column (7.8 mm× 30 cm) at 35℃ with a flow rate of 0.5 mL min-1. The polysaccharide concentration was 1 mg mL-1in 0.2 mol L-1NaCl solvent. Dextran samples with Mwvalues of 5.21 × 10⁵, 2.89 × 10⁵, 1.1 × 10⁴, 6.06 × 10⁴, 1.26 × 10⁴, and 4.32 × 10³g mol-1were used as standards. All samples were filtered through a 0.45 μm Millipore membrane(Millipore Inc., Bedford, MA, USA) before injection to remove any impurities.
2.5 FT-IR Spectrometric Analysis
One mg of dried carbohydrate was dispersed in 100 mg of anhydrous potassium bromide and pressed. The IR spectra were recorded at room temperature in a wave number range of 400-4000 cm-1using a Nicolet 470 FT-IR instrument (Thermo Fisher Scientific, Waltham, MA,USA). A total of 32 scans were averaged for each sample at a resolution of 4 cm-1.
2.6 Chemical Composition and Properties of the Alginates
2.6.1 Dynamic viscosity
The sodium alginate samples were dissolved in distilled water to form a 1% aqueous solution. The viscosity of the sodium alginate was measured by a NDJ-1 rotational viscometer at 20℃.
2.6.2 Chemical composition
The abundance or frequencies of individual monomer guluronic (FG) and mannuronic (FM) acid residues as well as the frequencies of the dial uronic acid pairs (i.e., FGG,FMM, and FMG) were determined by integrating the appropriate1H NMR peaks according to the protocol proposed by Grasdalen (1983). The FGGquantity is typically used to characterize the degree of guluronic acid block structure for a given alginate sample.
The1H NMR analysis was achieved at room temperature with a NMR spectra instrument (JNM-ECP600). The NMR experiments were recorded at a frequency of 6000 MHz, acquisition time of 3.64 s, pulse width of 12 μs, and relaxation time of 1 s. The sodium alginate samples were dissolved in deionized water, and 0.1 M HCl was added to adjust the pH to 3.0. The samples were hydrolyzed in boiling water for 1 h, dialyzed (exclusion limit M = 14000)against deionized water for 48 h, freeze-dried, and dissolved in deuterium oxide to determine the GG, MM, and GM blocks.
2.6.3 Rheological determination
The rheological properties of a 1% sodium alginate solution were determined with an Anton-Paar Instrument Rheometer (MCR101; Anton-Paar Instruments, Houston,TX, USA) by dynamic measurements with parallel plate geometry giving the evolution of dynamic moduli (G′means the storage modulus and G′ means the loss modulus) as a function of the frequency in the linear domain. The viscosity and shear stress as a function of shear rate, as well as the viscosity as a function of temperature were determined.
2.7 Compositional Properties of Fucoidan
2.7.1 Monosaccharide compositional analysis
The composition of monosaccharides was determined by GC as their alditol acetates. Derivatives were prepared by hydrolysis with trifluoroacetic acid followed by acetylation as described previously (Zhang, 2013). The GC analysis was performed using Agilent 6890N GC instrument equipped with a fused silica capillary column DB-225 (30 m × 0.32 mm × 0.25 μm; J & M Scientific, Folsom,CA, USA). Samples were detected with a flame ionization detector at 250℃, and the injector and oven temperatures were set at 250 and 210℃, respectively. Rhamnose, fucose, arabinosel, xylose, mannose, glucose, and galactose were used as standards.
2.7.2 Fourier transform-infrared (FT-IR)spectrometric analysis
IR spectra were recorded from purified fucoidan powder (6F1, 6F2, and 7F1) in KBr pellets using a FT-IR spectrometer between 400 and 4000 cm-1, as described previously.
2.8 Statistical Analysis
Independent experiments were carried out in triplicate.All mean values were analyzed by one-way analysis of variance (SPSS V17.0; SPSS Inc., Chicago, IL, USA).Data are expressed as mean ± standard deviation. Group means were considered significantly different at P < 0.05.
When I was a little girl, my father had a time-honored tradition of tucking me into bed. Following my bedtime story, he would give me a nose kiss, tickle1 my stomach and whisper the most wonderful words into my ear. “Michelle, of all the little girls in the whole wide world . . .” he would pause.
3 Results and Discussion
The polysaccharide composition of C. costata has been investigated at a preliminary level; thus, the data on chemical composition are limited. Some basic properties and overall compositional characteristics of alginate and fucoidan have been briefly analyzed (Li et al., 2011; Imbs et al., 2009), while seasonal variations in compositional information and rheological properties of alginate and fucoidan have not been reported. In this study, we performed a detailed investigation of the composition and properties of the carbohydrates from cultivated C. costata.Alginate and fucoidan were extracted from the alga during the May-July harvest period. Fucoidan was further purified and analyzed by chemical and spectroscopic methods.
3.1 Alginate
3.1.1 Variations in alginate content
The alginate from C. costata was extracted with a sodium carbohydrate solution. The monthly variations in alginate content from C. costata were reported in our previous study (Wu et al., 2014). Alginate content varied significantly during the harvest period with a maximum of around 30%, which was higher than that of the traditional Saccharina japonica, an important alginate producing resource. It has been demonstrated previously that the ability to form a gel and the strength of alginate depends upon the molecular weight and mannuronic acid:guluronic acid ratio (M/G) distribution (Liu et al., 2003).The structure and properties of alginate from cultivated C.costata were determined in this study to investigate the applications of alginate isolated from C. costata.
3.1.2 Molecular weight distribution
The average molecular weights of alginate from C. costata harvested in May-July were calculated (Table 1).Significant variations in molecular weight were observed during the 3 months. The molecular weight of the alginate from C. costata decreased as the alga matured. A com-parison of molecular weights of alginate isolated from several brown algae is shown in Table 2. Generally, the molecular weight of alginate varies between 5 × 10⁵and 1× 10⁶g mol-1(Chee et al., 2011), but changes with genus,harvest time, and location (Imbs et al., 2009). However,the molecular weight of alginate from C. costata was much higher than those of other species (Table 2). Alginates with molecular weights from 3.49 × 10⁵to 7.14 × 10⁵g mol-1were isolated previously from wild-type C. costata (Imbs et al., 2009), whose molecular weight was below the value of cultivated C. costata in this study. The molecular weight of alginate isolated from Dictyota caribaea (García-Ríos et al., 2012) was similar to the value found in C. costata harvested in July in this study.

Table 1 Content, average molecular weight, and dynamic viscosity of alginates harvested from Costaria costata during different months
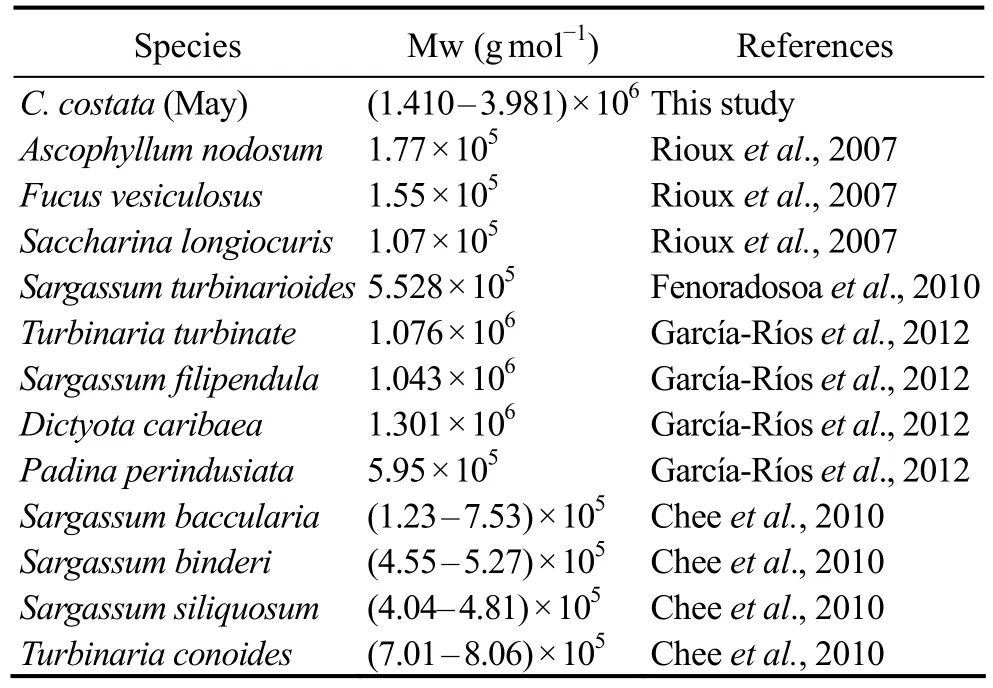
Table 2 Comparison of molecular weights (Mw) of alginates
3.1.3 Dynamic viscosity
The dynamic viscosity of alginate from C. costata is shown in Table 1. The change in viscosity followed the same trend as that of molecular weight, which was highest in May, and then decreased significantly (P < 0.05) in June and July. The viscosity of alginate is strongly affected by its molecular weight (Peña et al., 1997). The higher the molecular weight of an alginate, the greater the viscosity of its solution (McHugh, 1987). Alginate has been classified into three grades with low, medium, and high viscosity for industrial applications (McHugh, 1987;Chee et al., 2011). The viscosity of the low viscosity alginate is up to about 50 mPa s, while that of the medium viscosity alginate is up to 400 mPa s, and that of high viscosity alginate is > 400 mPa s (McHugh, 1987). Low viscosity alginate is usually used in the paper making and fruit industries, while the high viscosity alginate is usually used in the food and cosmetic industries (Hernandez-Carmona et al., 2000), and medium viscosity alginate has the widest application (McHugh, 1987). As shown in Table 1, the alginate harvested from C. costata in May was high viscosity alginate, and that in June and July was medium viscosity alginate. The viscosity of alginate from C. costata harvested in June was comparable to that of Saccharina (Laminaria) japonica which was 471.1 mPa s(Li, 2011). These results indicate the potential broad applications of alginate from C. costata.
3.1.4 Rheological measurements
The rheological characteristics of alginate are important parameters for its applications. The flow curves for a 1% sodium alginate solution are shown in Figs.1-4.
Fig.1 shows the apparent viscosity of 1% sodium alginate as a function of shear rate at 20℃. Although the viscosity values were different, the behavior of C. costata alginate harvested during different months showed a similar trend. Apparent viscosity decreased with increasing shear rate; thus, an alginate solution can be classified as a non-Newtonian liquid exhibiting shear-thinning behavior. The shear-thinning behavior of polysaccharide solutions is explained by the entanglement process of the polymers, where the rate of disentanglement due to shear is higher than that of re-entanglement (Morris, 1990).
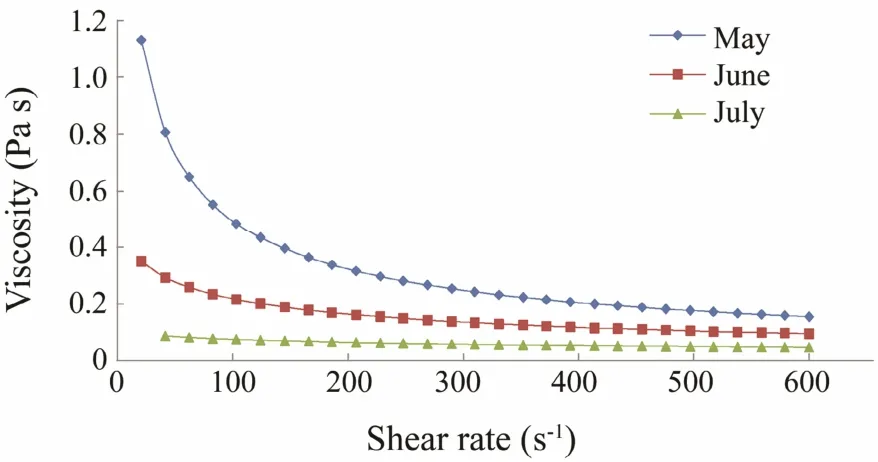
Fig.1 Steady state viscosity as a result of shearing rate for a 1% sodium alginate solution of Costaria costata harvested during different months.
Thixotropy is an important non-Newtonian fluid characteristic. The rheological characteristics include decreases in apparent viscosity under constant shearing action, hysteresis loops appearing as shear rate changes circularly, and apparent viscosity rising or falling as shear rate changes in step (Mewis and Wagner, 2009). Fig.2 shows the thixotropic curves of 1% C. costata sodium alginate harvested during different months. The corresponding hysteresis loop area data obtained from the Rheometer MCR101 software were 36.45, 5.37, and 3.52 Pa s for the C. costata alginate harvested in May, June,and July, respectively. It was generally observed that the area of the hysteresis loops was an estimate of the degree of thixotropy, and the greater the hysteresis area, the stronger the thixotropic properties. A negative hysteresis loop area value represents damage to the microstructure as shear rate increases, whereas a positive value represents structural recovery (Benchabane and Bekkour, 2008).Ma et al. (2014) reported that the hysteresis area of the 1% solution of commercial sodium alginate is 0.41 Pa s,which is lower than the C. costata alginate solution with the same concentration. Thus, a C. costata alginate solution could be used in the food industry because of its good thixotropy.
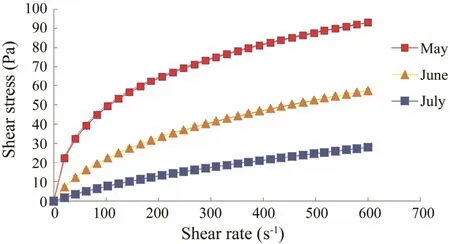
Fig.2 Thixotropic curves of 1% sodium alginate from Costaria costata harvested during different months.
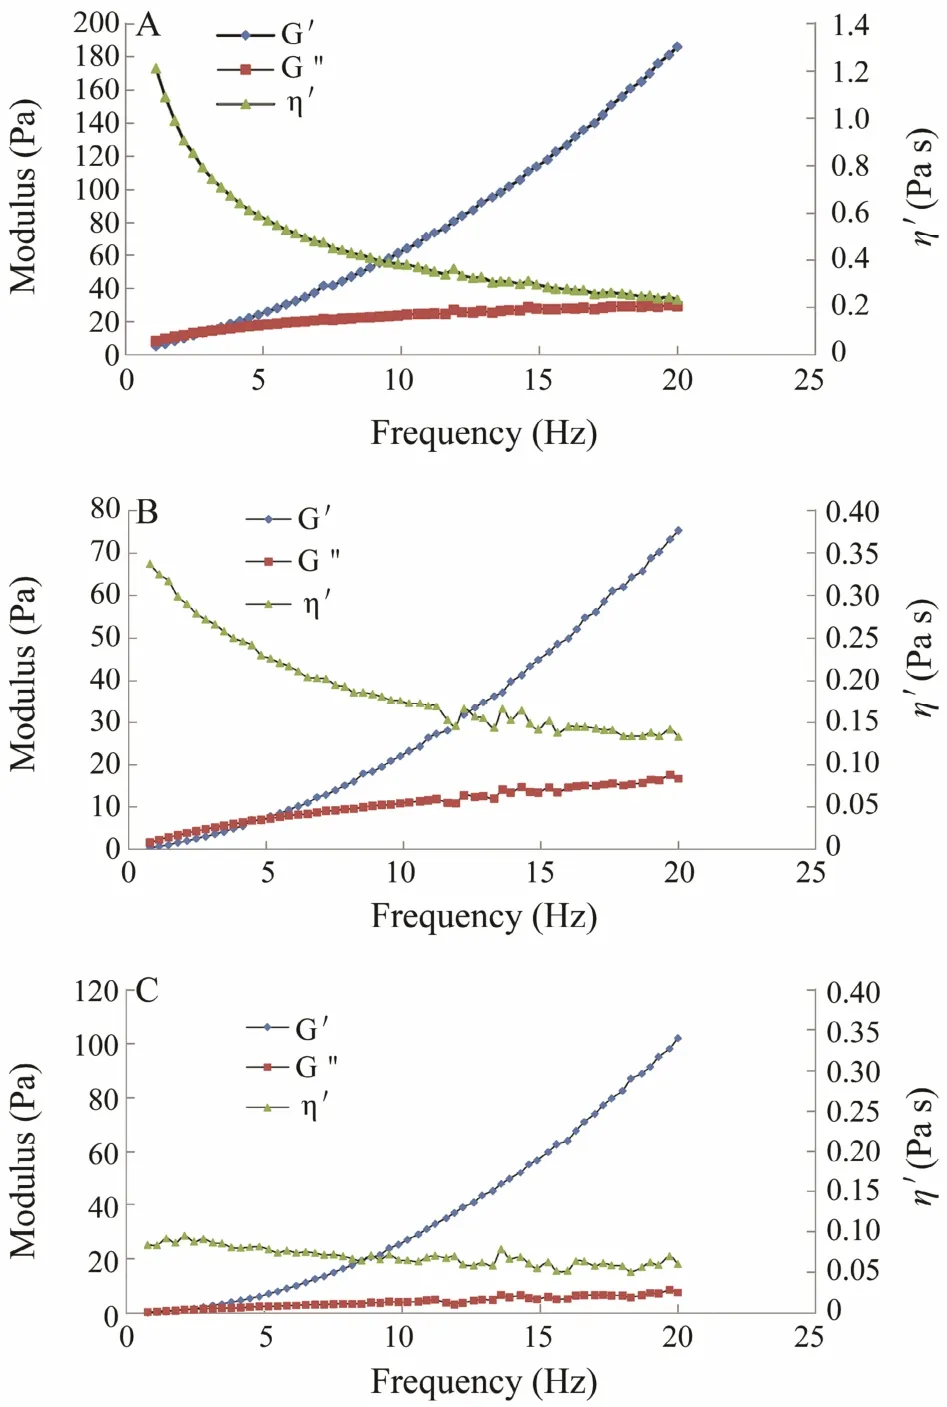
Fig.3 Storage modulus (G′), loss modulus (G″), and complex viscosity (η′) as a function of frequency for a 1% sodium alginate solution of Costaria costata harvested during May (A), June (B), and July (C).
The viscous and elastic responses of viscoelastic systems can be quantified by measuring dynamic oscillations.Dynamic oscillatory frequency sweep tests were carried out to determine the viscoelastic behavior of C. costata alginate solutions, including the storage modulus (G′), the loss modulus (G″), and complex viscosity (η′). As shown in Fig.3A-C, both G′ and G′ of all samples increased with increasing oscillatory frequency. An intersection point of the G′ and G′ curves was observed in each figure,the value of which was < 5 Hz. The G″ values for all samples were higher than G′ at the frequency below the intersection point; thus, the alginate solutions exhibited viscous behavior at low frequency. The alginate solutions exhibited viscous behavior at the frequencies above the intersection point. Complex viscosity in all tested samples decreased as frequency increased. Breaking and reformation of molecular bonds during frequency sweeps can lead to structural changes that affect the rheological properties (Tunick, 2011). There is insufficient time for the broken inter and intramolecular bonds to reform at high frequency. This phenomenon may have led to permanent molecular alignment or disentanglement of long chain polymers, and consequently, decreased the complex viscosity (Tunick, 2011).
Fig.4 indicates that viscosity was highly temperature dependent. Viscosity decreased with increasing temperature from 20 to 85℃. The viscosity of the alginate harvested in May was much higher than that harvested during the other 2 months in all temperature ranges measured.These results reveal that the alginate of C. costata harvested in May exhibited the important properties to maintain the texture of foods during processing and storage.
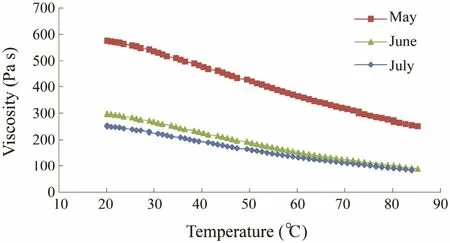
Fig.4 Viscosity as a function of temperature for a 1% sodium alginate solution of Costaria costata harvested during different months.
3.1.5 Spectroscopic analyses
The infrared spectra of alginate from C. costata harvested during different life stages are shown in Fig.5.According to the alginate spectrum in May, a broad band at 3503 cm-1was attributed to hydrogen O-H stretching vibrations. The signals at 2926 and 1617 cm-1were assigned to C-H stretching vibrations and carboxylate OC-O asymmetric stretching vibrations, respectively (Wang et al., 2010). The band at 1417 cm-1was due to a C-OH deformation vibration with a contribution of O-C-O symmetry stretching vibration of the carboxylate group(Leal et al., 2008). The region at 885 cm-1was equivalent to the C1-H deformation vibration of β-mannuronic acid.Signals at 814 and 669 cm-1were attributed to the characteristic absorption peaks of polymannuronic acid (M)and poly-gurouronic acid (G), respectively (Wang et al.,
2010). As shown in Fig.5, the absorption peaks of alginate from C. costata harvested during different months were similar. Only the M and G peaks showed some differences. The absorption value of M decreased from May to July, while that of G showed the opposite trend, indicating that part of M was transferred to G from May to July.
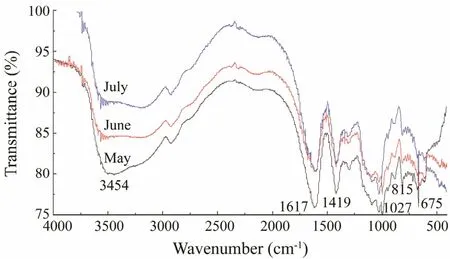
Fig.5 Fourier transform-infrared spectra of sodium alginate from Costaria costata.
1H NMR spectroscopy, which is one of the most widely used methods to determine the composition and block structure of alginate, was adopted in this study. The composition of alginate from C. costata was determined by comparing the signal areas of G1 (IA), MGM (IB), M1(IC), and G5 (ID). The following equations reported by Gradsalen (1983) were used to calculate FG (fragment of G), FGG (fragment of GG), FM (fragment of M), FMM(fragment of MM), FMG (fragment of MG), and FGM(fragment of GM):
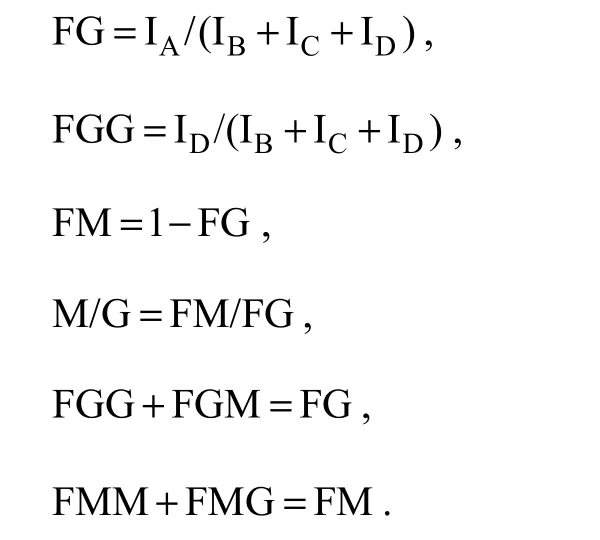
The η parameter (η = FMG/(FM + FG)) was used to characterize and test the sequence distributions. An alginate sample is considered a structure of the homopolymeric block type if η is < 1 (Larsen et al., 2003; Ermakova et al., 2011). The block distributions and characteristics of the alginates from C. costata are shown in Table 3. All alginate samples contained more mannuronic acid than guluronic acid (M/G > 1) and had a homopolymeric block type structure (η < 1). The results showed that the M/G ratio decreased from May to July, which was in accordance with the infrared spectrum results.

Table 3 Block distributions and block characteristics (η) of alginates from Costaria costata
1H NMR (spectra not shown) indicated that C. costata alginate had a relatively higher content of M than G, and the M blocks decreased while the G blocks increased as C.costata matured (Table 3). Imbs et al. (2009) reported that the collection time strongly affects the alginate monomer composition. The decrease in the M/G ratio in alginates as algae age has also been observed in alginates isolated from other species, such as Turbinaria conoides (Jothisaraswathi et al., 2006).
The physicochemical properties and biological activities of alginate depend greatly on its monomer composition. A higher M/G ratio generally produces a more elastic gel, and a lower M/G ratio produces a stronger gel(Imbs et al., 2009). However, the properties of alginate gels also depend on their molecular weight (Fenoradosoa et al., 2010). As compared with other alginates, the molecular weight of the alginate from C. costata was higher than those from other alga, which resulted in the high viscosity of this alginate. Thus, the C. costata alginate was an elastic gel with high viscosity. Alginates that contain high levels of polymannuronic blocks show antitumor effects, and those with high levels of polyguluronic blocks show good biosorption properties (Imbs et al., 2009).
3.2 Fucoidan
3.2.1 Extraction and isolation of fucoidan
Table 4 shows the yield and chemical properties of the crude fucoidan extracted from C. costata (June) using four methods. The yield of crude fucoidan by enzymatic extraction was higher than the yields from the other methods. The enzymatic extraction method resulted in the highest total carbohydrate content, fucoidan content, and sulfate content of crude fucoidan. Thus, the enzymatic extraction method was chosen as the most suitable one to extract crude fucoidan.

in June using different methodsTable 4 Content and chemical composition of crude fucoidan extracted from Costaria costata

Table 5 shows the yield and chemical properties of crude fucoidan extracted from C. costata harvested during the 3 months. The yield of crude fucoidan in July was much higher than those in May and June, but the fucoidan and sulfate contents of the crude fucoidan in July were lower than those in the other two months. The yield of crude fucoidan in this study was comparable with that of cultivated C. costata (Li et al., 2011), but higher than that of the wild alga (Imbs et al., 2009).
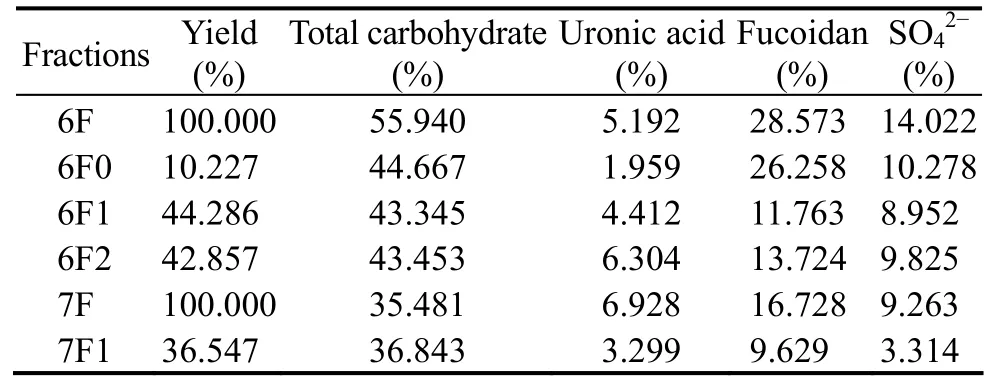
Table 6 Yield and chemical composition of different fucoidan fractions from Costaria costata
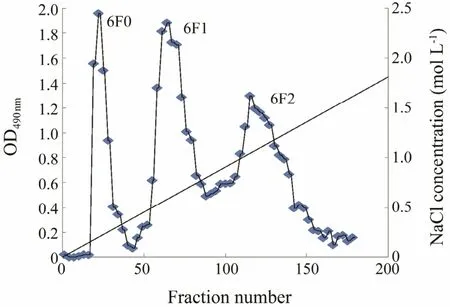
Fig.6 Purification of fucoidan from Costaria costata harvested in June by Q-Sepharose Fast Flow column chromatography.
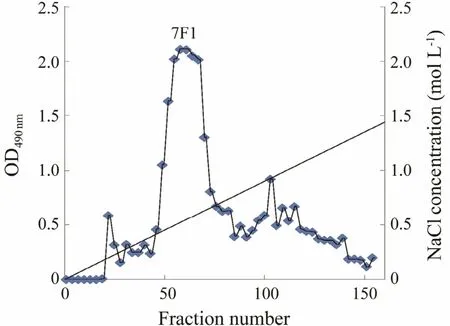
Fig.7 Same as that in Fig.6 but in July.
The crude fucoidan extracted in June (6F) was further purified by ion exchange chromatography. Three fractions,6F0, 6F1, and 6F2, were eluted from the column (Fig.6).As shown in Table 6, the yields of these three fractions were 10.227%, 44.286%, and 42.857%, while the main fractions of 7F was 7F1 with a yield of 36.547% (Fig.7).The molecular weights of the three purified fractions 6F1,6F2, and 7F1 were estimated by gel-permeation chromatography, and they were 1.567 × 10⁴-4.966 × 10³, 4.335 ×10⁵, and 4.721 × 10³g mol-1, respectively.
3.2.2 Compositional properties of fucoidans
Fucoidans present in brown seaweeds are usually very complex irregular polysaccharides, which may be even mixtures of different structural types (Ermakova et al.,2011). The chemical composition of different fractions from C. costata is shown in Table 6. The 6F0 fraction had the highest fucoidan content (26.258%) compared with the other purified fucoidan fractions. This result indicates that all purified fucoidan fractions contained uronic acid,which was coincident with other reported fucoidans. Li and Xu (2004) reported that fucoidan from Sargassum fusiform contains 21.8% uronic acid. Wang et al. (2009)reported that fucoidan from Hizikia fusiforme contains 6.66% uronic acid.
The monosaccharide profiles of the fucoidan fractions isolated from C. costata are shown in Table 7. Fucoidan from C. costata 6F0 had the highest fucose content(62.362%) compared with the other purified fucoidan fractions. The monosaccharide compositions of fucoidans 6F1 and 6F2 were more complex than that of 6F0. The fucose and mannose contents from fucoidans 6F1 and 6F2 accounted for about half of the total polysaccharides.No significant difference was observed between the monosaccharide compositions of fucoidans 7F and 7F1.These fucoidans had high quantity of mannose and some fucose and glucose. These results indicate that fucose content decreased, while mannose content increased during algal growth. However, fucoidan content from wild C.costata showed an opposite trend of mannose content,which decreased from 18.2% to 4.8%, whereas fucose content increased from 47.5% to 61.7% (Imbs et al.,2009). It has been reported that the main components of fucoidans from S. japonica are fucose and galactose, and the monosaccharide composition is dependent on seaweed species, area, and harvest season (Guo et al., 2013).This fucoidan had higher mannose content and lowerfucose and galactose contents compared with fucoidans isolated from cultivated C. costata (Li et al., 2011) and wild C. costata (Imbs et al., 2009). Thus, fucoidans were composed of different monosaccharides, mainly including fucose, mannose, and galactose according to the results of this study and previous studies (Guo et al., 2013; Ermakova et al., 2011; Bilan et al., 2010).
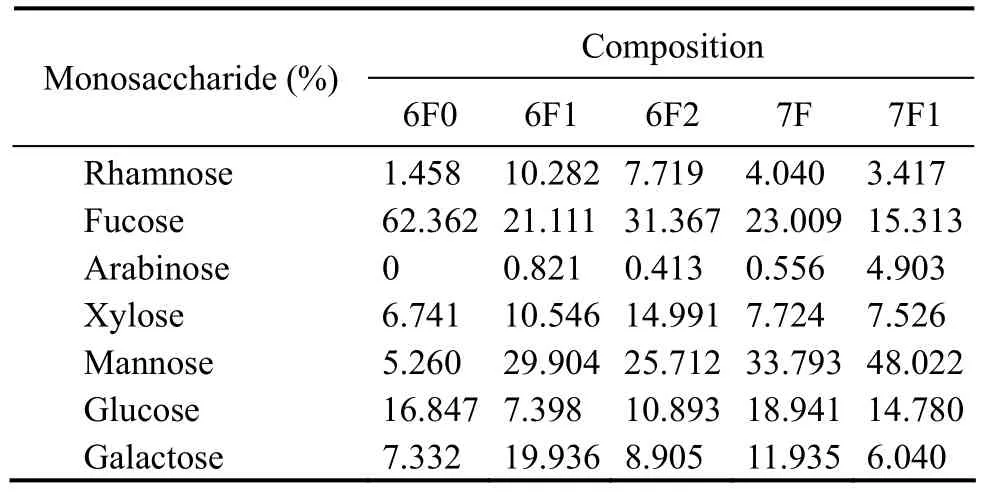
Table 7 Composition of monosaccharides in the fucoidan fractions from Costaria costata
The IR spectra of fucoidan fractions 6F1, 6F2, and 7F1 are shown in Fig.8. No obvious differences were observed among the fractions. The spectra contained major absorption bands around 3200-3500 cm-1(O-H stretching),2930 cm-1(C-H stretching), and 1613 cm-1(presence of uronic acid) (Yuguchi et al., 2016). The absorption band at 1251 cm-1was attributed to asymmetric stretching of the sulfate ester group, which is the characteristic of sulfated polysaccharides. As shown in Fig.8, the 6F1 and 6F2 fractions showed higher absorption at 1251 cm-1,whereas the 7F1 fraction showed a lower absorption. This result corresponded with the SO42-contents in 6F1, 6F2,and 7F1 (Table 6). An additional sulfate absorption band at 817 cm-1(C-O-S, secondary equatorial sulfate) and a shoulder at 855 cm-1(C-O-S, secondary axial sulfate)indicated that sulfate groups occupied positions 2 and/or 3, while only a minor part of sulfate is located at position 4 of fucopyranose residues (Imbs et al., 2016). Thus, the sulfate groups were situated at positions C-2 or C-3 of the fucopyranose residues from fractions 6F1 and 6F2, while a sulfate group was situated at C-4 position in fraction 7F1. This result demonstrates that the sulfate group positions change during the algal growth.
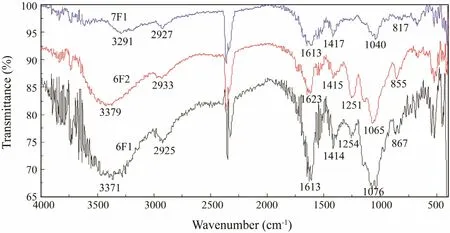
Fig.8 Fourier transform-infrared spectra of fucoidan fractions purified from Costaria costata.
4 Conclusions
This research described the detailed compositional information of alginates in C. costata, and showed the composition and properties of alginate changed during algal growth. The variations in alginate characteristics suggest the optimal C. costata harvesting time for different applications. C. costata should be harvested in May if the alginate with a higher molecular weight, higher viscosity, and a higher proportion of mannuronic acid is required. Alginate with high gel strength and medium viscosity can be isolated from C. costata harvested in June.Alginate with high quantity of guluronic acid can be obtained in July. The rheological measurements of alginate provide a theoretical basis for the application in food industry. The variations in the compositional properties of fucoidan were related to the beginning of spore set in the alga. The carbohydrate content in the alga increased by about three times when the alga matured. The highest fucoidan and alginate contents were observed in mature algae collected in June. Thus, C. costata should be collected in June to isolate the alginate with high gel strength and the fucoidan enriched in sulfated polysaccharides.
Acknowledgements
This study was supported by the Key Research and Development Program in Shandong Province (No. 2016 GSF121034), the National Science and Technology Pillar Program in the 12th Five Year Plan of China (No. 2015 BAD17B02), Open Foundation of the State Key Laboratory of Bioactive Seaweed Substances, and the Jiangsu Provincial Key R & D Project (No. BE2015335).
杂志排行
Journal of Ocean University of China的其它文章
- Effect of Different Dietary Protein and Lipid Levels on the Growth, Body Composition, and Intestinal Digestive Enzyme Activities of Juvenile Yellow Drum Nibea albiflora (Richardson)
- Establishing Gene Delivery Systems Based on Small-Sized Chitosan Nanoparticles
- Methylation Status of the Follistatin Gene at Different Development Stages of Japanese Flounder(Paralichthys olivaceus)
- Taxonomic Clarification of A Well-Known Pathogenic Scuticociliate, Miamiensis avidus Thompson &Moewus, 1964 (Ciliophora, Scuticociliatia)
- Structural Variation Analysis of Mutated Nannochloropsis oceanica Caused by Zeocin Through Genome Re-Sequencing
- A Comparative Study on Hydrodynamic Performance of Double Deflector Rectangular Cambered Otter Board
