Modelling Wave Transmission and Overtopping Based on Energy Balance Equation
2018-08-28JIQiaolingandDONGSheng
JI Qiaoling, and DONG Sheng
1) College of Transportation, Shandong University of Science and Technology, Qingdao 266590, China
2) College of Engineering, Ocean University of China, Qingdao 266100, China
(Received July 7, 2017; revised November 21, 2017; accepted December 26, 2017)
© Ocean University of China, Science Press and Springer-Verlag GmbH Germany 2018
Abstract Wave transmission and overtopping around nearshore breakwaters can have significant influence on the transmitted wave parameters, which affects wave conditions and sediment transportation and becomes the focus of design in engineering. The objective of this paper is to present a simplified model to estimate these important wave parameters. This paper describes the incorporation of wave transmission and overtopping module into a wave model for multi-directional random wave transformation based on energy balance equation with the consideration of wave shoaling, refraction, diffraction, reflection and breaking. Wen’s frequency spectrum and non-linear dispersion relation are also included in this model. The influence of wave parameters of transmitted waves through a smooth submerged breakwater has been considered in this model with an improved description of the transmitted wave spectrum of van der Meer et al. (2000) by Carevic et al. (2013). This improved wave model has been validated through available laboratory experiments. Then the verified model is applied to investigate the effect of wave transmission and overtopping on wave heights behind low-crested breakwaters in a project for nearshore area. Numerical calculations are carried out with and without consideration of the wave transmission and overtopping, and comparison of them indicates that there is a considerable difference in wave height and thus it is important to include wave transmission and overtopping in modelling nearshore wave field with the presence of low-crested breakwaters. Therefore, this model can provide a general estimate of the desired wave field parameters, which is adequate for engineers at the preliminary design stage of low-crested breakwaters.
Key words random wave transformation; energy balance equation; numerical modelling; Wen’s spectrum; diffraction; transmission; overtopping
1 Introduction
In coastal engineering design, waves are the most important dynamic environment factor. In order to investigate the reasonable layout of coastal structures and harbor facilities, it is necessary to study the wave conditions including wave height and spectrum. In the harbor design,submerged and tolerable overtopping breakwaters are getting popular in consideration of cost saving and coastal landscape. For the shielded water area behind these breakwaters, there is a demand to estimate wave conditions disturbed by wave transmission and overtopping.
Most studies of wave overtopping at coastal structures have focused on the prediction of overtopping discharge(Hu et al., 2000; Losada et al., 2008; Ingram et al., 2009;Mase et al., 2013; Altomare et al., 2016; Pillai et al.,2017). Soliman (2003), van der Meer and Bruce (2013)and Pillai et al. (2017) made a detailed review on the existing overtopping formula and found that they have been widely and successfully used in practice, although these empirical relationships are sometimes restricted to the tested range of data. These models with empirical overtopping formula, which can offer a reasonable approximation, are a reasonable compromise between the calculation accuracy and the computation time required. Recently, numerical modeling of wave transmission or overtopping has gained popularity due to increasing computer power. Based on the governing equations, two main approaches can be distinguished. The first approach considers numerical models based on the Navier-Stokes (N-S)equations and is becoming increasingly popular with the development of computer processors (Ingram et al., 2009;Yuan et al., 2015; Akbari, 2017; Wang et al., 2017). This kind of models can describe flow fields in detail providing better description of the overtopping process but with expensive computation time. The second approach considers the nonlinear shallow water (NLSW) equations (Hu et al., 2000; Tuan and Oumeraci, 2010; Suzuki et al.,2017). Since the detailed structure of the breaking wave is ignored and only depth-averaged parameters of the flow are computed, NLSW models are much less sophisticated and thus more computationally efficient. Besides, the arti-ficial neural network has also been utilized for overtopping prediction (Verhaeghe et al., 2008). However, the quality of the neural network is largely determined by the quality and quantity of the training data and it acts as a black box for the users with no explicit formulation.
In this paper, a phase-averaged model for multi- directional random wave transformation proposed by Mase et al. (Mase, 2001; Mase et al., 2005) is adopted to calculate the wave field, which is based on an energy balance equation with an energy dissipation term and a newly formulated diffraction term, referred to here as the EBED wave model. The model has been improved by introducing Wen’s frequency spectrum (Wen et al., 1988a, b, 1989a,b) which is more suitable to the coastal area of China and a non-linear wave dispersion relation (Kirby and Dalrymple, 1986) which is more reliable in shallow water areas(Ji et al., 2012). Oki et al. (2006) incorporated the wave transmission and overtopping effects into the model. Here,the effects of wave transmission and overtopping in the model are improved in terms of transmission coefficient and energy distribution parameter, which will be described in detail in the next section, followed by the validity of the model with the added module against some typical experiment results. Finally, to investigate the practical use of this improved model, it is applied to predict the wave conditions of Ai Hua yacht port in Qingdao and the effect of wave transmission and overtopping is discussed.
2 Wave Model Description
The existing EBED model is a two dimensional depthintegrated, wave phase-averaged model (Mase, 2001; Mase et al., 2005), which can compute multi-directional random wave transformation, taking account for wave shoaling, refraction/diffraction, reflection and breaking. An additional module to include the wave transmission and overtopping effect (Oki et al., 2006) has been improved and integrated into the EBED model. For the sake of the completeness, the principal governing equations, earlier implements of Wen’s frequency spectrum and non-linear property of wave propagation used in the model are given below, along with the details of implementation of the wave transmission and overtopping module.
2.1 Wave Equation and Discretization
Mase (2001) introduced a wave diffraction term into the energy balance equation of a parabolic approximation wave model in a steady state. The basic equation is expressed as follows

where (x, y) is the horizontal coordinates and θ is the wave direction measured counterclockwise from the x-axis,(vx, vy, vθ) are defined as

ω is the angular frequency, C and Cgis wave celerity and group velocity respectively, Syand Syyare respectively the first and second order derivatives of the spectral density S.The coefficient κ is a free parameter to tune the degree of wave diffraction represented by the term of

and κ = 2.0 is recommended by Mase et al. (2005) through numerical experiments. The symbol εbis the parameter of wave energy dissipation rate considering wave breaking and bottom friction, which can be expressed as

The added wave diffraction term is similar to the numerical diffusion term for they are both denoted by the second derivative. Mase (2001) used the first order upwind finite difference scheme to solve the equation. To suppress the numerical diffusion separately from the wave diffraction, a QUICK scheme (Leonard, 1979) is utilized to the second and third term on the left-hand-side equation and the central difference scheme to the wave diffraction term (Oki et al., 2004, 2006; Mase et al., 2005).More details of the discretization of the control equations and boundary conditions could be referred to in papers of Mase et al. (Mase, 2001; Mase et al., 2005).
2.2 Wen’s Spectrum and Nonlinear Property
Wen’s spectrum was derived from wave theory by Wen et al. (1988a, b, 1989a, b) in 1988-1989, suitable for both deep and shallow seas, and is used as a standard spectrum in the Code of Hydrology for Sea Harbor of PRC (China Communication Ministry, 2013). This spectrum involves a sharpness factor P and a depth factor H*, expressed in terms of significant wave height Hsand significant wave period Ts.
In deep water areas, for the water depth d satisfyingthe frequency spectrum is as following
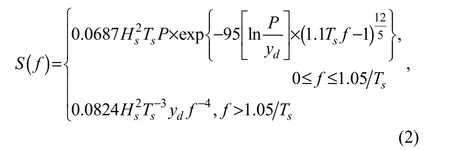
where yd
=1.522-0.245P+0.00292P2, f is the wave frequency, P is the sharpness factor defined bywith 1.54 ≤ P < 6.77.
In shallow water areas with 0.5 ≥ H*> 0.1, the frequency spectrum is expressed as
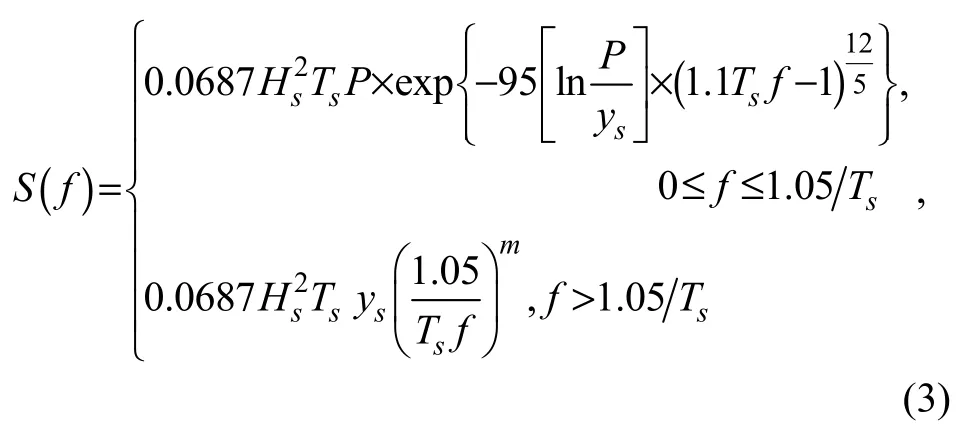
where

The nonlinear property is considered with the dispersion relation proposed by Kirby and Dalrymple (1986)

where
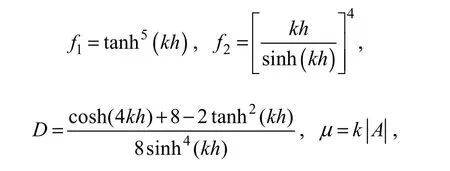
k is the wave number, h is the local water depth, |A| is the lowest order wave amplitude.
2.3 Wave Transmission and Overtopping
The mechanism of wave transmission and overtopping is complex and still under investigation. In our present study, the focus is on the estimation of the phase-averaged wave transmission and overtopping energy around low-crested structures, so it only needs to find a simplified way to estimate the wave energy behind breakwaters for design or assessment of low-crested breakwaters. The key element of the implementation is to determine the wave transmission and overtopping energy based on the wave conditions produced in the EBED model. In this module, wave transmission and overtopping energy, as a kind of transmitted energy from the seaward side to the landward side of breakwaters, is superposed to the total energy of propagation and diffraction from the open sea.Therefore, the wave energy behind breakwaters can be described as a combination of wave transmission, overtopping, propagation and diffraction energy. Furthermore,the transmission of wave energy can be modeled as a combination of wave transmission through and over the structure, which will be described respectively below.
2.3.1 Transmission through permeable structures
Considering that low-crested structures are mostly permeable (rubble mound or energy-dissipating concrete blocks), the transmission energy through permeable structures is also included in the module. Since this is not the main item of this paper, it will be treated briefly for other applications.
In the module, the transmission direction is assumed perpendicular to the axis of the breakwater as shown in Fig.1. It is believed that the transmitted waves with lower wave heights arising from penetration will propagate in a pattern similar to that of the incident waves (Goda, 1985).Thus, the transmitted wave through permeation is set as having the same spectral shape as the incident wave for simplicity, and the wave energy behind the breakwater is set as the product of the incident wave energy in front of the structure and the square of the transmission coefficient Ktpthrough permeation (Hattori, 1964; Goda, 1985).In the cell behind the breakwater, the spectral density is set as

where Ktpis the transmission coefficient through permeation, related to structure parameters and wave parameters.Some references indicate that Ktpis proportional to the steepness of the incident wave for a breakwater with energy-dissipating concrete blocks (Hattori, 1964), and about 10% to 30% for a rubble mound breakwater in shallow water (Thornton and Calhoun, 1972). (xin, yin) is the cell position where the transmission begins.
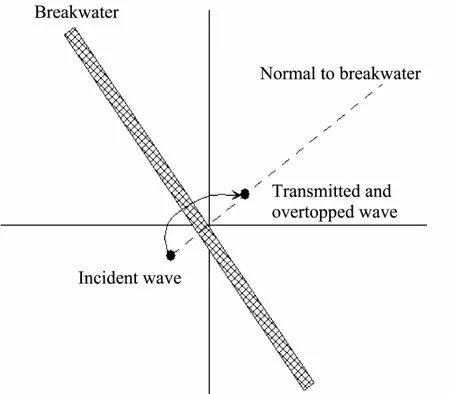
Fig.1 A sketch of direction of transmitted waves in model.
2.3.2 Transmission and overtopping over low-crested structures
Wave transmission across submerged low-crested structures and overtopping over emerged low-crested structures are called transmission and overtopping for short,whose energy is considered in this module in a simplified way. In general, the phase-averaged wave energy density by transmission and overtopping is calculated through the following empirical formula

where Ktis the coefficient of transmission and overtopping.
Furthermore, when waves propagate across the breakwater, wave breaking and nonlinear interaction between the components of the wave spectrum occur. And the nonlinear interaction between wave components causes a transfer of wave energy from lower harmonics to higher harmonics. The questions are where the transfer of energy to higher frequencies starts, how much energy is positioned on higher frequencies and in what way these energies are distributed. A series of work has been done by many researchers. Among them, van der Meer et al.(2000, 2005) proposed that 40% of transmitted spectrum energy is uniformly positioned at frequencies between 1.5fpand 3.5fp, and 60% of energy at f < 1.5fpon emerged and submerged structures based on experiments. Carevic et al. (2013) considered that the energy transferred to higher harmonics is dependent on the incident wave parameters and construction geometry, and they gave a linear approximation of the value of this fraction to improve the van der Meer et al. (2000) model. Goda et al. (1974)concluded that the impact of the fall of the overtopping water mass usually generates harmonic waves with periods of 1/2 and 1/3 the incident wave period. In the present module, the energy fraction approximation of Carevic et al. (2013) is utilized to calculate the transmission and overtopping spectrum. It distributes the transferred energy from low frequencies to high frequencies in a different way in which the double frequency components of transmitted spectrum are generated in comparison with the incident spectrum (Goda et al., 1974; Oki et al., 2006),rather than uniformly positioned at high frequencies (van der Meer et al., 2000).
For multidirectional wave, the directional distribution characteristic also varies with the transmission and overtopping process. Some references indicate that the angular spreading of the overtopped wave gets broader, yet it is not easy to describe this transformation in a simple way.So in this model, the directional distribution is considered as the same as that of the incident wave.
Hence when transmission and overtopping occurs, the spectral density at the cell back of the breakwater is set as follows

here, Stis the frequency spectrum of wave transmission and overtopping, Sinis the spectrum in front of the breakwater where transmission and overtopping starts, Ktis the coefficient of transmission and overtopping, Kris the fraction of wave energy shifted to the double frequency components from the low frequency, which is approximated with the formula by Carevic et al. (2013)

where Et1.5is the wave energy on higher frequencies f>1.5fpin the transmitted wave spectrum, Etis the total wave energy of the transmitted wave spectrum, Ei1.5is the wave energy on higher frequencies f > 1.5fpin the incident wave spectrum, Eiis the total wave energy of the incident wave spectrum, sopis the wave steepness, Rcis the crest freeboard, Hsis the incident significant wave height.
The transmission and overtopping coefficient Ktis a function of many factors related to the geometry of the structure, the wave conditions (significant wave height,wave period and wave attack angle) at the front toe of the structure, the height of the freeboard, the front slope and roughness of the structure and water depth. Many hydraulic model tests have been performed to obtain information on the coefficient Kt(Goda, 1985). Hand Book for Design of Sea Harbor (CCCC first harbor consultants Co., 2001)summarizes several empirical formulas for sloping breakwater, one of which was deduced by Yang et al. (1981) for regular wave


where Rcis the depth of submergence which is defined from the still water level to the crest of the breakwater, and B is the crest width of the breakwater, Hsis the significant wave height, L is the wave length.
This empirical formula was improved by Zou and Chen(2010) for random wave to be

Following a review of the available formulas for calculating wave transmission coefficient, the formula of Zou and Chen (2010) is selected as the determination method for supplement in the module, which can include both submerged and emerged cases. The predominant direction of the transmitted wave is also taken as the condition of the cell behind the back of the breakwater.
3 Model Verification
In order to validate the implemented model, two cases are calculated using the present model and results are compared with the experimental data.
3.1 Wave Transmission at Submerged Breakwater
To verify the feasibility of the improved module in predicting wave transmission spectrum in the EBED model, we calculated one test of the wave transmission experiment by Carevic et al. (2013). Fig.2 shows the experimental layout of the wave flume and the measured wave parameters, for more experimental details see Carevic et al. (2013). The measured wave parameters of test 2 are: 1) water depth d = 0.4 m, crest freeboard Rc= -0.055 m,submerged breakwater crest width B=0.2 m and slope m=1:2, 2) target spectrum JONSWAP g = 3.3, s1= 0.07, s2=0.09, 3) incident wave Hm0-i= 0.058 m, T0,2-i= 0.72 s, Tp-i=0.81 s, 4) transmitted wave Hm0-t= 0.041 m, T0,2-t= 0.65 s,Tp-t= 0.80 s.

Fig.2 Details of the wave flume for wave transmission experiment by Carevic et al. (2013).
In the numerical process, the computational domain is 10 m in x direction and 16 m in y direction. To avoid the boundary effect, the open sea boundary condition is taken into account at the lateral boundary and the outflow boundary, which sets the spectral density in the cell just outside the computational domain equal to that in the cell at the edge of the computational domain (Mase, 2001;Mase et al., 2005). Since the frequency spectrum is decomposed into a series of component waves of different frequencies, it is necessary to make sure that these component waves can describe the frequency spectrum accurately. There are two methods to discretize the frequency spectrum: one is by a constant interval of frequency which gives different energy in each frequency bin, and another is by making the energy in each frequency bin nearly equal, which is adopted in this model. In Mase (2001), the number of frequency component waves N = 10 or 15 was adopted. Still before the detailed numerical computation was conducted, the number of frequency component waves of the spectrum was studied to get better accuracy.In Fig.3, we computed four spectral partitions of the target JONSWAP spectrum as N = 10, 20, 30, 40, with N meaning the number of component waves. The discrepancy of the wave spectrum decreases with the number of divided component waves, especially at the spectral peak,as shown in Fig.3. The calculated wave spectra using component wave numbers of 30 and 40 match most the target theoretical spectrum. As a result, the wave spectrum is decomposed into 40 wave components for the following calculation.
In our computation using the improved model, the calculated transmitted wave height 0.40 m is slightly smaller than the measured 0.41 m, with the relative error of 2.44%.This small error is caused by the accuracy of the transmission coefficient Ktin the model, for the Ktis 0.69 in the computation model and 0.71 based on the measured data. To affirm this, we also did the calculation using the measured Ktin our model. As expected, the computed transmitted wave height is 0.41 m, being the same as the measured data.
Fig.4 shows comparisons of the calculated and measured transmitted wave spectra. The left figure (a) shows the calculated transmitted wave spectrum using the improved model with Ktcomputed by Eq. (10). We can see that the energy density at the spectral peak of the calculated spectrum is a little lower than that of the measured spectrum. The right figure (b) shows the calculated transmitted wave spectrum also using the improved model but with the measured Kt. In this figure, the spectral peaks of the calculated wave spectrum and the measured wave spectrum are almost of the same height, which also confirms our guess that the error mainly comes from the estimation of the transmission coefficient. Despite the small disagreement at the spectral peak, this error level is acceptable in practice. In Fig.4, the result of the van der Meer et al. (2000) model for the estimation of the spectral change due to wave transmission is also depicted for comparison with our model. It is obvious that the wave energy for high frequencies does not follow the constant distribution of the van der Meer et al. (2000) model, while our model appears to approximate the redistribution of the transferred energy in a good way. Thus, our model can well reproduce the shape of the transmitted wave spectrum.
To analyze the spectral change caused by energy redistribution, we also calculated the transmitted wave spectrum without considering the energy transfer from low frequencies to high frequencies, as depicted in Fig.5. In this test, the fraction of energy transfer calculated by the model is 0.05. From Fig.5, it is obvious that the spectrum density values at low frequencies (f < 1.5 Hz) become lower and values at high frequencies (f > 2.0 Hz) increase, because part of the energy at low frequencies has been transferred to high frequencies, and the total energy remains unchanged.
The above analyses shown in Figs.4 and 5 illustrate that the improved model performs reasonably well in giving appropriate estimation of transmitted wave height and spectrum behind the low-crested breakwater despite of the small difference of the spectral shape, which is acceptable for the preliminary engineering design.
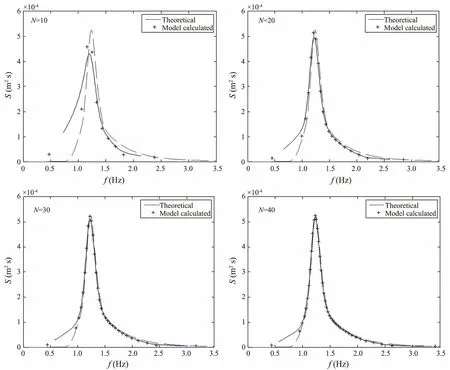
Fig.3 Division number study of the target JONSWAP spectrum: the solid line with ‘+’ marker represents the model-calculated results with different spectrum division number N, and the dashed line represents the theoretical spectrum.
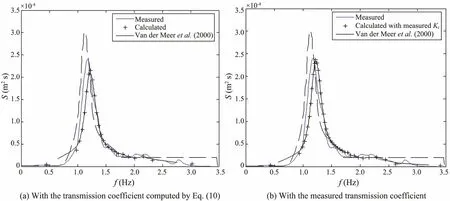
Fig.4 Calculated and measured transmitted wave spectra: the solid line represents the measured data, the solid line with‘+’ marker represents the calculated results of the present model, the dashed line represents the result of van der Meer et al. (2000) model.
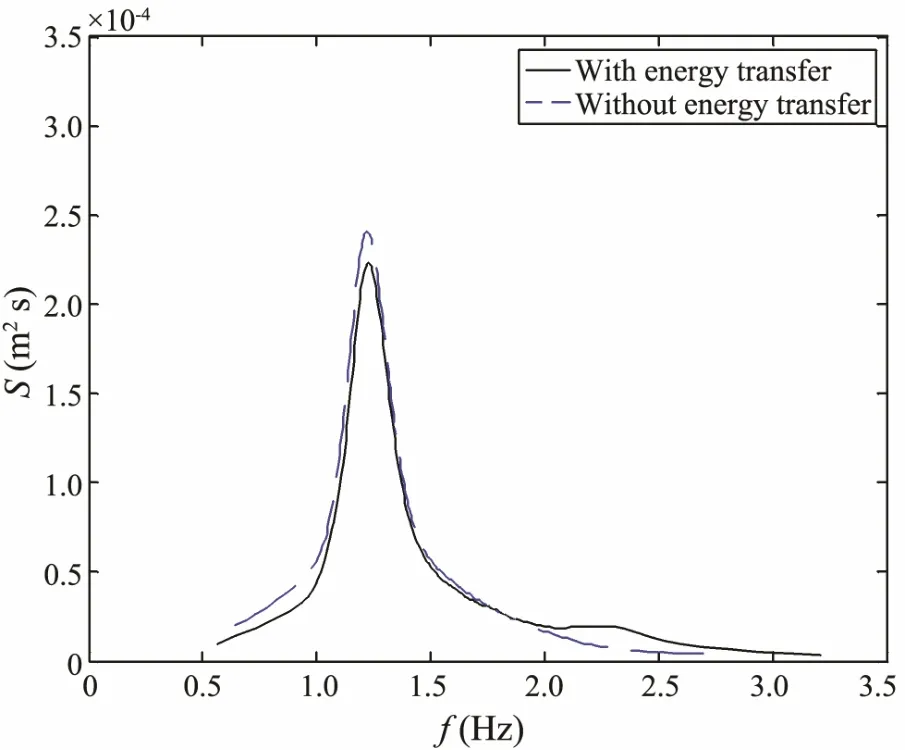
Fig.5 Comparison of transmitted spectrum with and without considering energy transfer.
3.2 Wave Transformation through a Gap Between Breakwaters
Wave transformation through a gap between breakwaters is known as a typical case of wave diffraction. In this study, the model calculation results are compared with the referential diagrams of diffraction in the Code of Hydrology for Sea Harbor of PRC (China Communication Ministry, 2013), referred to hereinafter as the CHSH diagrams, which originated from experiments and theoretical solutions. In the numerical model, the water depth is 12 m,the incident significant wave height and period is 3 m and 8s, respectively, the frequency spectrum is the shallow water form of Wen’s spectrum and the wave directional spreading function is of Longuet-Higgins type with angular spreading coefficient of N =1 and 2. The relative gap width of B/L varies from 2 to 8, where L (L=100 m) is the wavelength. The grid size is dx×dy =10×10 m, the number of component waves is 10 and the number of component angles is 36. The spectral diffraction coefficient is defined herein as the ratio of the spectral significant wave height of diffracted wave spectrum in the lee side of the breakwater to that of incident wave spectrum for all simulations.
Fig.6 shows the comparisons of the spectral diffraction coefficients calculated by the EBED model with the CHSH diagrams, where the solid lines denote the EBED wave model results and the dash lines represent the CHSH diagrams. For the narrow cases of B/L=2 for N=1 and 2,they both agree well with the CHSH diagrams on the contours of 0.5-0.8, and the calculations are considerably smaller on the contour of 0.15. For the rest contour lines,the calculations are a bit smaller: in more detail, the calculations with N=1 behave better than N=2. For the cases of B/L=4 and B/L=6, the calculations of N=1 and N=2 are almost the same as the CHSH diagrams except for the area near the breakwaters where the model tends to underestimate the diffraction coefficient. In the broad case of B/L=8, the calculations agree well with the CHSH diagrams in most regions, showing only a little underestimated results around the area behind the breakwaters.From figures in Fig.6, one can see that the agreement is not good around the tip and areas immediately behind the breakwaters for all cases, which is due to the discontinuities in the wave field induced by the breakwaters. The model predicts the diffraction coefficients well for the spectra with broad directional distributions (N=1) and broad gaps, while for narrow gaps and the spectra with narrow directional distributions the predictions are not so good. But considering the numerical diffusion may cause a small fraction of energy to penetrate in the area behind the breakwaters, the diffraction approximation added in the model acts well. From the above evidence, this implemented model appears practicable to calculate wave heights with consideration of diffraction.
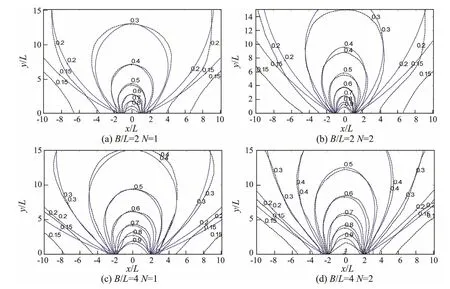
Fig.6 (a)-(d) Comparisons of the spectral diffraction coefficients by the EBED wave model calculation and the CHSH diagrams (dash line-the CHSH diagrams, solid line-the EBED wave model calculation).
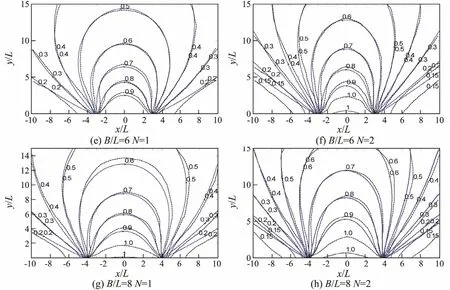
Fig.6 (e)-(h) Comparisons of the spectral diffraction coefficients by the EBED wave model calculation and the CHSH diagrams (dash line-the CHSH diagrams, solid line-the EBED wave model calculation).
4 Model Application
After the implemented model being validated against experimental data and referential diagrams presented hereinbefore, the model was applied to study the site of the Ai Hua yacht port project in Qingdao. As shown in Fig.7, the project has two layouts in the scheme design phase, where Ai and Bi (i=1-7) represent the berth numbers in the port. Two types of breakwater structure are designed for comparison and choice. One is a rubble mound on the offshore side with one layer of accropode armor with a slope of 1:1.5, being vertical in the lee side consisting of energy-dissipating concrete blocks, and with parapet on crown with a crest elevation 7.52 m. Another is a rubble mound breakwater with a slope of 1:1.5, a crest elevation 4.92 m and a crest width 4.05 m.
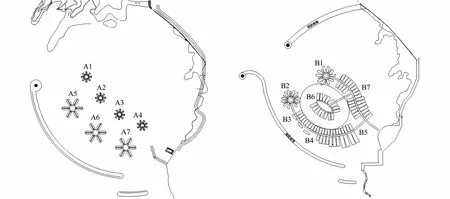
Fig.7 Layouts of Ai Hua yacht port in Qingdao.
Table 1 gives the boundary conditions of water level and incident wave characteristics for 50-year return period at the study site. Apparently, the breakwater of the second structure type will be submerged under the extreme water level of 5.32 m (Rc= -0.4 m) and thus wave transmission occurs. Wave overtopping will also happen under the design water level of 4.1 m (Rc=0.82 m).
In the numerical simulation, the input wave frequency spectrum is divided into 10 frequency bins, and the input wave directional function is divided into 36 direction bins.The computational grid size is Δx = Δy = 2.0 m. As there are no more details about the permeability of these breakwater structures, the transmission coefficient through permeation is set as 0.25 by reference to the experimental records (Hattori, 1964).
Calculations were carried out for both layouts and breakwater types under different wave and water conditions to give decision makers recommendations in respects of harbor layout and breakwater type. Here only the breakwater types are discussed on the basis of wave transmission and overtopping module switched on/off for Layout II. In this paper, the effect of two types of breakwater structure on the harbor tranquility of Layout II will be demonstrated and compared. The model applications will be carried out in two stages. First, the model is run with the wave transmission and overtopping module being fully activated. As this paper focuses on testing the effect of wave transmission and overtopping, in the second stage, the model is then run for the same conditions with the wave transmission and overtopping module switched off, so that the impact of wave transmission and overtopping can be studied in detail.

Table 1 Incident wave characteristics
Fig.8 shows the significant wave height distributions along the line 3 m distant from the lee side of the south short island breakwater (y=24 m) for Layout II under different wave and water level conditions. The solid line denotes calculation results of the second breakwater type with transmission and overtopping module switched on.The broken line represents the results of the first breakwater type with transmission and overtopping switched off. There is a remarkable difference between the cases with and without wave transmission and overtopping.Wave transmission and overtopping effect is not apparent around the breakwater tips (x = 230 m and x = 265 m), and significant in the middle area behind the short island breakwater (about x = 245 m). As for different directions,the south direction wave is affected most, for the short island breakwater is in east-west direction. In terms of water level, the transmission effect under the extreme water level shown by Fig.8(d-f) is more obvious than the overtopping effect under the design water level in Fig. 8(ac) as empirically expected.
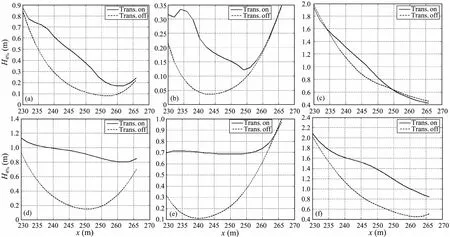
Fig.8 Significant wave height H4% distribution along the line 3 m distant from the lee side of the south short island breakwater (y = 24 m) for Layout II. (a) S/DHWL; (b) SE/DHWL; (c) SW/DHWL; (d) S/EHWL; (e) SE/EHWL; (f) SW/EHWL.
Furthermore, the effects of transmission and overtopping on the harbor tranquility at the representative berths B1-B7 for Layout II are also investigated numerically as Fig.9. The solid line denotes the calculated significant wave heights in the case of wave transmission and overtopping module activated. The broken line represents the results without transmission and overtopping effects. In these figures, the wave transmission and overtopping im-pact is not clearly discernible under the design high water level (Rc=0.82 m), as shown in Fig.9(a-c), while the wave transmission and overtopping impact is pretty noticeable under the extreme high water level (Rc= -0.4 m), as shown in Fig.9(d-f). This may be due to the fact that the overtopping wave is a high frequency wave which damps fast along propagation and the representative berths are at some distance away from the lee side of the breakwater.Another reason may be that the freeboard Rchas a great influence on the wave transmission and overtopping, that is, the rate of reduction in overtopping rate increases as the freeboard Rcincreases. Concerning direction differences, the southwest direction wave has the most influence on the harbor tranquility at the representative berths because the orientation of the main breakwater shielding the representative berths is northwest-southeast.
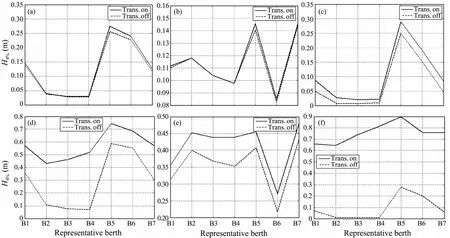
Fig.9 Significant wave height H4% at representative berth B1-B7 for Layout II. (a) S/DHWL; (b) SE/DHWL; (c) SW/DHWL; (d) S/EHWL; (e) SE/EHWL; (f) SW/EHWL.
In summary, the model results clearly reveal that the effect of wave transmission and overtopping is significant in estimating harbor tranquility, particularly in the immediate vicinity behind low-crested breakwaters. The impact of wave transmission and overtopping strongly depends on water level, incident wave conditions as well as the geometry of breakwater structures.
5 Conclusions
This paper extends an energy-balance-equation wave model for multi-directional wave transformation to introduce Wen’s frequency spectrum and to account for wave transmission and overtopping effect by using empirical formulas. The predictions by the wave model are validated by performing the calculations of wave transmission through a submerged breakwater and wave transformation through a gap between breakwaters. The comparisons with the experimental and theoretical data show good agreement.
The model has also been applied to study the field site of the Ai Hua yacht port project in Qingdao. Detailed analyses of the effect of wave transmission and overtopping on harbor tranquility are carried out at the study site by running the model with and without considering wave transmission and overtopping. The results clearly indicate that the impact of wave transmission and overtopping are significant and can alter the wave conditions around the nearshore breakwater, particularly on the lee side of the low-crested breakwater.
The wave transmission and overtopping is an important nearshore process. For predicting nearshore waves with the presence of coastal defence structures, it is essential to include the effect of wave transmission and overtopping.This paper has demonstrated a reasonable compromise approach of coupling the empirical wave transmission and overtopping formula within a multi-directional wave transformation model. Further research is being carried on to include the interaction between pontoon pier and waves.
Acknowledgements
The study was supported by the NSFC-Shandong Joint Fund Project (No. U1706226), Research Award Fund for Outstanding Young and Middle-aged Scientists of Shandong Province (No. ZR2016EEB06), and the Scientific Research Foundation of Shandong University of Science and Technology for Recruited Talents. The authors thank the anonymous reviewers for their constructive comments.
杂志排行
Journal of Ocean University of China的其它文章
- Effect of Different Dietary Protein and Lipid Levels on the Growth, Body Composition, and Intestinal Digestive Enzyme Activities of Juvenile Yellow Drum Nibea albiflora (Richardson)
- Study on Hydraulic System Efficiency of Heaving-Buoy Wave Energy Converter
- Extreme Sea Level Rise off the Northwest Coast of the South China Sea in 2012
- Spatial Distribution and Seasonal Variation of Explosive Cyclones over the North Atlantic
- The Influence of Two Kinds of El Niño Events on the Strong Tropical Cyclone Generation and Strength in the Pacific Ocean
- Sea State Bias Estimation with Least Absolute Shrinkage and Selection Operator (LASSO)
