Reconstruction Model of Ocean Observing Complex Virtual Instrument
2018-08-28QIUZhijinGUOZhongwenWANGYuHUTongLIUChaoandLITing
QIU Zhijin, GUO Zhongwen , WANG Yu, HU Tong, LIU Chao and LI Ting
1) Institute of Oceanographic Instrumentation, Qilu University of Technology (Shandong Academy of Sciences),Qingdao 266100, China
2) Department of Computer Science and Technology, College of Information Science and Engineering, Ocean University of China, Qingdao 266100, China
3) Department of Computer Science, College of Computing and Informatics, University of North Carolina at Charlotte, Charlotte 28223, USA
(Received February 27, 2017; revised December 28, 2017; accepted January 21, 2018)
© Ocean University of China, Science Press and Springer-Verlag GmbH Germany 2018
Abstract With the newly proposed Global Ocean Observing Integration, ocean observing scope has been expanded from the region to the global, therefore the need of large-scale ocean observing system integration has become more and more urgent. Currently,ocean observing systems enabled ocean sensor networks are commonly developed by different organizations using specific technologies and platforms, which brings several challenges in ocean observing instrument (OOI) access and ocean observing system seamless integration. Furthermore, the development of ocean observing systems often suffers from low efficiency due to the complex programming and debugging process. To solve these problems, a novel model, Complex Virtual Instrument (CVI) Model, is proposed.The model provides formal definitions on observing instrument description file, CVI description file, model calculation method,development model and interaction standard. In addition, this model establishes mathematical expressions of two model calculation operations, meanwhile builds the mapping relationship between observing instrument description file and CVI description file. The CVI based on the new model can achieve automatic access to different OOIs, seamless integration and communication for heterogeneous environments, and further implement standardized data access and management for the global unified ocean observing network. Throughout the development, integration and application of such CVI, the rationality and feasibility of the model have been evaluated. The results confirm that the proposed model can effectively implement heterogeneous system integration, improve development efficiency, make full usage of reusable components, reduce development cost, and enhance overall software system quality.We believe that our new model has great significance to promote the large-scale ocean observing system integration.
Key words ocean observing; complex virtual instrument; seamless integration; model calculation; development platform
1 Introduction
With the Internet of Things proposed, communication and information exchange between things by the Internet promote the integration of large-scale information system,but for the marine area, system integration is still low(Guo et al., 2012; Guo et al., 2015; Xue et al., 2015). As the sensor, network and ocean science technology develop, Ocean Sensor Web (OSW) has been applied to ecological protection, disaster prevention and mitigation,improving the ability of recognizing, managing and utilizing ocean. A typical ocean sensor network is shown in Fig.1. It’s an integrated observing network which consists of the distributed ocean environment observing systems.Each sensor deployed on the OOI in the specific marine area observes the ocean environment. Through sharing the different observing systems’ data and integrating the different scopes’ observing data, ocean sensor network offers the data-support and decision-making for researching ocean environment variation in the small, medium,even large scope. Currently, the ocean observing system,for example, Global Ocean Observing System (GOOS),Integrated Ocean Observing System (IOOS) and World Hydrological Cycle Observing System (WHYCOS) pay more attention to the ocean instrument’s development and deployment, as well as the observing data analysis(Rodda et al., 2009). They all ignore the heterogeneity of ocean observing system and lack of the unified model for processing the ocean observing data. Hence it’s hard to achieve exchanging and sharing data between the heterogeneous systems, the comprehensive research and analysis in the large-scale ocean observing data is impeded.Especially as the integration of land, ocean, space, sky and underground has been put forward, the standardization and quick integration for ocean observing system become more and more urgent.
By reason that the variety of ocean sensor network application scenarios, in order to improve the observing system’s efficiency, the concept of virtual instrument (VI)has been proposed. The VI utilizes the high-performance modular hardware and flexible software to finish the work of testing, measuring and automation application,which replaces the complicated code writing work with the graphical development tool to achieve the ocean observing system. In the area of sensor network, the typical virtual instrument development tool includes LabVIEW,AudioSCSI, LabWindows/CVI and so on. Although VI technology is easy to use and simplifies the process of development, it still has a few problems: First, it provides the functions of data display and instrument control, but it is short of the configuration and management functions of displaying panel, observing items and observing sensor information; Second, the VI can realize the data display function of a single physical instrument. However, it cannot display many related observing data on one panel.In many ocean observing situations, we need to display different kinds of related data on one panel to comparatively analyze them; Third, it is missing the function of meta data management; Fourth, the VI is developed for the dedicated system and environment, and does not provide the standard interface, which lead to the difficulty of system integration and updating in the late stage.
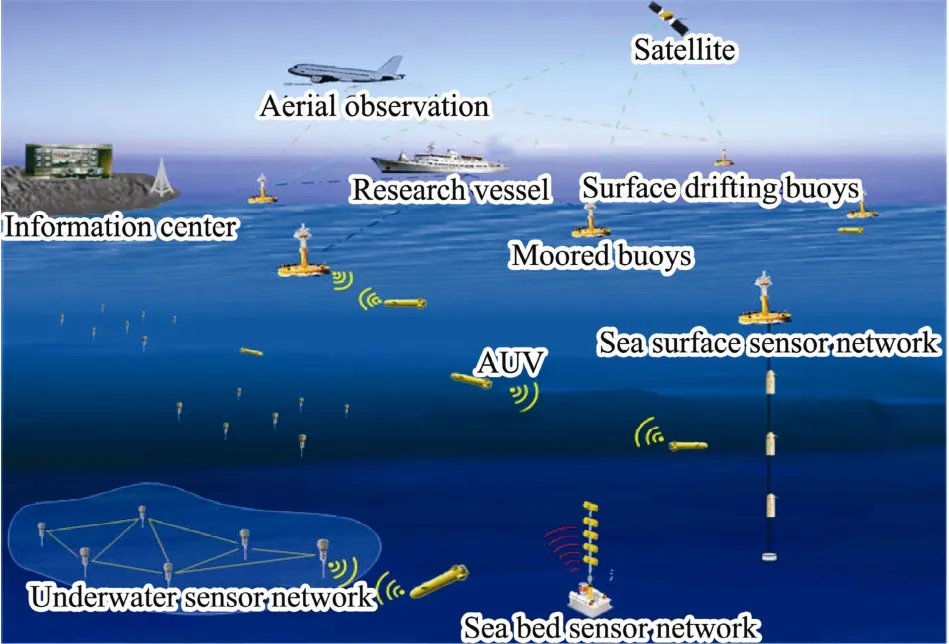
Fig.1 Typical structure for ocean sensor network.
To solve the mentioned problems, we need to propose a novel model. Massie et al. (2004), Wang et al. (2012) and David et al. (2015), according to the acquiring information architectures in different scenarios, they described the required functions and methods, providing the dedicated ocean observing system design model for the specific area. Gao et al. (2006) and Kansal et al. (2007) gave the methods to solve the data acquisition and energy problem in physical layer. Song E. et al. designed a service-oriented sensor network data interaction architecture through defining Transducer Electronic Data Sheet(TEDS) and intelligent transmitter communication protocol based on IEEE 1451 (Song et al., 2009). Ocean observing data exchange format has been described, Global Telecommunications System (GTS) uses the BUOY,SHIP and BUFR format to transmit the real-time meteorological observing data. Numerical simulation adopts Network Common Data Form (NetCDF) to exchange data and transmit the remote sensing data in Hierarchical Data Format (HDF) and GRIdded Binary (GRIB) format. The standardization of data exchange and transmission is not unified (Fiorea et al., 2013). Until recently, the author proposed the concept of Complex Virtual Instrument System, however, the architecture and application area is restricted (Guo et al., 2013; Hu et al., 2014; Qiu et al.,2016). The Open GIS Consortium (OGC) proposes to use Programmable Underwater Connector with Knowledge(PUCK) protocol to integrate the physical instruments automatically. The system uses computer to put the configuration information into PUCK model and connects the model to the physical OOIs, which can realize automatic instruments access. Although the above research results have solved lots of problems in system integration and development, this method must modify the OOI, add PUCK model and increase the cost of instrument manufacture. OGC Sensor Web Enablement (OGC SWE) makes a standard definition for discovering sensor and sensing data by network, but the discovering process costs highly(Jiang et al., 2015). So at the moment, none of them can settle comprehensively all the mentioned problem.
To solve above problems, we provide a novel CVI reference model based on the experience of IEEE 1851 (Jiang et al., 2012). The CVI is combined by a group of OOIs, provides standard external service interfaces and faces to a specific kind of application software, which can realize the functions of OOI automatic access, meta data management and large-scale data quick integration. At the same time, CVI can achieve quick ocean observing system integration through combination and connection between different types CVI, providing the data-supporting and decision-making for larger marine environment variation. The reference model is designed for ocean observing system development, which includes information acquisition, process and output as the same as the OOI, so it’s called complex virtual instrument. This paper has proposed the model definition, calculation and evaluation.But for the standardized descriptions of model architecture and interfaces have been defined in IEEE P2402 of our team which has been approved formally by the IEEE standard association and is about to be published.
2 Reference Model
2.1 Model Desgin
The CVI consists of a group of OOIs and orients a specific kind of application software. The input of CVI is the data collected by sensors. The observing data can be displayed after being processed by specific modules. The processed data can also be accessed by standard interfaces, such as Web Service, Message Queue (MQ) and File Transfer Protocol (FTP) interface. As shown in Fig.2,the CVI reference model has been abstracted into sensing layer, acquisition layer, management layer and application layer.
Sensing layer: it is the data source of CVI which util-izes many kinds of sensors to collect the simulated signal from the observing objects and transforms the simulated signal to digital one. The sensing layer includes not only physical OOIs, such as Conductivity-Temperature-Depth(CTD), Expendable BathyThermographs (XBT), Acoustic Doppler Current Profilers (ADCP), meteorograph and buoy, but also the output of other CVI’s external standard data interfaces, such as Web service, MQ and FTP.
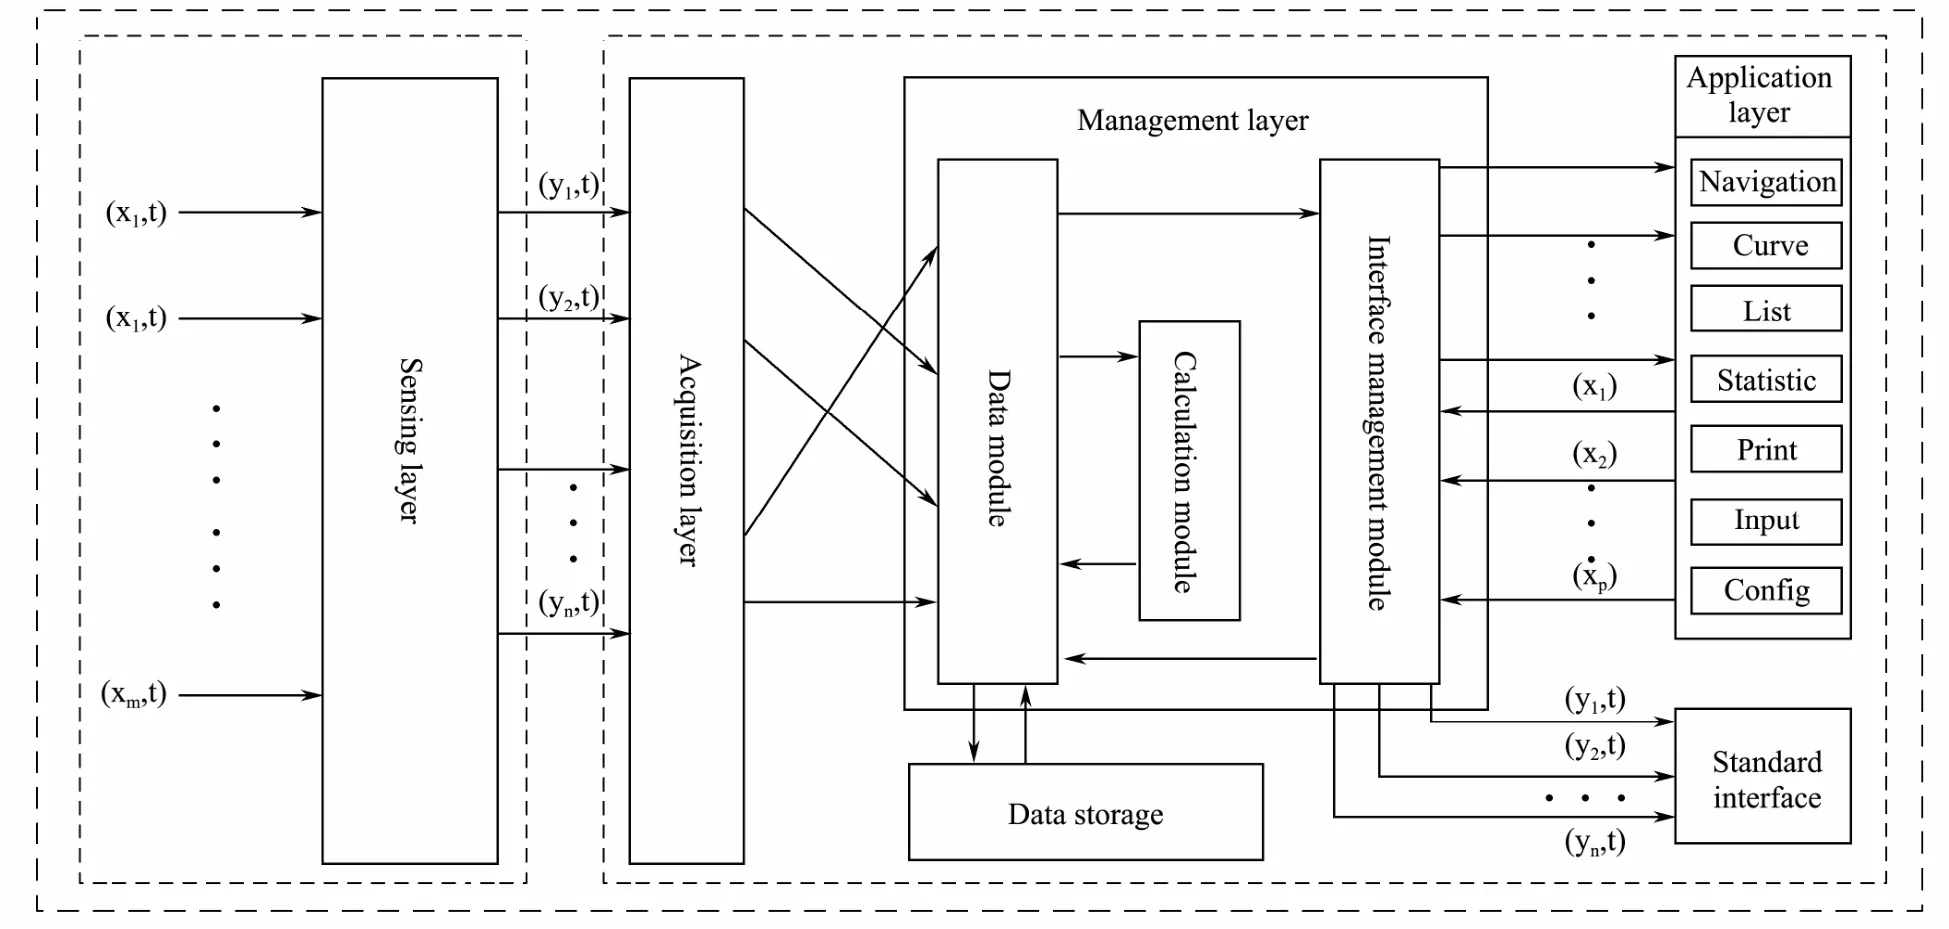
Fig.2 Reference Model of CVI.
Acquisition Layer: the acquisition layer is responsible for acquiring data. It uses the computer communication interfaces, such as RS232, RS485, Ethernet, USB and so on, to gather the sampled data, through the submarine optical fiber cable, delay tolerant network, radio, CDMA,GPRS, unmanned aerial vehicle, ships towed, satellite and other communications mode. The layer can achieve the function of automatic access to different instruments through defining the observing instrument description file and acquisitive subsystem architecture.
Management Layer: it can implement the functions of data processing, storage and publish the unified interface through loading the CVI description file. Meanwhile, it can map the relationship between the observing instrument description file and the CVI description file, which realizes the correlation between the real sensor parameter and application display parameter.
Application Layer: it provides friendly Graphical User Interface (GUI) panel, and display the data into curves,lists, rose diagram and so on. Based on loading CVI description file and designing unified GUI, it can dynamically display the ocean observing information.
2.2 Model Description
According to the reference model, we can generate different kinds of CVI based on different environments through loading different CVI description files. Through abstracting the CVI description information, the description file format is shown in Fig.3. It includes attributes,Platform and Function. The attribute stores the CVI’s number, name, function description and so on. The number is the unique identifier of one CVI.
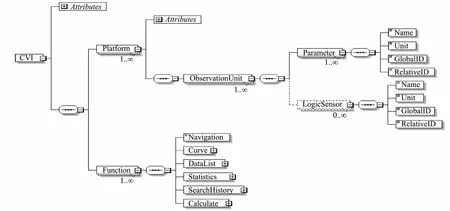
Fig.3 Format of CVI description file.
In ocean observing system, based on deployment scenarios, we group the observing objects according to platform information, the main platform contains Ship, Seabed Base, Buoy, Ocean Station, Radar, Unmanned Aerial Vehicles (UAVs) and so on. A CVI can owns multiple platforms, and a platform may include many observation units which generally refers to an OOI, for example,ADCP, XBTs, Hygrothermoscope and Anemometer. An observation unit may contains many observing parameters and logical parameters what are not the real test data,but the data produced by calculation module. The function node describes the configuration information of the function module in CVI application layer. For example,curve function’s description information includes main window information which hold sub-windows and its amount. Sub-window information includes coordinate unit and data range.
As shown in Fig.4, under different application circumstances, each CVI maps to different calculation module.Through defining the format of the description file and standardizing the calculation module interface, the CVI system realizes the function of loading different calculation module based on description file. Thereinto the logical parameters are the output of calculation module.
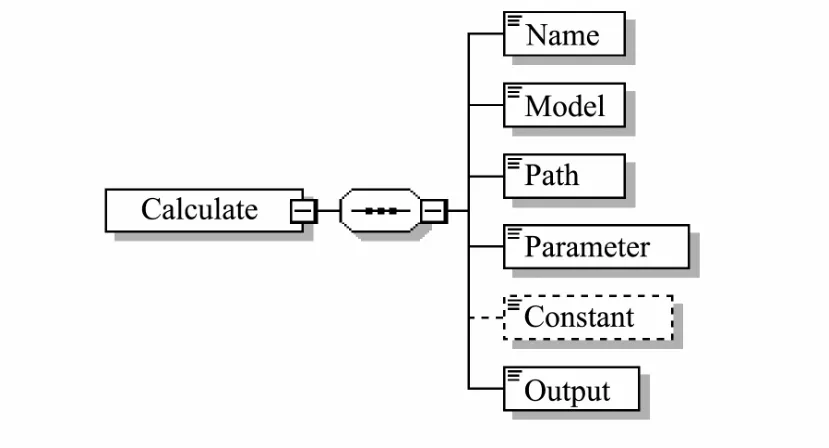
Fig.4 Schema of calculation model.
3 Layer model
Through the reference model of CVI and the definition of description format above, we can divide the model into four layers. In this section, we propose the functions and realization of each layer.
3.1 Sensing Layer
Sensing layer is the lowest layer in CVI reference model, which realizes the function of sensing by uses OOI to acquire environment information. It is the core of ocean observing network.
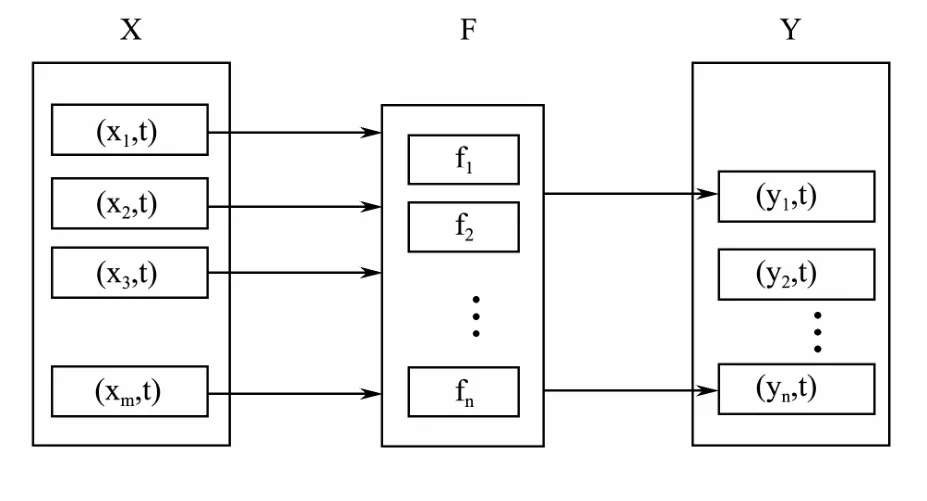
Fig.5 Structural model of OOI.
Sensing layer is composed of OOIs, whose main task is monitored such as the voice, temperature, and pressure data of observing objects and transforming the simulated signal into digital signal which can be identified by computer. The output of OOIs processing the digital signal is the real numeric value which can be read by users.
The OOI description model is shown in Fig.5.
The input of the OOI parameter model is X, that is to say, using the sensor to acquire the data from physical world. The data processing procedure can be expressed by F. The output is Y which can be understood by users.The input and output is the time serialization data related with t.
The data processing F is to transform the electrical signal into measured value. For example, in order to observe the pressure, the sensor acquires the data of voltage which related with pressure. The voltage can be transformed to the pressure by function f, the expression is shown below:

We assume the amount of input data is m, so the input data X related with t can be expressed as below:


The amount of output is n, so the output data Y related with t can be expressed as below:where, there is a situation that one output data corresponds to many input parameters. The output related with Xiis the subset of X. The OOI model can be expressed as below:

For each output yi, the expression is:

where Xi⊆ X; i = 1,2,3…n .
The sensing layer consists of many OOIs to realize the data collection work. The access procedure is called OOI model operation. The operation includes combination operation and connection operation.
The combination operation is the procedure of combining many OOIs. The instrument A and B’s combination can be expressed asA∪B. The input and output after combination can be expressed as follow:

where XA∪B=XA∪XB;FA∪B=FA∪FB; YA∪B=YA∪ YB.
There is a situation that one instrument is relies on another instrument’s output. We call this relationship as the OOI connection operation. It is an integration of the OOIs.Partial of one instrument’s output is part of another instrument’s input. The connection between instrument A and B can be expressed as A→B, the operation expression is shown below:

where YA→B= YB;FA→B= FB;XA→B= XB.
A → B expresses that A’s output is B’s input. B uses FBto process the data and obtains YB. Hence YAis the subset of XB. So do the multiple instruments.
3.2 Acquisition Layer
The acquisition layer uses communication interfaces to collect the data from the OOI based on standard protocol.Different OOIs’ interfaces have different access methods and communication protocols. Different requirements need CVI to access different OOIs. During the developing of CVI, the developer needs to rewrite the code based on different instruments. To realize the automatic instruments access and reduce the coding workload, we design an acquisition software and module in acquisition layer.Each acquisition module is mapped to an instrument.Through the standard definition of the interfaces between acquisition module and software, we realize automatic OOI access. Application layer and sensing layer can be logically separated by acquisition layer. To be convenient for different OOI access, we abstract the OOI information and standardize the format of instrument description file.When the OOI has been changed, we only need to change the description file in this layer. The system will automatically load the new module to realize OOI access.
Fig.6 shows the definition of the OOI description file.It includes the instrument attributes, interfaces, observing parameters and so on. The model node stores the information what can be read to discover and load acquisition module. The interface information contains interface type description and the data needed for different type interfaces. The observing parameter describes all kinds of instrument parameters, such as name, unit, precision and relative ID. Through the standard definition of the data interface between acquisition module and software, we can use OOI GlbID and observing parameters’ relative ID to identify observing information. The formation is shown as follow: GlbID&RelativeID,data@RelativeID,data@......
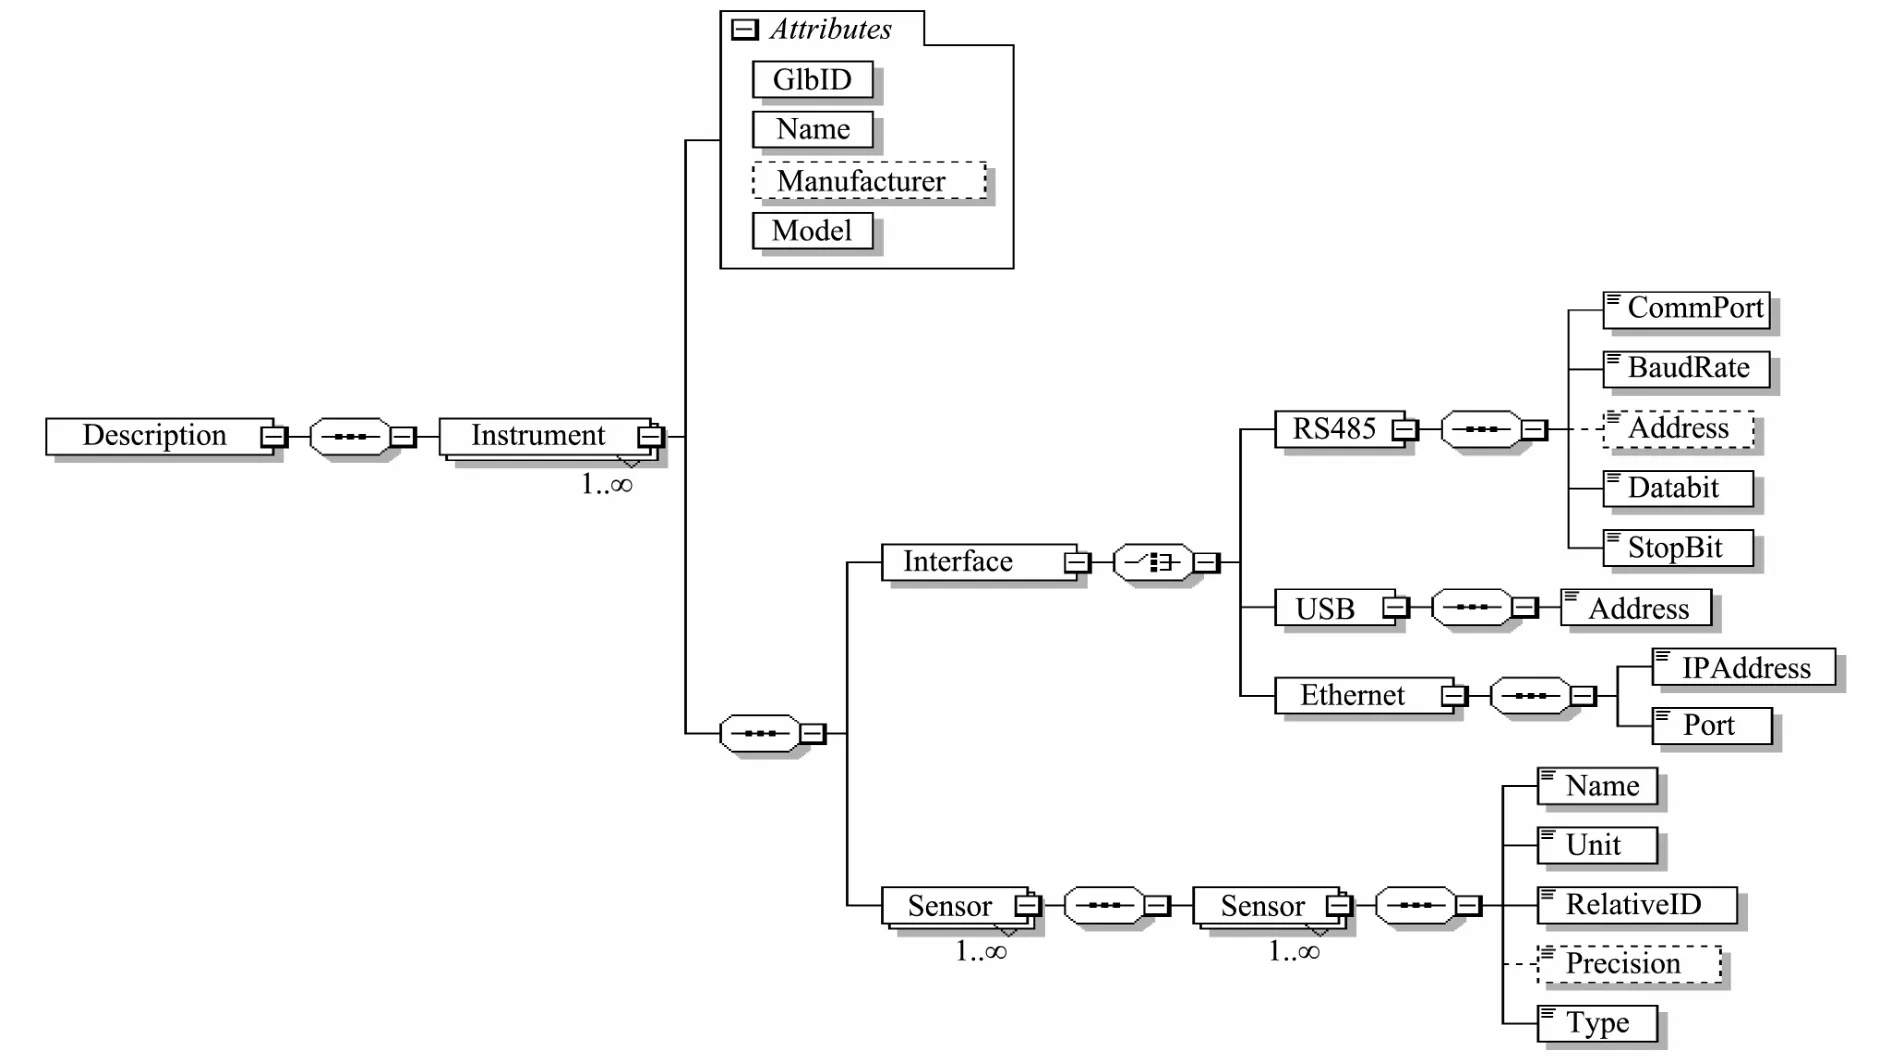
Fig.6 Format of OOI description file.
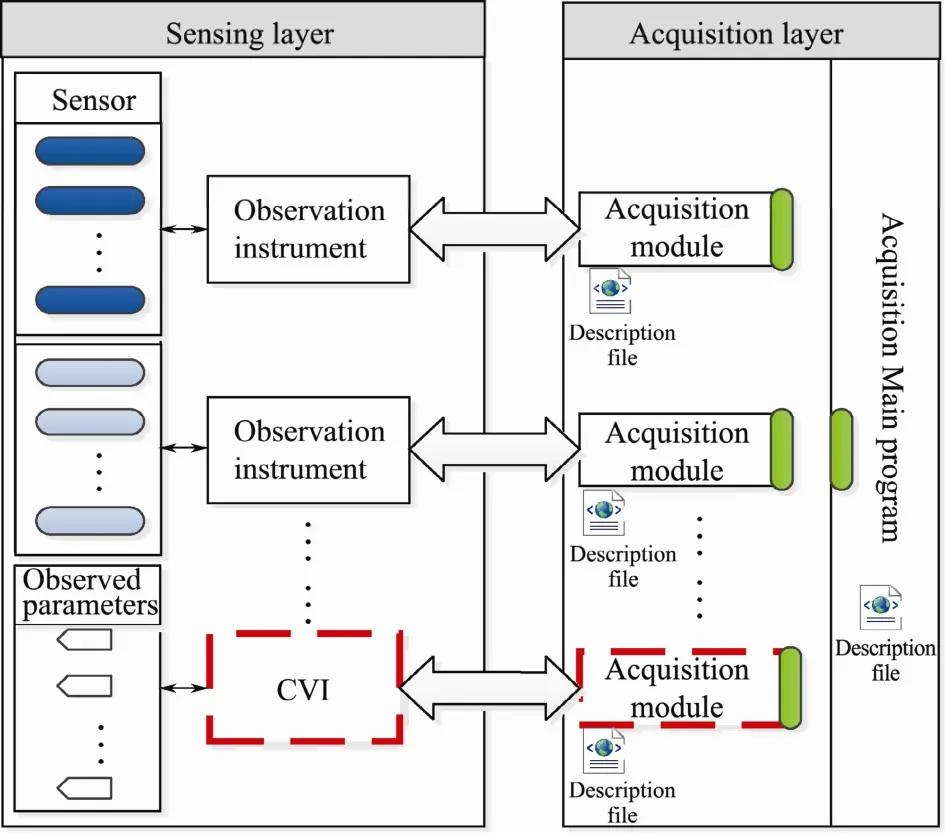
Fig.7 Architecture of data acquisition system.
Fig.7 shows the definition of acquisition system architecture. Through acquiring the observing instrument description file, the system can dynamically load the acquisition module to realize OOI automatic access. It does not need to rewrite the software. Especially, the input can be not only physical instrument but also the CVI’s output of Web service, MQ and FTP interfaces.
3.3 Management Layer
This layer is designed to process, analyze and calculate the data from acquisition layer, at the same time store the processed data into the database. We use the interface management module to output the data to application layer and provide standard Web Service, MQ and FTP interfaces in order to build the foundation of data sharing and system integration. The management layer uses Socket to communicate with acquisition layer. As shown in Fig.2, it contains data module, calculation module and interface management module.
Data module: the data module is directly connected with acquisition layer to obtain the observing data. Then data module loads the calculation module through the CVI description file, and combines with the application layer input parameters to finish the job of data calculation and processing. Based on the flexible database design structure, the module stores the data into database and then transfers the data to interface management module.As shown in Fig.8, the OOI description file should map to CVI description file. The parameter in OOI description file can be identified by instrument ID and relative ID. In CVI description file, global ID and relative ID in an observing unit can identify the observing parameter and logical parameter. So the management layer should map the instruments and the parameters to the corresponding units and parameters.
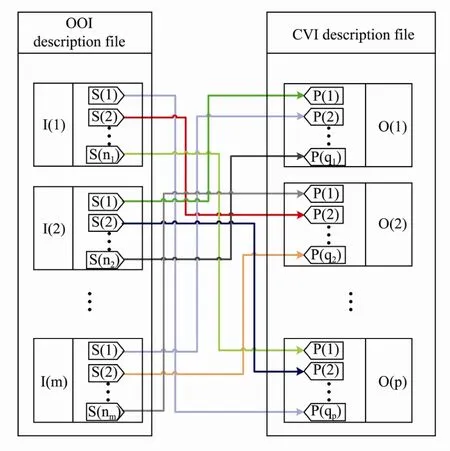
Fig.8 Relational mapping.
Calculation module: In CVI system, we need to analyze the collected data. This module is designed to calculate logical parameters. One module maps to one logical parameter. Through CVI description file, we could find related instrument parameters, constant and corresponding calculation module. By loading the module, we can calculate the logical parameters from sensor parameters based on the calculation rules. For example, when using CTD to measure the temperature, to improve the acquisition efficiency, we acquire the original voltage of the instrument, and use the voltage as the input parameter.Through input transformed parameter, calling CTD calculation module, we could gain the logical temperature parameter by calculation operation provided by this module.
Interface management module: The management layer communicates with application layer by interface management module. This module needs to provide and manage data interfaces based on application layer’s functions. It also needs to transfer the data to calculation module based on the demands of application layer. Finally,it should provide the standard data interface by Web Service, MQ and FTP interfaces.
3.4 Application Layer
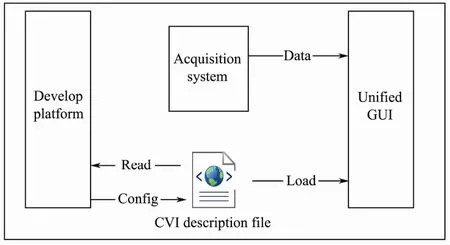
Fig.9 Operational process of unified GUI.
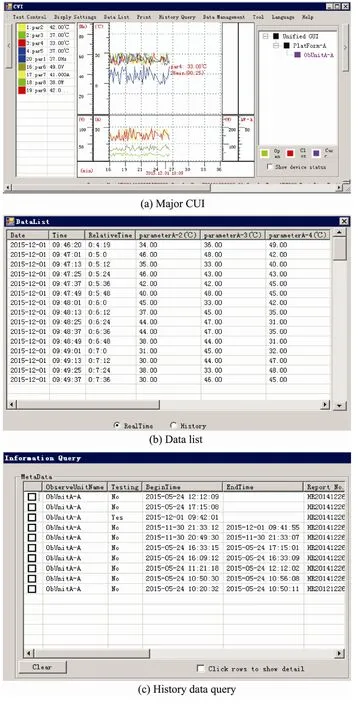
Fig.1 0 CVI uniform GUI.
Application layer is the GUI of CVI. This layer interacts with interface management module. That is, it ac-quires observing data from management module and also transfers the data to that module. Based on the CVI development experiences, the CVI system mainly contains navigation function, input data function, curve display function, rose diagram display function, data list function,statistical analysis function, print function and so on. The mentioned functions can satisfy the basic demands. If the demand of the system has changed, we can change the observing instrument and automatically access new instruments through our standard module without rewriting the source code.
To implement the mentioned functions, we develop the CVI unified GUI, which could display different kinds of OOI’s observing data on the unified panel. The unified GUI can dynamically initialize the observing platforms,observing parameters and curve window information by reading the CVI description file. As shown in Fig.9, the GUI analyzes the CVI description file, and dynamically loads the calculation module to acquire the observing data and the system information. It can form the CVI based on the file and display the data.
The GUI is shown in Fig.10. Fig.10(a) is the main panel of CVI, the top of the panel is main menu, the left is observing parameters and the right is navigation panel;Fig.10(b) is the data listing function, which can display real-time observing data; Fig.10(c) is the history data query function.
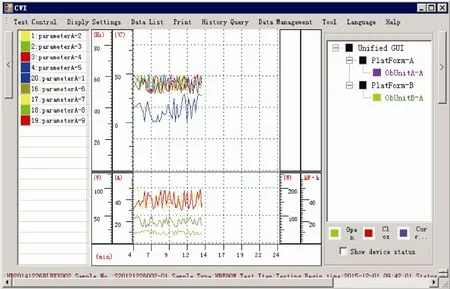
Fig.1 1 Combination of the GUI.
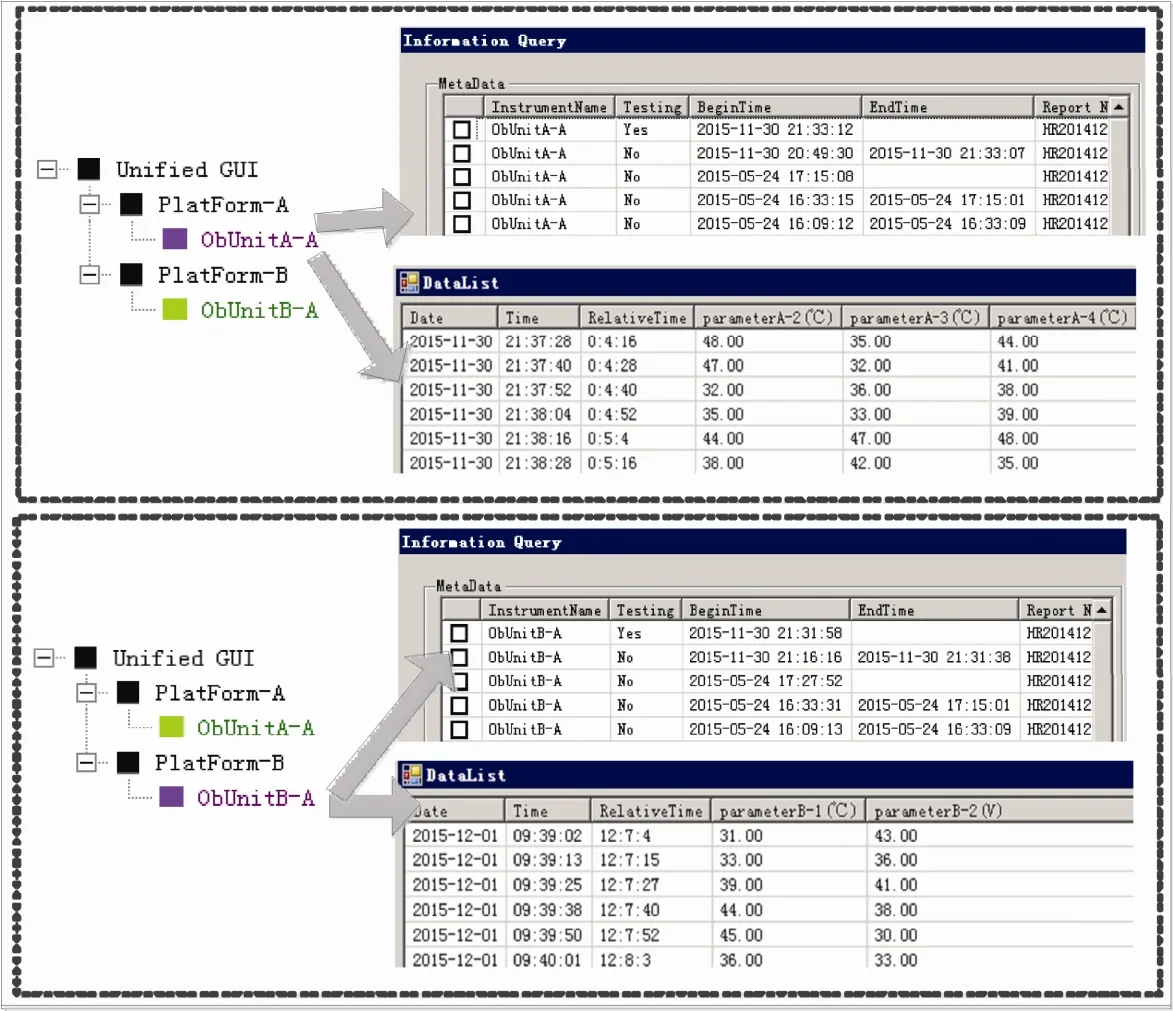
Fig.1 2 Function modules of different observing platform.
4 Model Calculation
4.1 Math Expression of the Model
The math expression provides the theoretical foundation of the CVI combination and connection. Through the definition in section 2, every CVI C includes input X,processing function F and output Y, which is similarly with OOI, the expression is shown as below:

The input information X includes m instruments’ ob-serving data, CVI’s time-serialization observing information x and the input information x’ entered by p users through application level. The processing function F includes data processing, multiple calculation modules, data storage and interface management. The output Y uses Web Service, MQ and FTP to provide standard data interfaces. The output Y has six kinds of interfaces, which includes y1(getSystemInformation), y2(ObservationPlatformInformation), y3(getInputDataInformation), y4(getObservingParameterMetaData), y5(getObservationData)and y6(getInstrumentStatusInformation).
The input of CVI is the time-serialization data and the application entered data. If we have N CVIs,the ID is numbered as i. So Ci’s input Xican be describe as follow:

The function F can be expressed as below:

Y is the interface’s output, which is as below:

The CVI model can be expressed as follow:
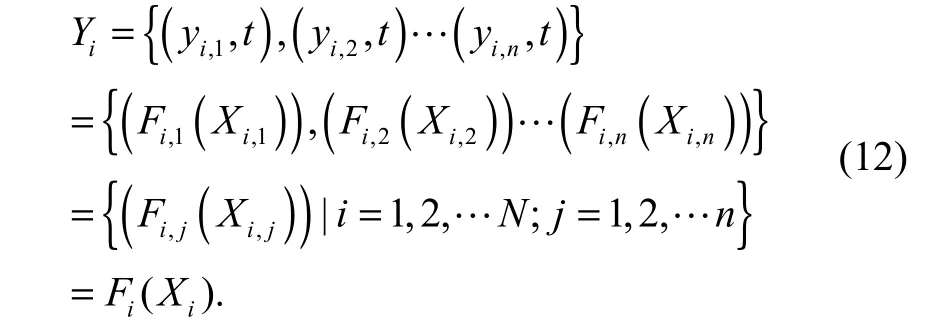
where, Xiis the subset of X, Fiis the subset of F. That is to say, Xi⊆ X; Fi⊆F,i= 1,2,…n .
4.2 Model Operation
In order to realize the integration and concatenation for different CVI’s observing data in ocean sensor network,we need to do combination operation and connection operation among multiple many CVIs.
4.2.1 CVI Combination Operation
According to the characteristics of ocean sensor network application, many ocean observing system deployed in different scenarios, to make the management work convenient, we need to integrate many heterogeneous ocean observing systems that are used in different situations. The combination operation will meet this demand.
The CVI’s combination operation is designed to integrate multiple CVIs. It takes the observing platform as the observing unit to display multiple CVI’s observing data in one unified GUI.
We assume there are N Ci, and every Cicontains Xi, Fiand Yi. The expression as below:

We combine all the CVIs, and generate new CVI Cnew. The input isXnew, function isFnew, and output is Ynew.

TheXnewis the combination of the original ones.Every CVI includes the time-serialization data input miand pinon-time-serialization input items. Because all the input data is independent, the input data is the sum of the CVIs’ input, the expression is as below:


As mentioned, the output is the collection of various CVI’s output, the output after combination operation is also independent for each CVI. The output is expressed as follow:

After the CVI’s combination operation, we can generate the new description file. The CVI loads the combined description file and displays the data on unified GUI is shown in Fig.11.
After combination, the system generates a new CVI displayed in the unified GUI. The right side is the navigation panel which could to query all the CVIs. Every observing platform has its own function module. We take the history data query and data list module as an example.As shown in Fig.12, Platform-A and Platform-B display their own history data and data lists.
4.2.2 CVI Connection Operation
During the observing procedure, some CVI’s function relies on other CVI’s output. For example, when we conduct the numerical calculation during ocean atmosphere data and ocean power environment data processing, the later one’s result relies on the former one’s. The CVI connection operation describes the cascading system relationship based on the standard model output interface.
After the operation, we generate the new CVICnew,and express this operation Cold→Cnew, the inputXnewof Cnewis the output Yoldof Cold, the expression as following:

where Xnew⊃Yold.
The new function after connection Fnewis the function of CVICnew, the expression as following:

The output Ynewof CVI Cnewis:

The connection model can be described as following:

5 Model Implementation and Evaluation
5.1 System Deployment
After defining the CVI’s model and operation, we implemented the visual development platform for the CVI to facilitate the procedure of making model description file.The platform guides the developer to develop the system by drag-drop operations and setting parameters in the friendly GUI to configure the CVI description file and deploy the system. The CVI description files, calculation modules and register center will be stored and deployed on cloud. The software developer uploads the standard reusable calculation modules and configured CVI description files to the cloud server. Then user registers on cloud server and acquires the sharing calculation module and CVI description file. The unified client sends the request to get the corresponding CVI file and calculation module. And then the generated CVI starts getting time serialization data to process and store the observing data,at the same time, it accomplishes the corresponding functions. Based on model calculation, the CVI can be combined and connected to some degree. The more complex the operation is, the lower the CVI’s efficiency will be.
5.2 Development Efficiency
There are many development methods, currently in use,such as building from ground up, modifying based on old code, and code reusing. Learning a new object-oriented programming language costs lots of time. According to our CVI model, our platform can guide the developer to finish the development procedures step by step through the dialogs without writing the code. All the procedures are displayed on panels. The result shows that our platform improves the development efficiency and reduces the cost.
Take ocean environment observing system as an example, for instance. During the procedure of developing,testing and maintaining, our platform shows lots of advantages. We compare our development platform with three other methods, in terms of the following aspects:Coding, Modification and Component Reusing.
Coding: use developing tools to write code directly;Modification: according to different requirements to modify the original system; Component Reusing: assemble the developed components, just need to write a little code; CVI development platform: guide the developer to configure the system through the interacting GUI. In our test, based on the principles of software engineering knowledge (Harman et al., 2012; Lami et al., 2012; Dick et al., 2013; Metzger et al., 2014), for the same requirements and the developer’s ability alike, we compare the software developing life cycle of different developing methods. Fig.13 shows the development efficiency of the four methods. At the beginning, it takes lots of time to develop our CVI platform. However, as the number of the developed systems grows, our platform’s efficiency is much higher than others.
After finishing the development of CVI platform,Fig.14 shows the developing, testing, maintaining efficiency of our platform are also ten times higher than that of others.
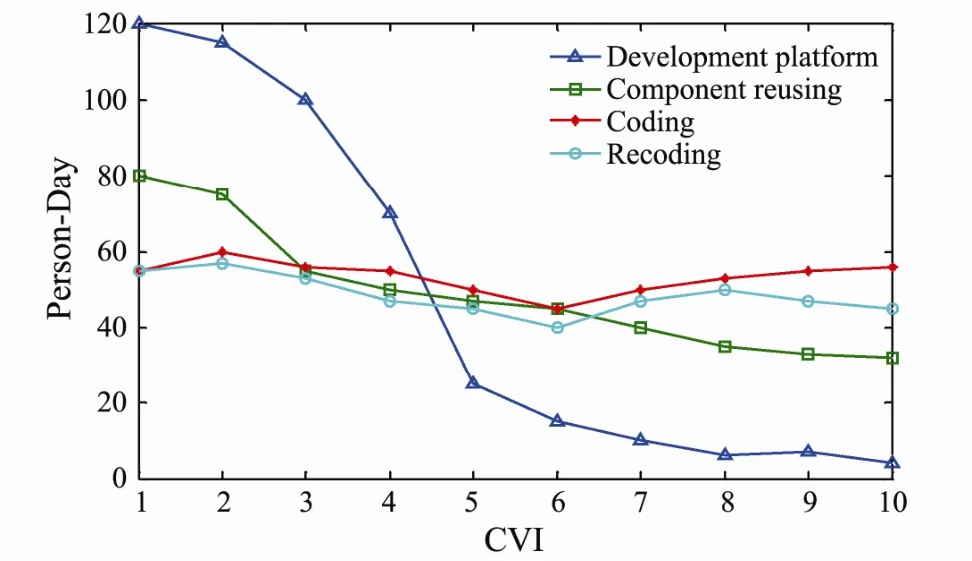
Fig.1 3 Development efficiency of the four methods.
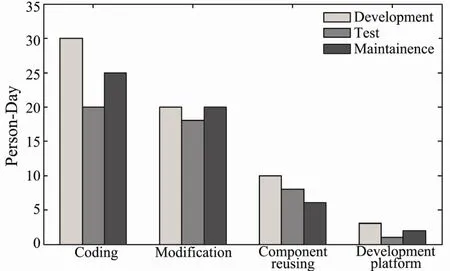
Fig.1 4 Comparison of development efficiency.
5.3 Performance
Through model operation, we can integrate different CVIs. The more CVIs are integrated, the lower the system efficiency will be. The latency of the data display will affect the user experience directly, because the long time it takes from requesting to receiving and displaying data.We test the response time under different CVI integration levels and different amount data.
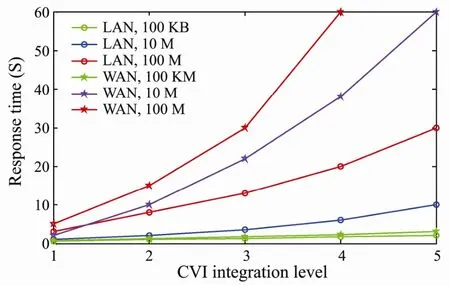
Fig.1 5 Analysis of CVI’s integrated performance.
LAN and WAN are used to transfer the data in the observing data transmission network. The CVI integration level changes from one to five. The data size is 100 KB,10 M and 100 M. All the processors are the same. The result is shown in Fig.15.
The x axis is the CVI integration level, y axis is the response time in this level. It demonstrates that, no matter what transmission method is used, the response time always grows as the integration level becomes higher. And the rate of increase becomes bigger. Meanwhile, in the low level of CVI integration and less requested data, the response time of the data transmission and process is nearly the same. However, as the CVI integration level grows, for less requested data, the response time increases not apparently, but when large amount of data is requested, the required time is also increasing obviously,which means it needs high quality network. So the LAN is more efficient than the WAN. When CVI integration to four level, to process 100 M data, the response time for data transmission and process is longer than one minute.With the CVI integration level growing, due to the multiple data and information transfers, the CVI system performance will be deteriorate. So we suggest not integrating too many CVIs.
5.4 Case study
In order to evaluated CVI model in the system integration, we use the platform to develop an ocean observing system in short time and verify the rationality of CVI model and its operations. The verification of ocean observing system includes two marine environment observation. Each OOI is connected with ocean observing system by the high-speed network, the acquisition system provides the time-serialization data every 30 seconds to ocean observing system. Every marine observation condition is shown in Table 1. Marine A includes 6 observation platforms, respectively 2 bottom-supported platforms and 4 GPS measure wave buoys. Among them, OOIs on the bottomed-support platform contains 1 ADCP and 1 CTD.An ADCP instrument includes 7 parameters, such as temperature, roll, pitch, velocity and so on. A CTD contains temperature, depth, conductivity and salinity. Each GPS measure wave buoys platform consists of a GPS measure wave buoy instrument, which includes 9 parameters, wave direction, effective wave height, significant wave cycle and so on. According to the large data transmission characteristic of ADCP, we adopt FTP to acquire data, the rest of the instruments use serial to communicate. Marine B includes 2 observation platforms,respectively 1 hydro-meteorological station platform and 1 wave rider buoy. Among them, OOIs on the hydro-meteorological station platform contains 1 anemometer and 1 hygrometer.
Based on CVI model definition, C1corresponding tomarine A includes input X1, function F1and output Y1. C1requires user inputting 4 non-time serialization parameters, including observation number, observation purposes,observation unit and observer. Therefore, the input parameters contain 58 time-serial observation parameters and four user’s input parameters, the input X1of C1is:

Table 1 Laboratory conditions

According to the observing requirements of marine A,it includes 7 function models, respectively, curve f11, data list f12, vertical cross-section f13, parameter correlation f14,rose diagram f15, data download f16and historical data query f17. The function F1of C1, based on CVI model description is:

whereq=7.
The output of C1includes six kinds of output interfaces.So according to CVI model, the output of Y1is:

wheren=6.
Similarly, the input X2of C2corresponding to marine B,the function F2and the output Y2are respectively as below:

where m= 16, p= 4.

whereq=5.

wheren=6.
According to the model combination operation, two marine observing systems are integrated into one. Then it will process and analyze the observing data in the unified GUI. Model combination operation combines two CVI description files into a new one. The GUI generates a new CVI Cnewthrough loading the new CVI description file,that is:

The input is the union set of marine A and B after combination, including two ADCPs, two CTDs, five buoys,one anemometer and one hygrothermoscope. The combination operation of model’s input is:
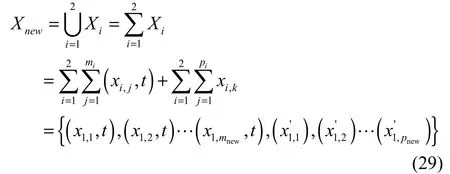
where m1= 58,p1= 4,m2= 16,p2= 4,mnew= 74,pnew= 8.
The combination operation of model’s function Fnewis:

The combination operation of model’s output Ynewis:

wherejnew=12.
The comparison of the GUI before and after combination is shown in Fig.16.
Meanwhile, the ocean forecast system (OFS) uses the model connection operation to connect the ocean meteorology forecast system (OMFS) and ocean dynamic forecast system (ODFS) to realize the prediction of them. The prediction results recorded in NetCDF format are transmitted by FTP interface from OMFS to ODFS to realize dynamic forecast of ocean. The input of OFS through the model connection operation is the real-time data of the OOIs and the output from OMFS and ODFS. And OFS realizes the visual display of the observing data and the prediction results on the unified GUI.
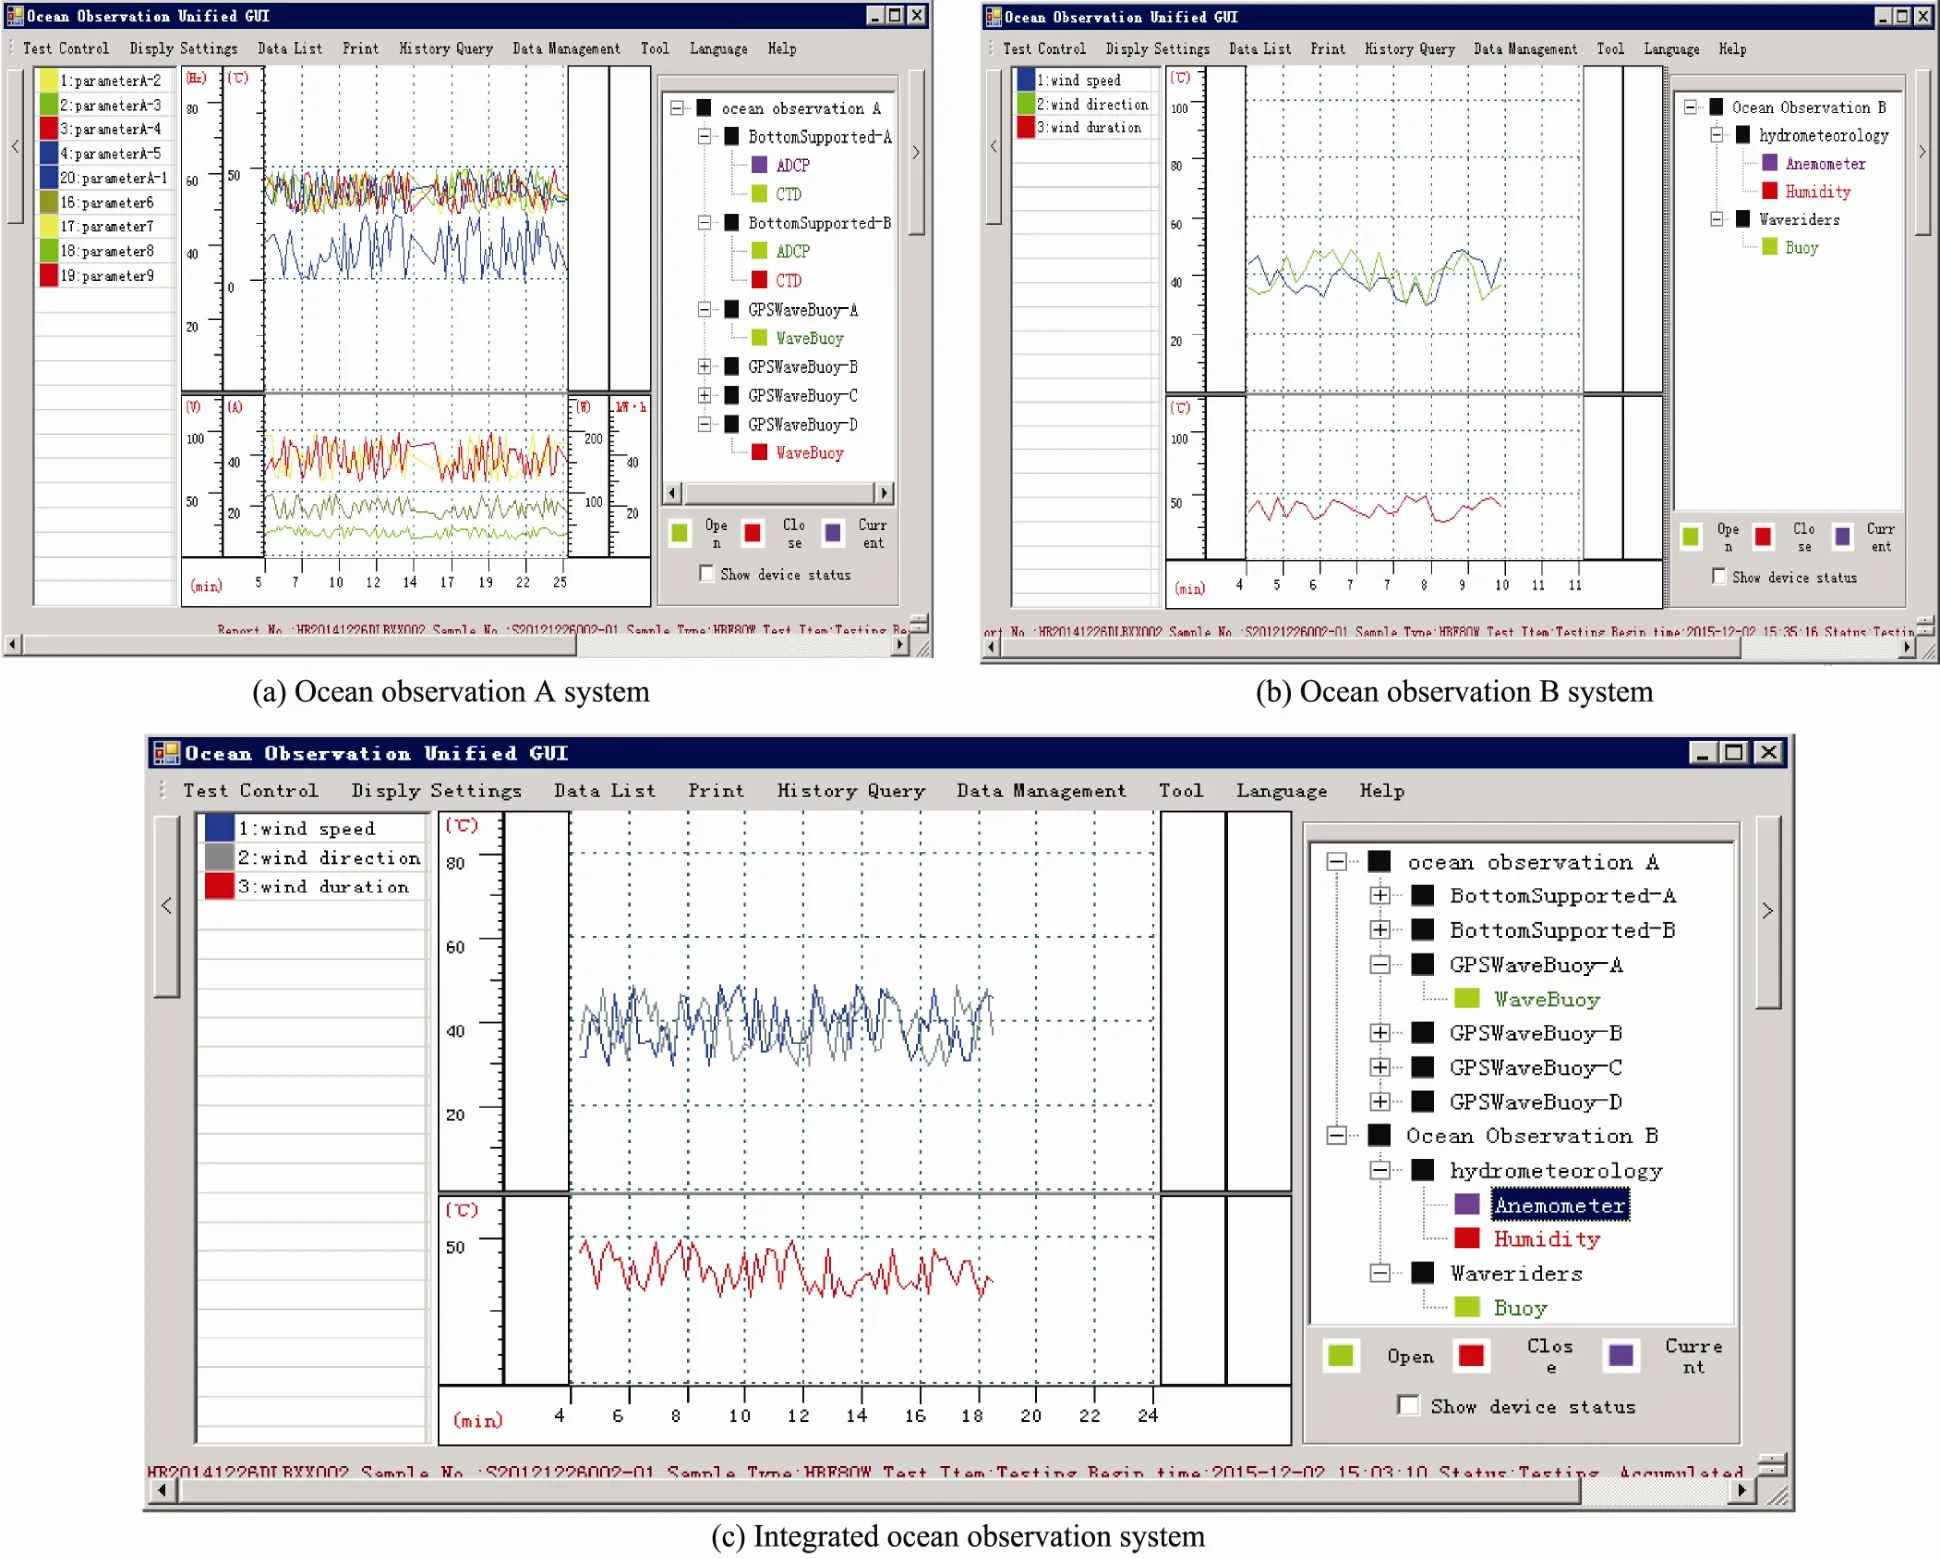
Fig.1 6 The GUI before and after combination.
Through the development and application of CVI in the above two scenarios, we draw the conclusion that CVI model is feasible and reasonable.
6 Conclusions
In this paper, we propose a novel CVI model, which realizes the functions of the different OOIs automatic access. It makes the process of heterogeneous CVI system integration easier and improve development efficiency.As defining the model calculations, we achieve the integration of different CVIs. We use the ocean environment observing system and ocean forecast system as prototypes to valid our model. The result shows that our model can implement the functions of automatic access and seamless integration, and improves the developing and acquisition efficiency. We test the performance of model and give the conclusion of the response time to different CVI integration levels. Our contributions are as follows:
1) Through proposing the system reference model, we define the standard format of description file and the data interface to realize the automatic access function for different OOIs and metadata management.
2) Through defining the combination and connection operations, we use these two operations to integrate heterogeneous observing systems in one unified GUI.
3) Through developing the platform, we can quickly develop a new CVI system without writing code and code can be reused.
Our future work will focus on data security transmission. Meanwhile, we will extend our CVI model to more common areas and do the further research and evaluation.
Acknowledgments
The study is supported by the National Natural Science Foundation of China (Nos. 41606112, 61103196, 61379 127, 61379128), the National High Technology Research and Development Program 863 (No. 2013AA09A506).
杂志排行
Journal of Ocean University of China的其它文章
- Effect of Different Dietary Protein and Lipid Levels on the Growth, Body Composition, and Intestinal Digestive Enzyme Activities of Juvenile Yellow Drum Nibea albiflora (Richardson)
- Modelling Wave Transmission and Overtopping Based on Energy Balance Equation
- Extreme Sea Level Rise off the Northwest Coast of the South China Sea in 2012
- Spatial Distribution and Seasonal Variation of Explosive Cyclones over the North Atlantic
- The Influence of Two Kinds of El Niño Events on the Strong Tropical Cyclone Generation and Strength in the Pacific Ocean
- Sea State Bias Estimation with Least Absolute Shrinkage and Selection Operator (LASSO)
