Tropical Cyclone Tilts Under Vertically Varying Background Flows: Preliminary Results Based upon TCM4 Simulations
2018-08-28ZHENGQikangandLIQingqing
ZHENG Qikang, and LI Qingqing
1) Foshan Meteorological Service, Foshan 528000, China
2) Pacific Typhoon Research Center, Key Laboratory of Meteorological Disaster of the Ministry of Education,Nanjing University of Information Science and Technology, Nanjing 210044, China
3) State Key Laboratory of Severe Weather, Chinese Academy of Meteorological Sciences, Beijing 100081, China
(Received February 7, 2017; revised May 10, 2017; accepted November 8, 2017)
© Ocean University of China, Science Press and Springer-Verlag GmbH Germany 2018
Abstract The characteristics of tropical cyclone (TC) tilts under vertically varying background flows were preliminarily examined in this study based on numerical simulations with the Tropical Cyclone Model version 4 (TCM4). The tilt magnitudes presented a linearly decreasing tendency in the simulation with the environmental wind speed vertically varying throughout the troposphere and in the simulation with the vertical wind shear concentrated in the lower troposphere, while the vortex tilt showed a linearly increasing tendency in magnitude in the simulation where the vertical shear was concentrated in the upper troposphere. The change in tilt magnitude was found to be related to the evolution of the penetration depth near the eyewall. When the shear was concentrated in the lower troposphere, the vortex tended to tilt downshear right during the early integration and underwent more precession processes.When the shear was concentrated in the upper troposphere, the vortex rapidly tilted downshear left during the early simulation and vortex precession was less frequently observed. The storms simulated in all experiments were finally in downshear-left tilt equilibrium.
Key words tropical cyclone; tilt; vertical wind shear; penetration depth
1 Introduction
Vertical wind shear has been realized to have important effect on tropical cyclone (TC) structure and intensity change. Moderate-to-strong shear tends to produce convective asymmetries in the inner core (Jones, 1995; Wang and Holland, 1996; Bender, 1997; Frank and Ritchie,2001; Black et al., 2002; Rogers et al., 2003; Chan et al.,2004; Wu and Braun, 2004; Heymsfield et al., 2006; Li et al., 2008; Xu and Wang, 2013; Reasor et al., 2013;Barnes and Barnes, 2014; DeHart et al., 2014; Li et al.,2017), with the convective maximum prevailing downshear-left of the wind shear vector. Several mechanisms have been proposed to account for the presence of such an asymmetry. One is a balanced response of the tilting vortex, which leads to updrafts downtilt (Jones,1995; Wang and Holland, 1996; Frank and Ritchie, 1999).A second me- chanism is the adiabatic motion of the vortex cyclonic flow along the tilted isentropic surface in response to temperature anomalies required for the thermal wind balance of the tilted vortex. After the first mechanism takes effect, the upward motion shifts 90˚ to the right of the tilt direction (Jones, 1995). The third mechanism derives from storm-relative flow (Willoughby et al., 1984; Wang and Holland, 1996; Bender, 1997;Frank and Ritchie, 2001). Specifically, vertical shear imposes opposite flow patterns onto the storm at the lower and upper levels: On the downshear (upshear) side, relative flow is radially inward at the lower (upper) levels and radially outward in the upper (lower) levels. Because of the strong radial vorticity gradient, this vorticity advection by the relative flow is approximately balanced by vortex stretching, leading to upward motion downshear and downward motion upshear. More recently, Xu and Wang (2013) addressed the initial development of asymmetric convection in the inner-core for a TC embedded in vertical shear. They pointed out that the TC eyewall acted as a vessel in vertical shear, and convergence and downdrafts arise along the outer edge of the eyewall upshear while divergence and updrafts develop downshear shortly after the vertical shear was imposed.
As mentioned above, one of important roles of vertical shear in TC structure changes is to vertically tilt the vortex, which is generally identified by the displacement of the storm center in an upper layer from the center in a lower layer. Jones (1995) indicated that vortex tilt could project onto vortex Rossby waves and the tilt axis could rotate around the vortex (namely make precession) toward the left side of shear. After approximately 180 degrees of precession, the upper vortex tended to realign.Two mechanisms have been proposed in Reasor et al.(2004) for vortex realignment. Outside the radius of maximum wind, sheared vortex Rossby waves were differentially advected by the radially shearing mean flow, in the shape of spiraled potential vorticity (PV). PV filamentation quickly decreased the tilt amplitude as the waves moved outward. This mechanism for reducing vortex tilt was called ‘spiral windup’. The second mechanism was related to the superposition of adjacent vortex Rossby wave eigenmodes (called ‘quasi mode’). The quasi mode’s components had resonation between the center or an inner Rossby wave turning point and an outer critical radius where the frequency of the precessing vortex Rossby waves matched the orbital period of the mean flow. The quasi mode is a superposition of radially trapped waves (eigenmodes) that may either lose energy through absorption at the critical radius or obtain energy by overreflection at the critical radius. This circumstance is termed ‘critical layer mixing’ or ‘PV stirring’ and acts as the second mechanism for assisting vortices to resist to shear. Jones et al. (2009) investigated the different tilt evolution of initially tilted vortices on f and β planes.They found that, on an f plane, the vortex tilt precesses slowly because the critical radius, where the phase velocity of the tilt-projected vortex Rossby waves matches the mean swirling flow, is far from the storm center. On a β plane, the nonlinear β effect may diminish the ability of the vortex to recover from initial tilt. Schecter (2015)compared the tilt dynamics of a vortex in different idealized experiments, indicating a much stronger tilt mode in the dry nonconvective vortex than in the moist convective TC. He also found that a decrease in static stability is sufficient to check the excitation of a tilt mode, and the symmetric secondary circulation has a nonnegligible influence on reducing tilt.
In real atmosphere, a TC may encounter complicated ambient environments. For example, a storm may be embedded in vertically varying background flows, which implies the associated wind shear has varying vertical structures. Vertically varying background flows may lead to different TC structure and intensity changes. Shu et al.(2013) showed that the vertical shear in the lower troposphere between 850 hPa and 10-m height is more important to TC intensification than the commonly used shear between 200 and 850 hPa. Wang et al. (2015) revealed that there is a stronger negative correlation of the lowlevel shear between 700 (or 850) and 1000 hPa and the 24-h lagged TC intensity change. In the present study, we will preliminarily examine how the vortex tilts evolve in shear with vertically varying environmental flows using a fully compressible, nonhydrostatic model. The rest of this article is organized as follows. Section 2 describes the configurations of the numerical experiments. Section 3 presents the preliminary results of the experiments. The main findings are summarized in Section 4.
2 Model Setup and Experimental Design
The numerical model used here is the fully compressible, nonhydrostatic, cloud-resolving Tropical Cyclone Model version 4 (TCM4). The model assumes a flat lower boundary at the ocean surface with a uniform unperturbed surface pressure of 1010 hPa. The model physics include an E-ε turbulence closure scheme for subgrid scale vertical turbulent mixing (Langland and Liou, 1996);a modified Monin-Obukhov scheme for surface flux calculations (Fairall et al., 2003); an explicit treatment of mixed-phase cloud microphysics (Wang, 2001); a nonlinear fourth-order horizontal diffusion for all prognostic variables except for those related to the mass conservation equation; and a simple Newtonian cooling term added to the perturbation potential temperature equation to roughly account for the longwave radiative cooling(Rotunno and Emanuel, 1987). The details of TCM4 were introduced in Wang (2007).
The model domain is quadruply nested grids spanning 624, 927, 2268, and 12960 km in the east-west and northsouth directions, with the corresponding horizontal grid spacings of 2, 6, 18, and 54 km. The model has 32 levels in vertical. No cumulus parameterization is employed,even in the two outermost meshes since convection occurs mainly within 250 km of the storm center. The fields are initialized with an axisymmetric cyclonic vortex on an f-plane at 18˚N over ocean with a fixed sea surface temperature (SST) of 29℃. The initial vortex has a maximum tangential wind speed of 20 m s-1at the 90-km radius near the surface and decreases sinusoidally with pressure to vanish at 100 hPa. The reference state of the atmosphere is defined as the moist-tropical sounding of Dunion(2011).
In this study, an environment with a moderate easterly shear of 10 m s-1was introduced after 60 h when the vortex was well spun up. In the first experiment (hereafter SH), the background zonal wind speed increased from 0 m s-1at about z = 1.5 km to 10 m s-1at about z = 14 km with a bellramp function with height, showing that the change of environmental wind velocity was relatively slow in vertical throughout the troposphere (Fig.1a). The background zonal wind speed increased from 0 m s-1at about z= 1.5 km to 10 m s-1at about z = 5 km in the second experiment (hereafter SH_L), showing a sharp change of environmental wind velocity in the lower troposphere(Fig.1a). In contrast, the background zonal wind speed increased from 0 m s-1at about z = 7.5 km to 10 m s-1at about z = 14 km in the third experiment (hereafter SH_U),implying a rapid change of environmental wind velocity in the upper troposphere (Fig.1c). We have examined the shear in the coarser meshes and found that the vertical wind shear has been nearly maintained throughout the integrations.
3 Results
3.1 Intensity and Structures of the Modeled Storms
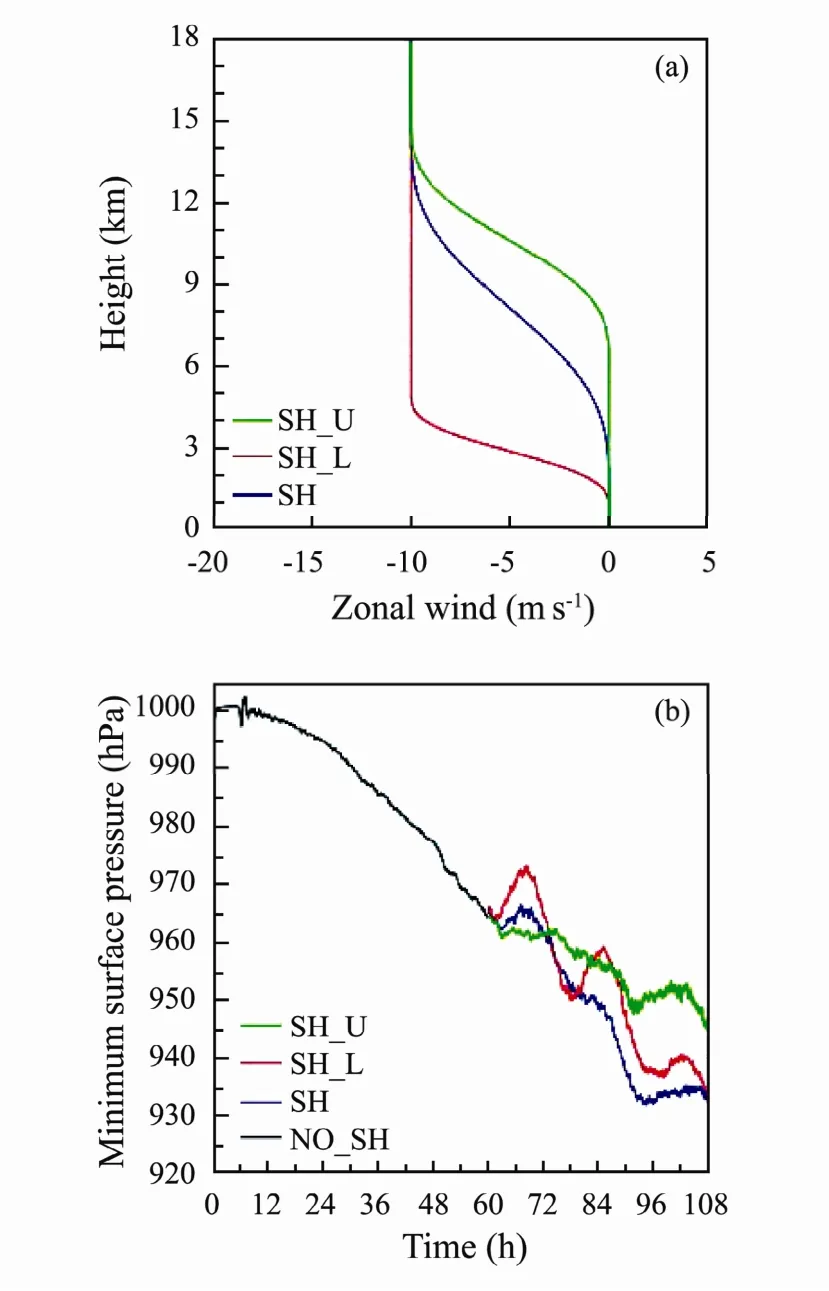
Fig.1 (a) Vertical profiles of the background zonal winds used in the numerical simulations and (b) time series of minimum surface pressure (hPa) of the simulated storms.
Fig.1b presents the intensity changes of the TCs after the shear was imposed. The storm simulated in SH intensified for about 2 h, followed by a rise in the minimum sea level pressure from 963 hPa at 62 h to 967 hPa at 66 h. Later on, the minimum sea level pressure sharply decreased by approximately 35 hPa within 22 h (Fig.1b),indicative of rapid intensification of the TC in SH during this period. In SH_L, the storm also intensified for about 1.5 h after the shear was imposed. Of interest is that the TC intensity tended to periodically pulsed with an alternative weakening-intensifying nature, showing a period of approximately 18 h (Fig.1b). The mechanisms governing this unique intensity change will be investigated in another study. By 108 h, the minimum sea level pressure of the storm in SH_L dropped to 933 hPa, similar to that in SH. In contrast to the results in SH and SH_L, the storm modeled in SH_U did not weaken significantly immediately after the presence of shear. The change of its intensity was subtle through 74 h. Later, the storm in SH_U intensified for about 18 h, followed by a weakening. At 108 h, the minimum sea level pressure of the storm in SH_U was near 945 hPa (Fig.1b), evidently higher than those in SH and SH_L. The intensity changes of the simulated storms seemingly suggest that the upper-level shear is more detrimental to TC intensity, while Wang et al. (2015) found that the low-level shear is more negatively correlated with TC intensity change during the active typhoon season. The inconsistence of the relationship of shear and intensity change between the current simulation study and observational study in Wang et al.(2015) needs a further investigation, which is out of the scope of this paper.
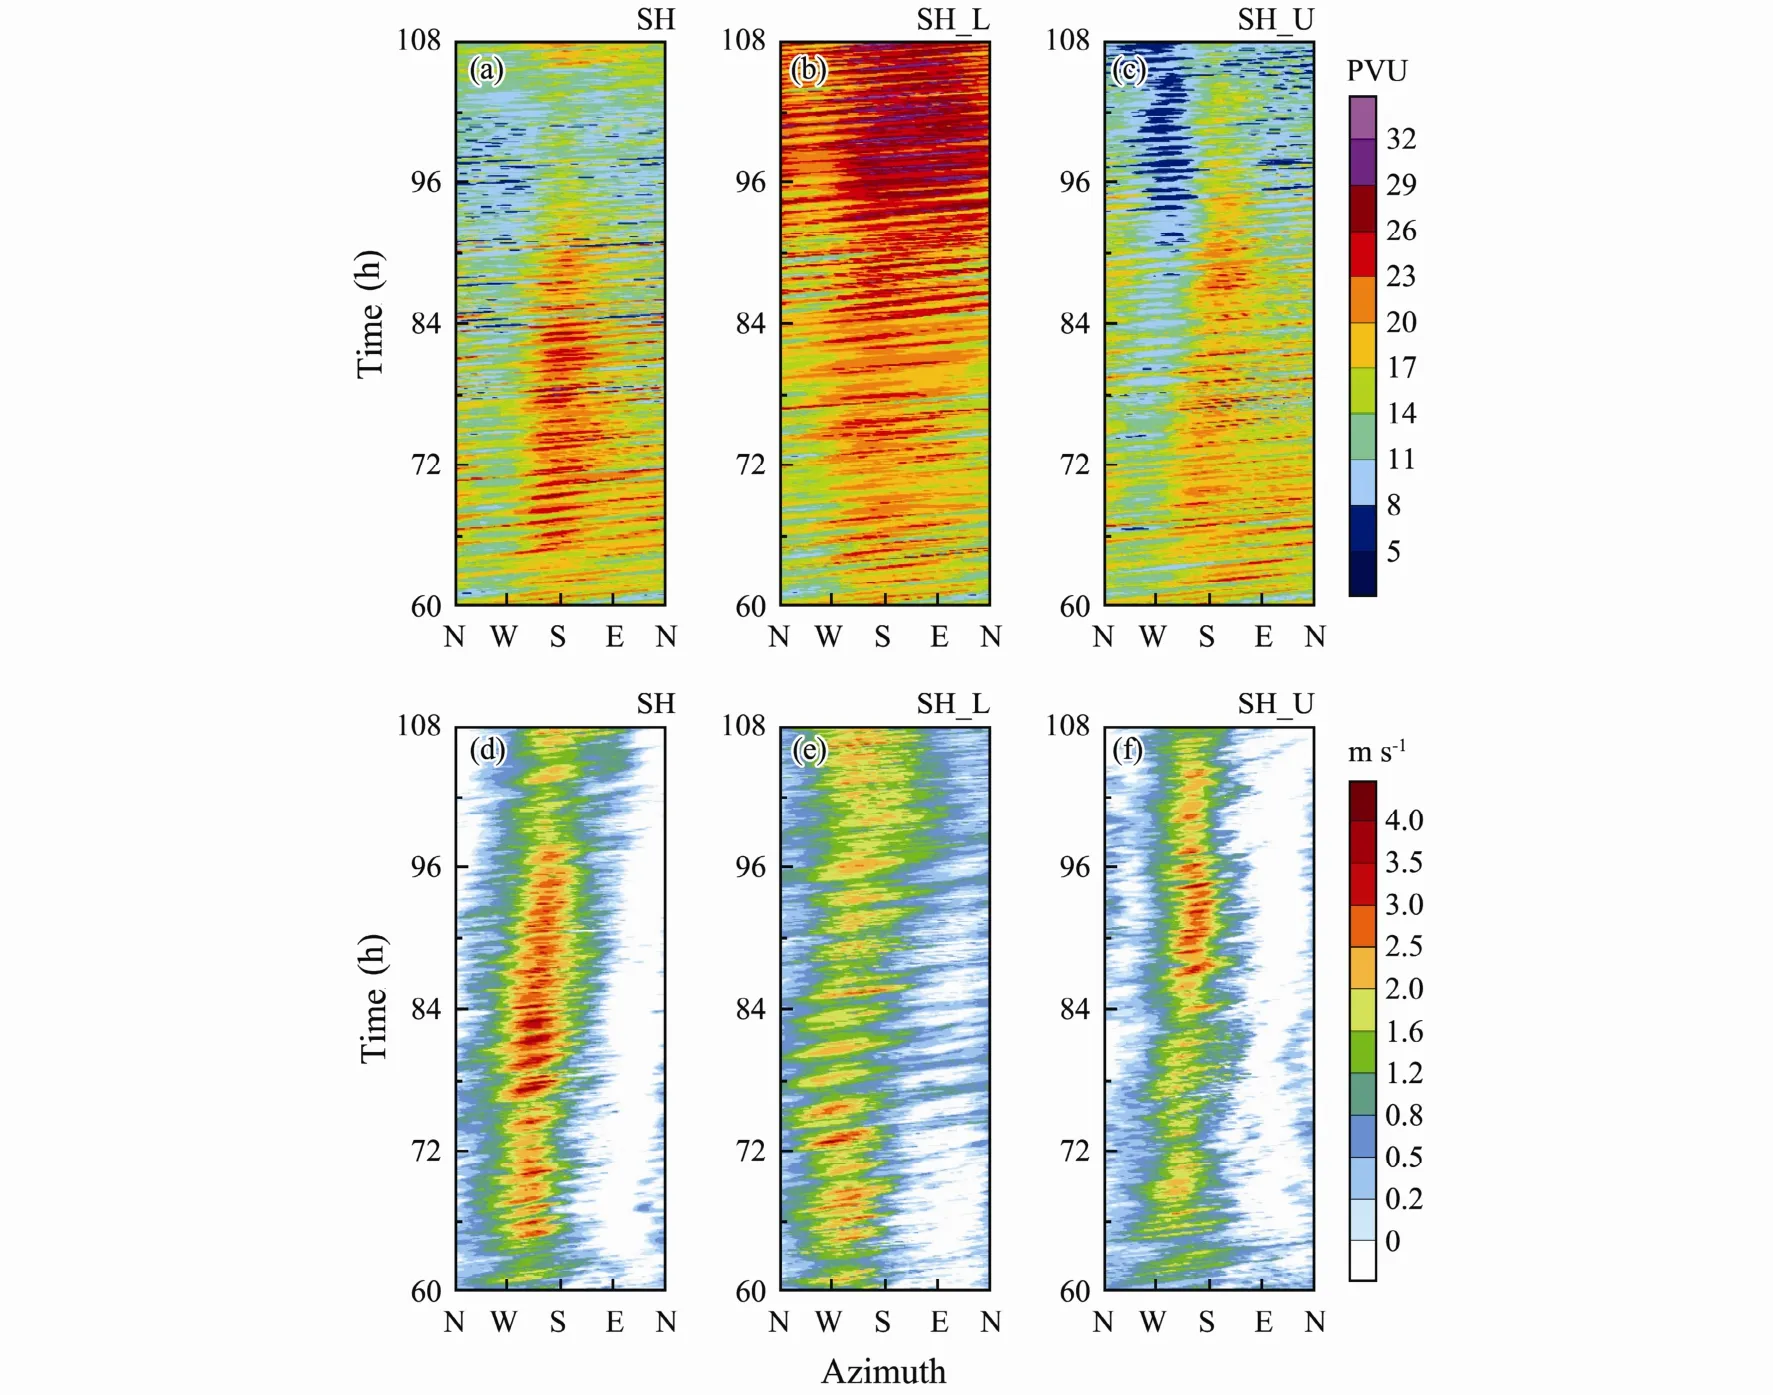
Fig.2 Time-azimuth distributions of radially (20-40 km) and vertically (1-3 km) averaged (top panels) PV (unit, PVU; 1 PVU = 10-6 m2 K kg-1 s-1), and (bottom panels) vertical velocity (m s-1).
Many studies have found the inner-core convective asymmetry in the presence of vertical wind shear, with the convective maximum regularly occurring downshear and downshear-left of the shear vector. Fig.2 depicts the time-azimuth distributions of PV and vertical velocity averaged radially between 20- and 40-km radii and vertically between 1- and 3-km height, showing the low-troposphere convective features in the eyewall region. It is apparent that convective maxima in the three simulations were located in the southwest of the eyewall (namely downshear left of the shear vector) throughout the whole integration (Figs.2d-f). Both the PV and vertical velocity fields showed that the eyewall convection tended to originate downshear right and relax upshear left (Fig.2),accordant with previous findings.
3.2 Vortex Tilts
The vortex tilt magnitude is determined here as the distance from the center at z = 11.6 km to the center at z =0.9 km. The storm center is defined as that which maximizes the symmetric tangential wind, with a variational approach to adjusting the location of the center until the maximum azimuthal mean tangential wind is obtained(Wu et al., 2006).
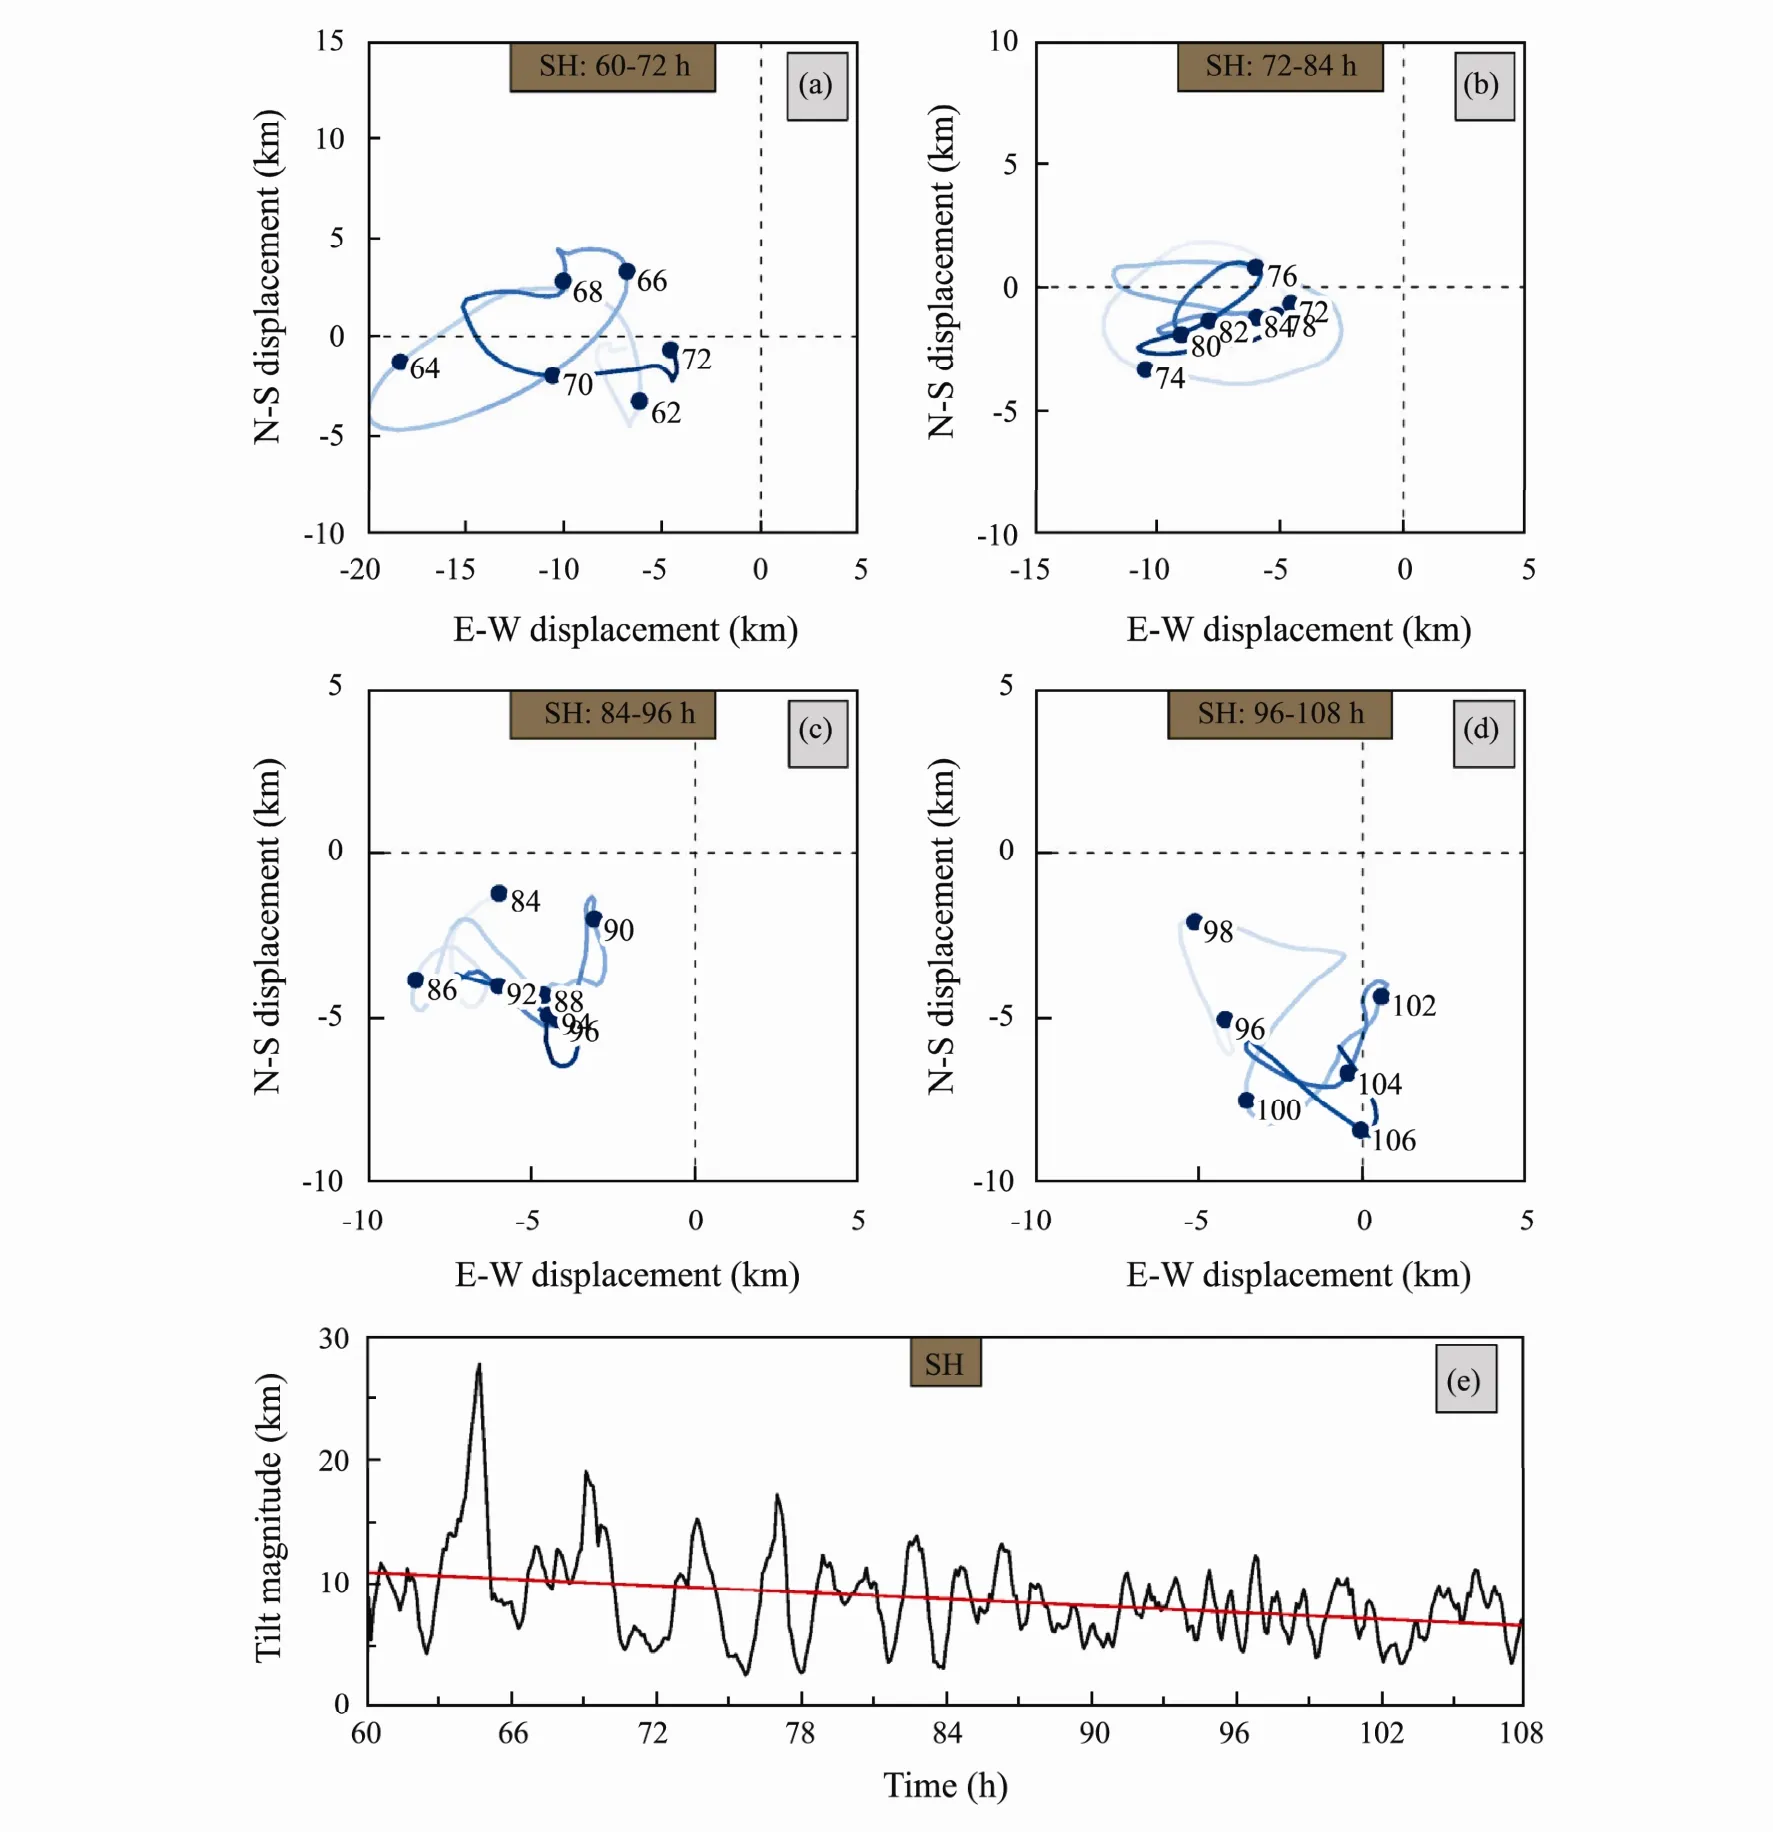
Fig.3 Displacement of the storm centers at 11.6-km altitude from the center at 0.9-km altitude for experiment SH during periods (a) 60-72 h, (b) 72-84 h, (c) 84-96 h, and (d) 96-108 h. Time (model hour) is indicated by the dots and numbers while the line gets darker with time. (e) Evolution of the tilt magnitude measured by the distance of the center from z = 11.6 km to z = 0.9 km, with the red line indicating the best-fit line to the data.
Figs.3a-d show the displacements of the vortex center at 11.6 km from the vortex center at 0.9 km in SH, which are smoothed with a 5-point moving average. Immediately after the easterlies with their speed change throughout the troposphere were imposed on the intensifying TC,the vortex quickly tilted westward (Fig.3a) with the tilt magnitude of about 8 km by 61 h (Fig.3e). Afterward, the upper center moved through three cyclonic loops by 72 h(Fig.3a), with the maximum tilt magnitude of about 27 km (at 64.5 h; Fig.3e) occurring in the second loop during this period. This looping motion of the upper center clearly indicates cyclonic precession of the upper vortex.The periods of the three loops were different, about 2.5 h for the first loops but 4.5 h for the third loop (Fig.3a).From 72 to 78 h the upper center continued moving cyclonically, but afterward it tended to oscillate back and forth (Fig.3b) with the tilt axis showing a nodding motion.Therefore, the upper vortex seemed to be featured by nutation between 78 and 84 h. A comparison between Figs.3a and 3b shows that the vortex tended to tilt to the left of the vertical shear vector after 72 h. The motion of the upper center did not manifest an obvious looping nature during the period 84-96 h, but the tilt of the storm shifted to more left of the shear vector (Fig.3c). In the last 12 h of simulation, both precession and nutation of the upper vortex were not seen, and the tilt of the TC was towards the southwest (Fig.3d), which indicates that the storm tended to be in downshear-left tilt equilibrium. The feature of the tilt to the left of the vertical shear direction agrees with results of prior studies (Reasor et al., 2004;Braun and Wu, 2007). Reasor et al. (2004) showed that the existence of downshear-left tilt equilibrium of a vortex occurs when the vortex Rossby wave damping is nonnegligible. Fig.3e depicts the temporal variation of tilt magnitude. It is shown that, although there existed oscillations of tilt magnitude due to vortex precession and nutation with the amplitude of the tilt magnitude oscillations diminishing with time, the tilt magnitude of the vortex tended to linearly decrease with time.
In experiment SH_L where the environmental wind speed changed rapidly in the lower troposphere, the vortex tilted westward immediately after the vertical shear was added (Fig.4a). The upper center began to move cyclonically after 61 h and completed two loops by 70 h,followed by a small clockwise loop from 70 to 72 h. At about 67 h, the maximum tilt of 22 km was observed in the second cyclonic loop. Of interest is that the vortex favored a tilt to the right of the shear direction by 72 h(Fig.4a). During the period 72 to 90 h, the upper vortex precessed successively with the orbit of the looping motion decreasing with time (Figs.4b and 4c). Additionally,the vortex tilt tended to shift to the downshear direction.During the period 90 to 96 h, the upper center shifted to the left of the shear direction, and the motion of the center looked like nutation (Fig.4c). Subsequently, the upper center kept downshear left until 105 h (Fig.4d). A comparison between Figs.3 and 4 suggests that the vertical shear in the lower troposphere more facilitated the occurrence of vortex precession. Like the result from SH, the magnitude of the vortex tilt tended to decrease linearly with time (Fig.4e), showing the occurrence of a damped looping motion of the upper center (Reasor et al., 2004).
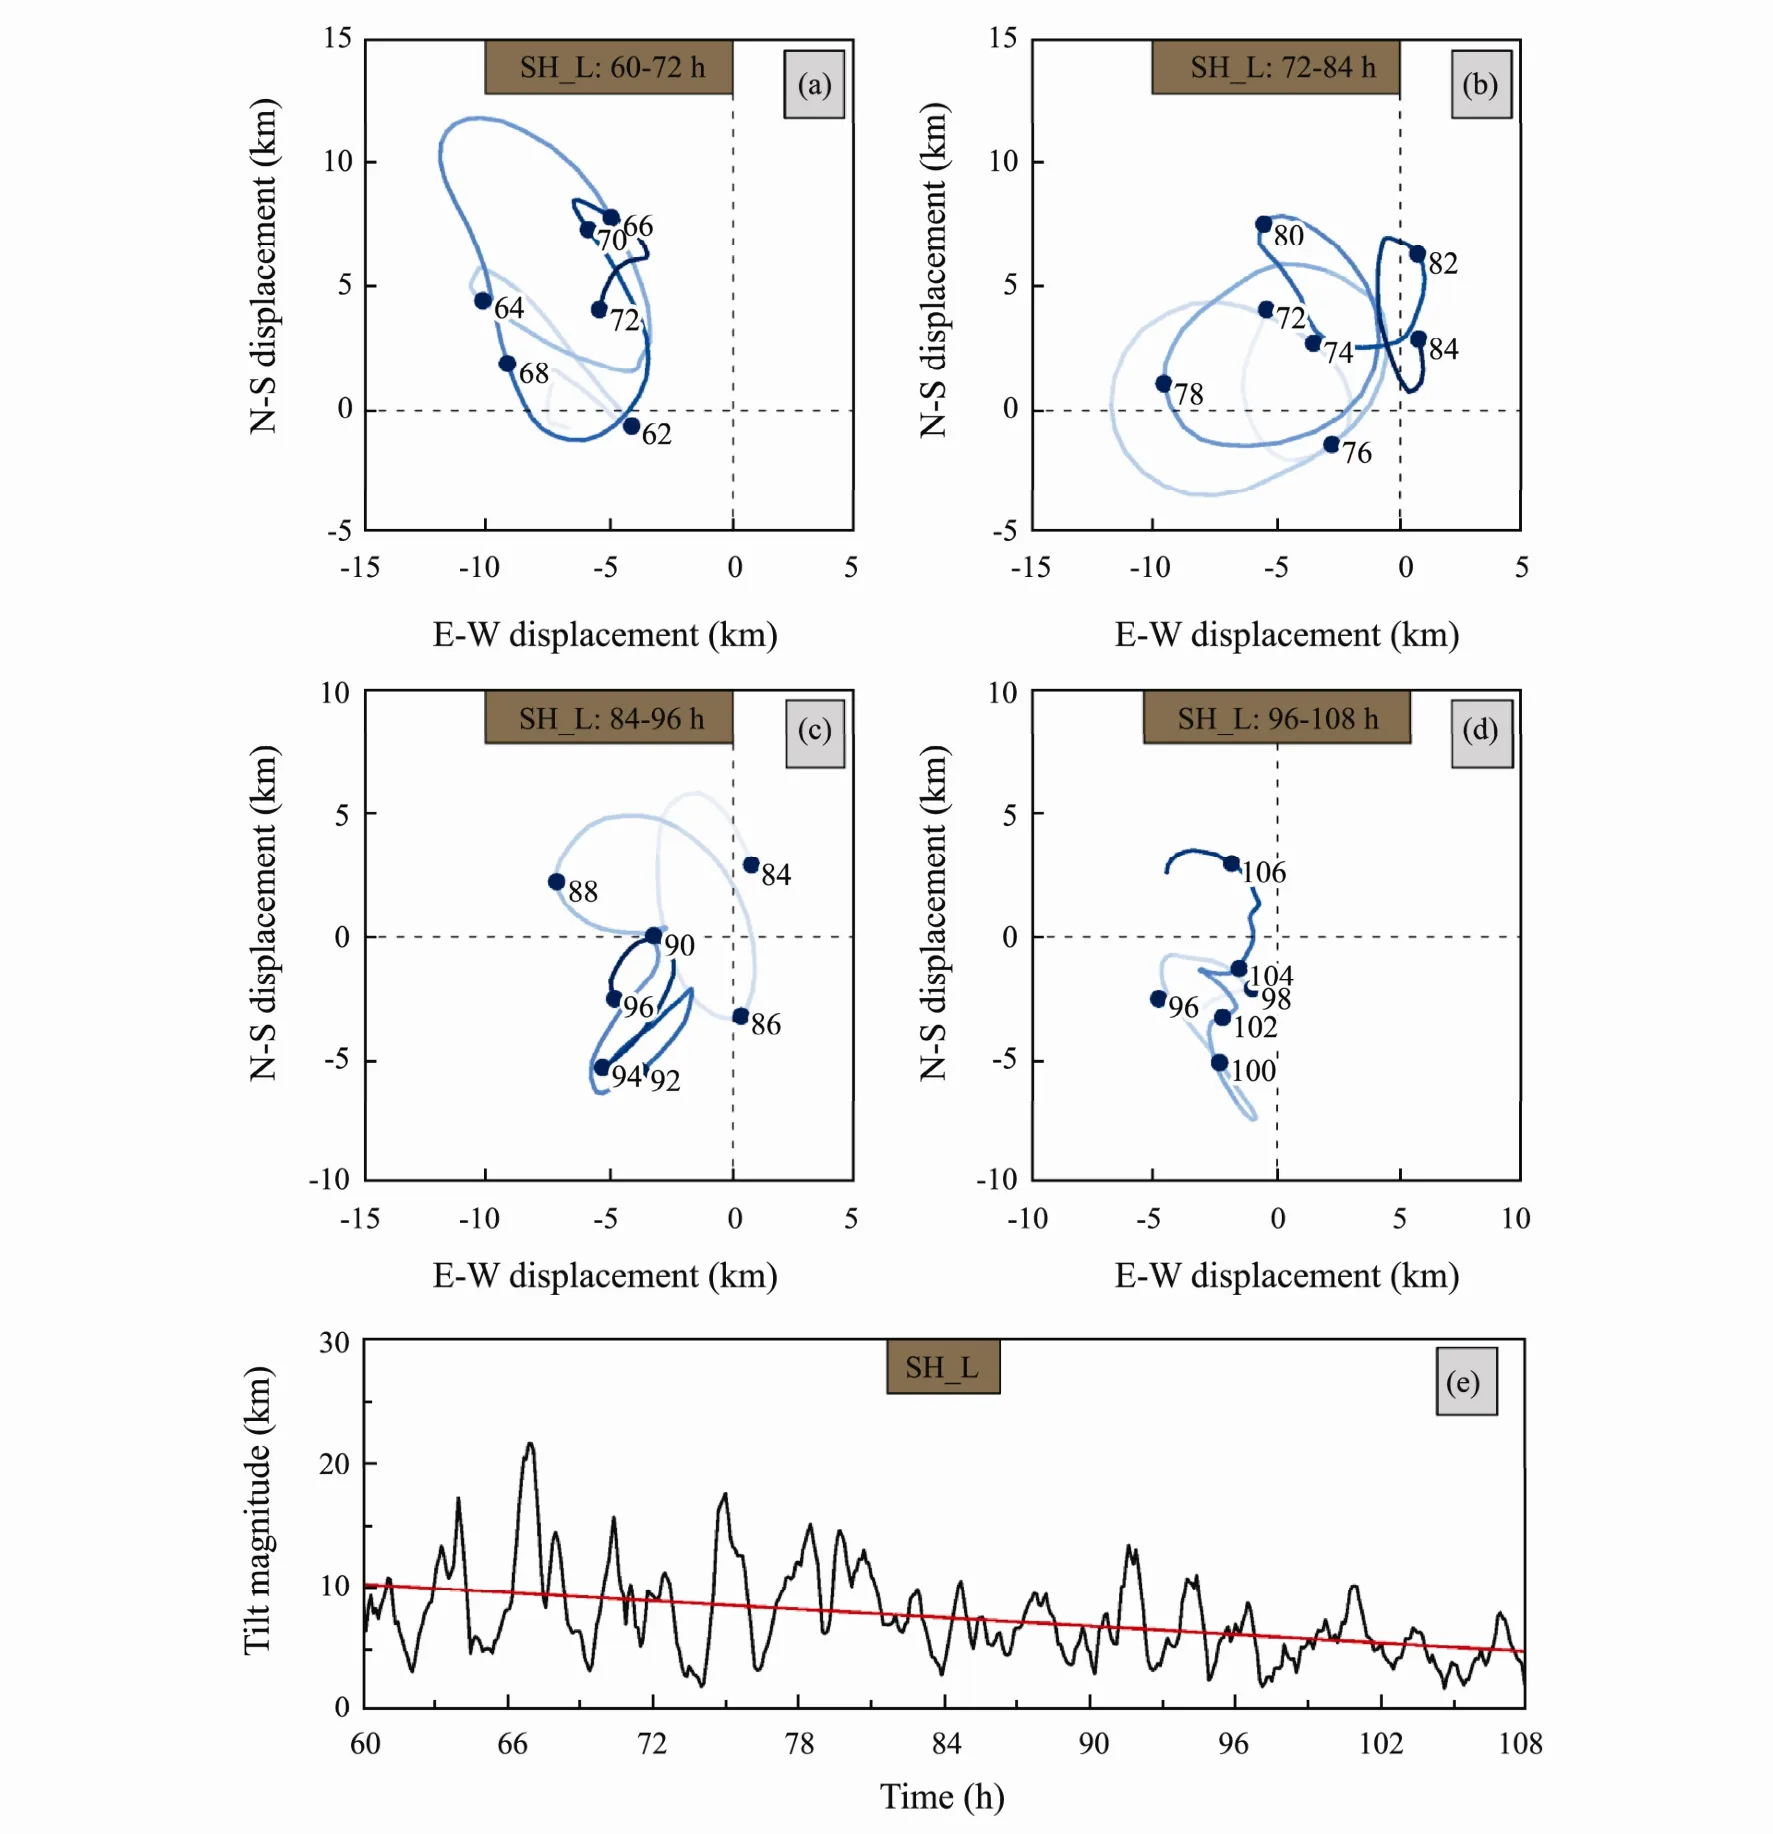
Fig.4 Same as in Fig.3, but for experiment SH_L.
The tilt of the TC simulated in SH_U posed features differing with those found in SH and SH_L. Immediately after the shear was imposed, the upper center moved in a large cyclonic loop, and it later oscillated donwshear left(Fig.5a). Afterward, the vortex preserved a tilt to the left of the shear direction (Figs.5b-d), indicative of the presence of downshear-left tilt equilibrium. In addition, Figs.5a-d show that successive vortex precession was not observed frequently in SH_U, compared with the simulations in SH and SH_L. Another difference in the vortex tilt trait is the tilt magnitude linearly increasing throughout the integration of SH_U (Fig.5e).
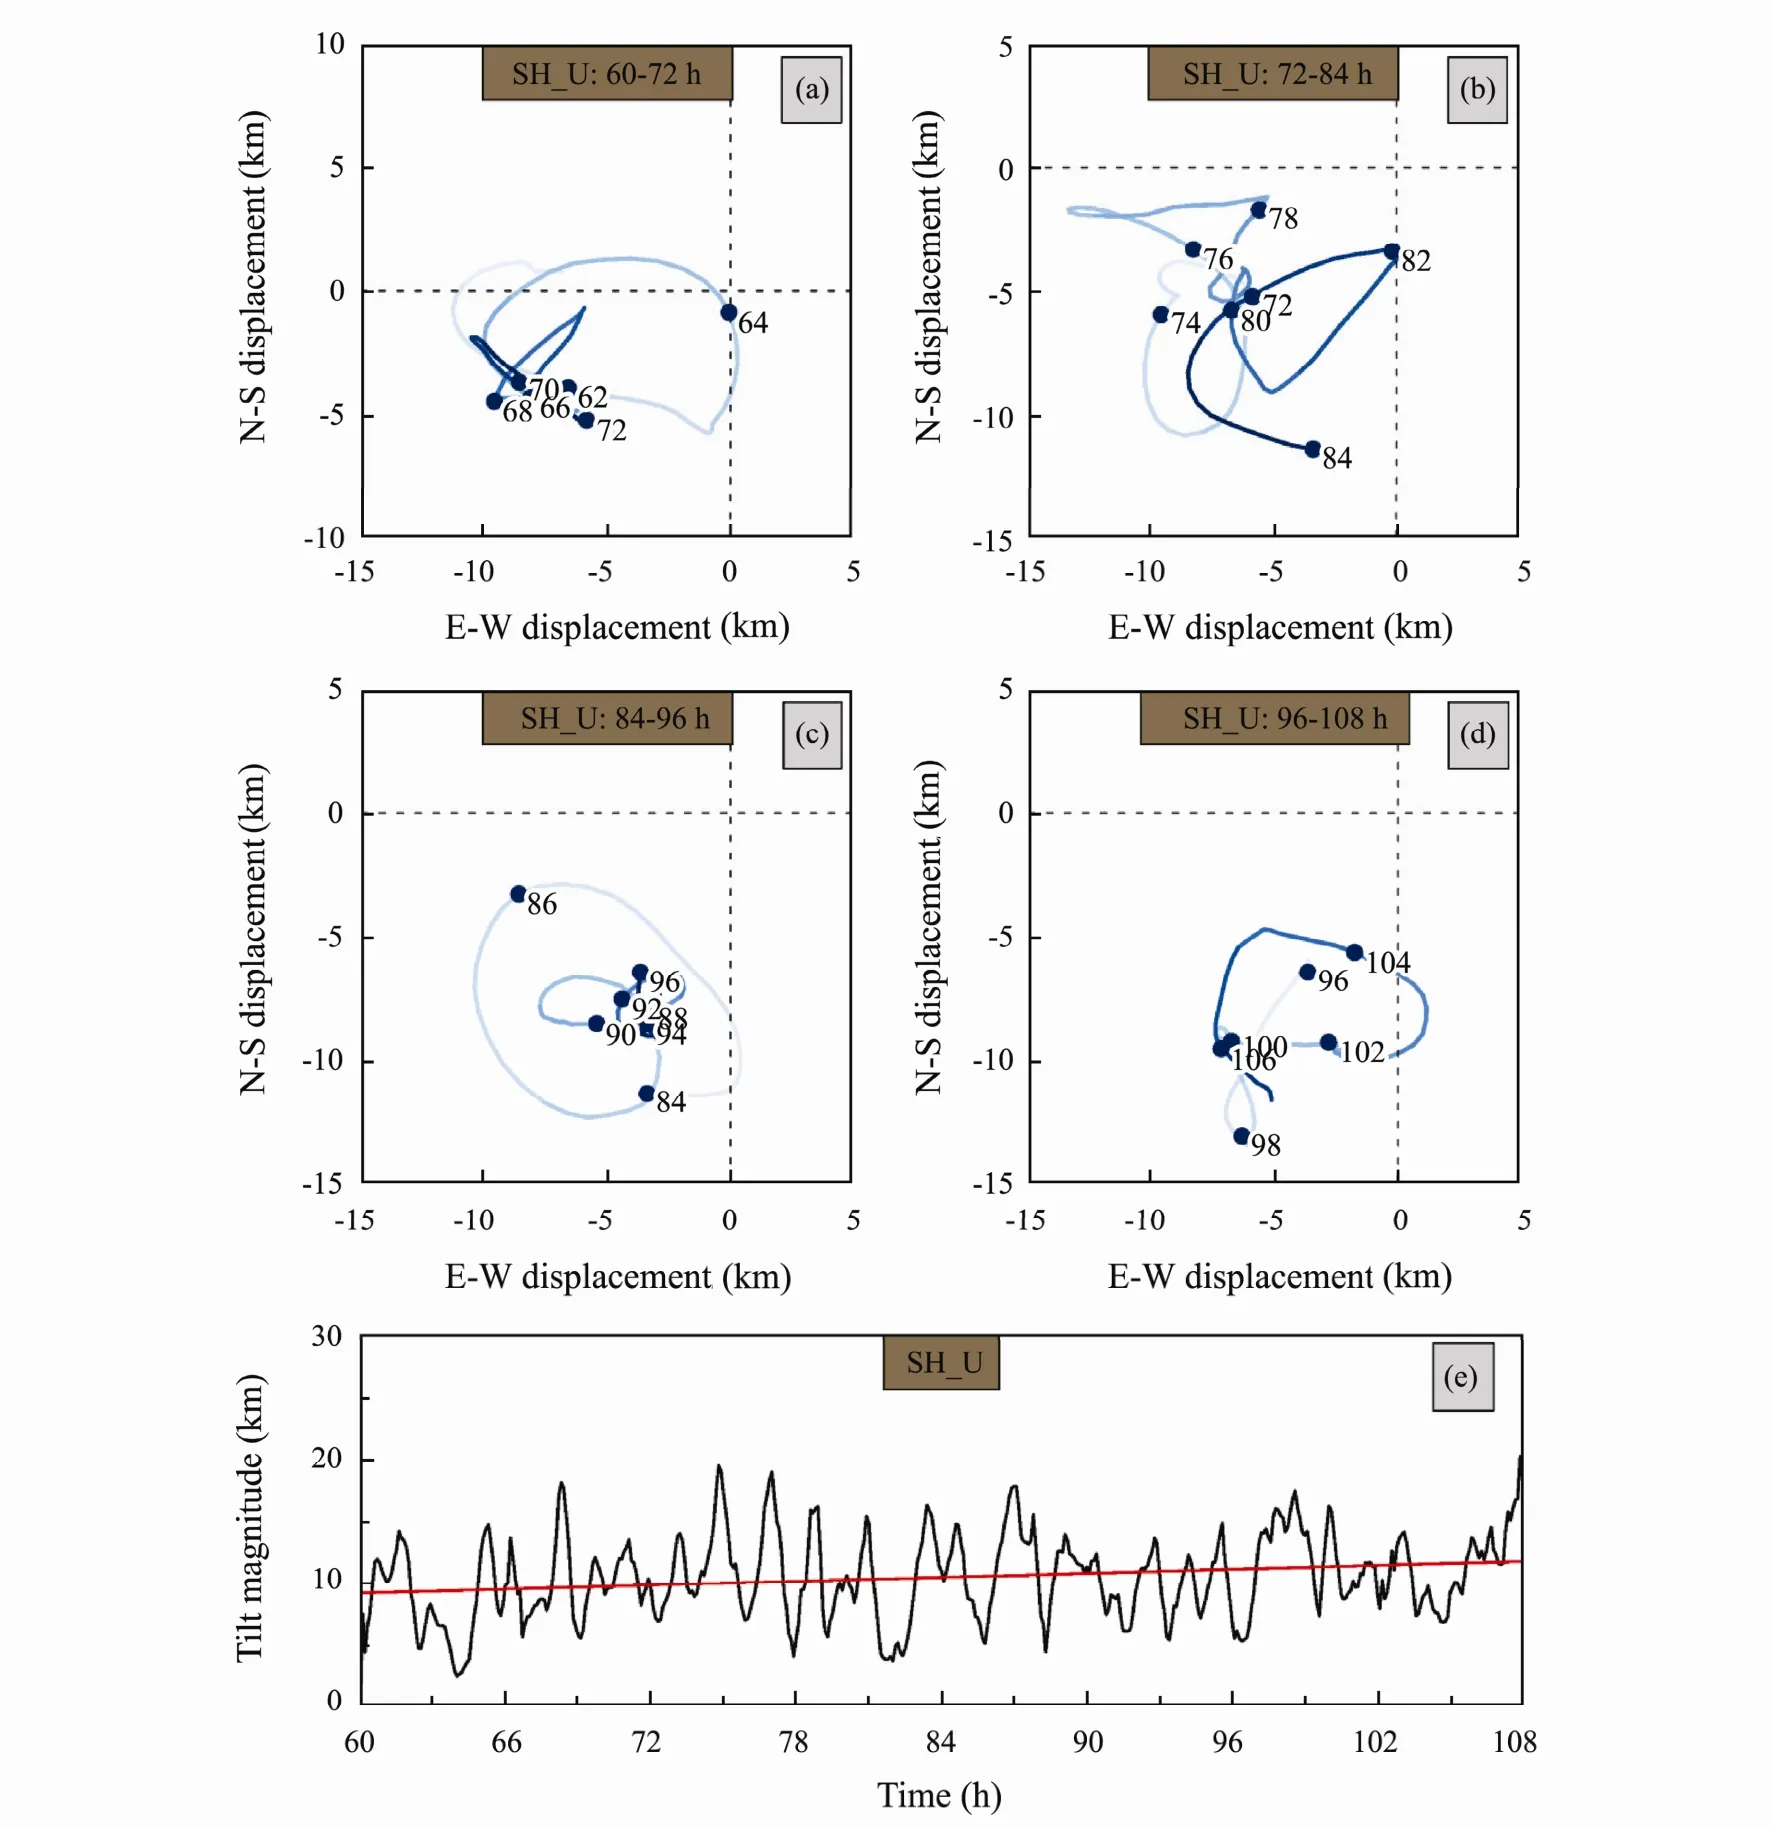
Fig.5 Same as in Fig.3, but for experiment SH_U.
A possible reason for the differences in the vortex precession feature in the three experiments is associated with the vertical distribution of inertial stability. Holland and Merrill (1984) pointed out that the inertial stability is larger in the lower troposphere than in the upper troposphere.The lower vortex is thus more resistant to the effect of the shear. Although the shearing effect in SH_L was concentrated in the lower troposphere, the vortex circulation in the lower troposphere was able to resist the shear due to the larger inertial stability therein. As a result, the coupling between the upper and lower vortices facilitates the occurrence of vortex precession in SH_L (Fig.4). In contrast, the shearing effect in SH_U was concentrated in the upper troposphere. The upper vortex was less resistant to the shear resulting from the relatively smaller inertial stability. Therefore, the coupling between the upper and lower vortices was relatively weaker in SH_U, unfavorable to vortex precession (Fig.5).
It is also noted that the TC modeled in SH_U at 108 h was much weaker than those in SH and SH_L (Fig.1b),accompanied by the tilt increase in SH_U (Fig.5e) and the tilt dilution in SH and SH_L (Figs.3e and 4e). This appears to indicate the possible thermodynamic effect of the ventilation of the warm core or eyewall heating in the upper troposphere on TC intensity. This upper-level ventilation may weaken a storm either by the advection of the warm core as a whole (Gray, 1968) or due to the outward eddy heat flux by asymmetric eddies caused by shear(Frank and Ritchie, 2001). In the present study, the increasing vortex tilt in SH_U likely led to more significant upper-level ventilation, hence impeding the storm intensification. This seems to disagree with the findings in Wang et al. (2015) in which they showed a stronger negative correlation of the low-level shear and the 24-h lagged TC intensity change. Wang et al. (2015) further speculated that low-level shear could lead to an enhanced efficiency of the midlevel ventilation, and evaporation of raindrops could be enhanced by the radially inward intrusion of low enthalpy air by the shear flow so that low enthalpy air is transported into the eyewall. These two processes may more significantly weaken TC intensity. However, the environment used in the present study was based on the moist-tropical sounding of Dunion (2011). Therefore, the effects of abovementioned midlevel ventilation and enhancement of evaporation of raindrops with respect to the low-level shear were possibly limited while the upper-level ventilation was more detrimental to the storm intensity. Nevertheless, further discussions of how the shear affected the TC intensity are needed, which is out of the scope of this paper.
As noted above, the vortex tilt magnitudes in SH and SH_L showed a linearly decreasing tendency while it had a linearly increasing tendency in SH_U. To investigate why the tilt magnitude evolved as described, we follow the work by Jones (1995) and Smith et al. (2000) and discuss the penetration depth. The penetration depth is defined as

where ξ is the modified Coriolis parameter (f0+2Ω), f0is the planetary vorticity, Ω is the angular velocity, ζ is the relative vorticity, L is the length scale, and N is the Brunt-Väisälä frequency. Fig.6 portrays the time series of the mean penetration depths at z = 1 km for SH, SH_L, and SH_U, showing that the penetration depth maximized in the eyewall region. In SH, the penetration depth near the eyewall became considerably large through 96 h with the peak value increasing from 7 km at 60 h to 10 km at 96 h(Fig.6a), yielding a storm that was more resilient in shear.Resultantly, the tilt of the TC simulated in SH tended to decrease with time (Fig.3e). The penetration depth in the vicinity of the eyewall dropped after 96 h (Fig.6a), and correspondingly, the tilt magnitude of the vortex had a subtly increasing tendency during that time (Fig.3e).Nevertheless, a linear decrease in the vortex tilt magnitude was predominantly observed throughout the integration of SH (Fig.3e). The change of the penetration depth appeared to be associated with the change of relative vorticity in the eyewall region (not shown). The relative vorticity in the eyewall region of the SH storm increased through 96 h, followed by a slight decrease, consistent with the change of the penetration depth. Fig.6b indicates the penetration depth near the eyewall increasing with time in SH_L, with the maximum value increasing from 7 km at 60 h to greater than 10 km at the end of the simulation, and the magnitude of relative vorticity in the vicinity of the eyewall varied with a similar tendency (not shown).Therefore, the tilt magnitude was also reduced during the simulation of SH_L (Fig.4e), suggesting that the vortex was tended to be resilient in shear. In contrast, the characteristics of the penetration depth in SH_U were unlike those in SH and SH_L. The penetration depth in the eyewall region slightly decreased in SH_U from 9 km at 63 h to 7.5 km at 108 h (Fig.6c), accompanied by a decrease in relative vorticity in the eyewall region (not shown). This contributed to the gradual growth in the vortex tilt in SH_U (Fig.5e), implying that the vortex in that experiment was less resilient in shear.
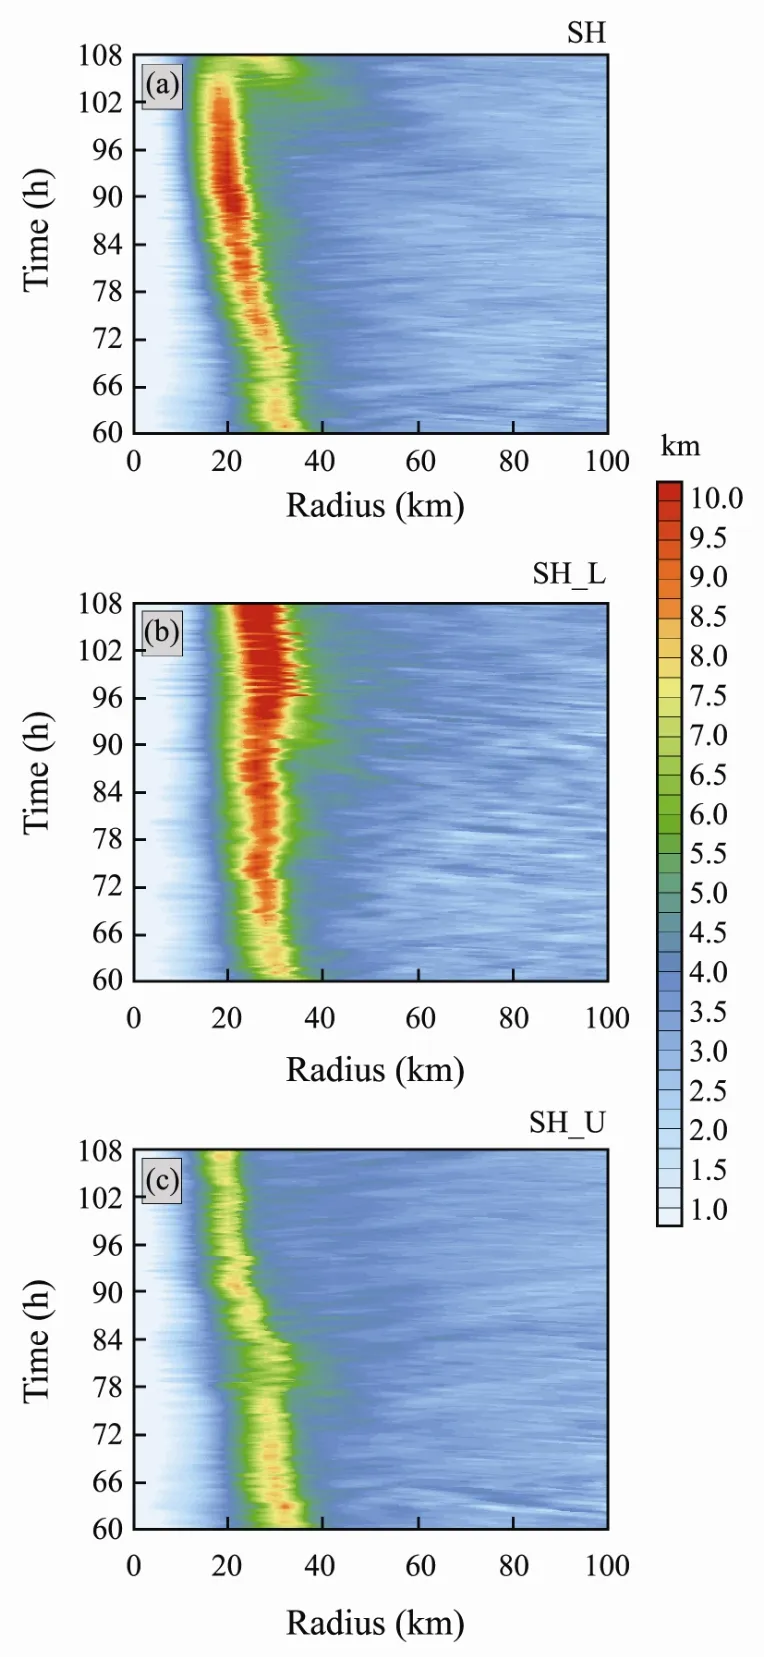
Fig.6 Hovmöller diagram of the mean penetration depth(km) at z = 1 km for (a) SH, (b) SH_L, and (c) SH_U.
4 Summary
To discuss how TC tilts respond to vertically varying background flows, three idealized numerical simulations were conducted in this study with the fully compressible,nonhydrostatic, cloud-resolving Tropical Cyclone Model version 4 (TCM4), and preliminary results were shown here. In experiment SH, an easterly vertical wind shear of 10 m s-1with the wind speed varying throughout the troposphere was imposed on an intensifying storm. In experiment SH_L a shear of 10 m s-1was concentrated in the lower troposphere, while a shear of 10 m s-1was concentrated in the upper troposphere in experiment SH_U.
Immediately after the shear was added in SH, the simulated TC tilted westward. Undergoing several precession and nutation processes, the vortex gradually tilted dowshear left. Ultimately, the storm was found to be in downshear-left tilt equilibrium. The tilt magnitude tended to linearly decrease throughout the integration. Following the initial westward tilt, the TC simulated in SH_L tended to tilt to the right of the shear direction and showed evident vortex precession. Later on, the tilt gradually shifted to the left of the shear vector. The temporal variation of the vortex tilt magnitude in SH_L was akin to that in SH,indicating a linear decrease in the tilt value. Therefore,the TCs simulated in both SH and Sh_L tended to be resilient in shear. The characteristics of the vortex tilt in SH_U looked different with in SH and SH_L. Precession processes were less frequently seen in SH_U, and the vortex tilt more rapidly shifted downshear left. It is found that the tilt magnitude in SH_U had a linear increasing tendency, suggesting the storm was less resilient in shear.Further investigations show that the temporal variations of vortex tilt magnitude in the simulations were associated with the evolution of the penetration depth. The near-eyewall penetration depths tended to increase with time in SH and SH_L, resulting in gradual decreases in the vortex tilt in those experiments. However, the penetration depth slightly dropped with time in SH_U, corresponding to the gradual increase in the vortex tilt.
In the present study, only preliminary results with respect to the vortex tilt in vertically varying background flows were examined. There still exist many issues of interest worthy investigating further. For example, what are the physical mechanisms governing the occurrence of precession and nutation of the sheared TCs? Why did the vortex in SH_L tend to tilt downshear right during the early integration? How does the vortex tilt evolve when storms with different intensity are embedded in shear?These will be examined in future studies.
Acknowledgements
This work was jointly supported by the National (Key)Basic Research and Development (973) Program of China(No. 2015CB452803), the National Natural Science Foundation of China (Nos. 41475058 and 41375068), the Open Project of the State Key Laboratory of Severe Weather (No. 2016LASW-B08), and the Top-notch Academic Programs Project of Jiangsu Higher Education Institutions (TAPP). Valuable comments from two anonymous reviewers that helped improve the quality of the manuscript are highly appreciated.
杂志排行
Journal of Ocean University of China的其它文章
- Effect of Different Dietary Protein and Lipid Levels on the Growth, Body Composition, and Intestinal Digestive Enzyme Activities of Juvenile Yellow Drum Nibea albiflora (Richardson)
- Modelling Wave Transmission and Overtopping Based on Energy Balance Equation
- Extreme Sea Level Rise off the Northwest Coast of the South China Sea in 2012
- Spatial Distribution and Seasonal Variation of Explosive Cyclones over the North Atlantic
- The Influence of Two Kinds of El Niño Events on the Strong Tropical Cyclone Generation and Strength in the Pacific Ocean
- Sea State Bias Estimation with Least Absolute Shrinkage and Selection Operator (LASSO)
