Study on Hydraulic System Efficiency of Heaving-Buoy Wave Energy Converter
2018-08-28SHIHongdaZHAOChenyuLIUZhenandCAOFeifei
SHI Hongda , ZHAO Chenyu LIU Zhen and CAO Feifei
1) College of Engineering, Ocean University of China, Qingdao 266100, China
2) Shandong Provincial Key Laboratory of Ocean Engineering, Qingdao 266100, China
(Received September 11, 2017; revised December 6, 2017; accepted December 15, 2017)
© Ocean University of China, Science Press and Springer-Verlag GmbH Germany 2018
Abstract The hydraulic system is the key component in the widely used wave energy converters (WEC). In this paper, we theoretically analyze and describe our investigation of the efficiency of the hydraulic system by simulation and model testing of the combined heaving-buoy WEC. We derive a new governing equation that includes nonlinear hydraulic resistance in the power take-off(PTO). We conducted a physical model experiment based on a 100-kW prototype and applied a hydraulic system with an energy accumulator. The model test results reveal an important parameter related to efficiency with respect to nonlinear hydraulic resistance.We also studied the relationship between the efficiency and the initial conditions. Finally, based on our numerical simulation results,we discuss the effect on efficiency of the gas content of the hydraulic fluid and ways to reduce its impact.
Key words hydraulic system; PTO; nonlinear hydraulic resistance; efficiency; gas content
1 Introduction
Wave energy converters (WEC) can be categorized as either point, terminator, or attenuator absorbers, based on the relationship between the orientation of the approaching waves and the direction of the oscillation motion(Drew et al., 2009; Soares et al., 2012). Due to its small size in comparison with the wave length, point absorbers are not sensitive to wave direction (Lopes et al., 2009;Bozzi et al., 2013). One example is the AlbaTERN, which has been tested on an array of three part-scale units on the Isle of Muck off the west coast of Scotland (http://albatern.co.uk, accessed 10/10/2015). In China, wave energy resources are abundant but are not evenly distributed nor as good as those in Europe. The smaller WECs produced in China have lower installed capacity (Zhang et al., 2014).Multi-point absorbers such as the Wavestar (Hansen et al.,2013) developed by Alborg University and the array-type heaving buoy (Shi et al., 2016) developed by Ocean University of China have more oscillating buoys to enhance the power absorption. In the 1970s, Salter developed a representative terminator-type WEC, known as Salter’s Duck, and its excellent design and manufacturing technology make its efficiency as high as 100% (Salter, 2006;Lucas et al., 2009). An example of an attenuator WEC is the DEXAWAVE, which has been tested at the DanWEC test center (Pecher, 2011). Since the 1990s, new types of WEC have been developed (Cameron et al., 2010; Ning et al., 2016; Gao et al., 2016). One of the most successful WECs is the Pelamis, which can absorb energy simultaneously from the pitch and yaw modes (Henderson, 2006).Generally, wave energy conversion transforms wave energy into electricity in two steps (Zhang et al., 2014). First,wave energy is extracted by an oscillating body and the second step is the energy conversion by the power takeoff (PTO) system. The hydraulic system equipped with an accumulator is widely used for the PTO step due to its excellent energy transfer performance (Lasa et al., 2012).Although there are various types of hydraulic system used in WECs, their basic energy transfer principles are the same: a hydraulic cylinder pumps fluid into the accumulator, the solenoid valve opens when the pressure reaches the release threshold, and then the hydraulic motor drives the generator (Falcão, 2008). As such, the efficiency of the WEC is also related to this process.
In recent decades, there have been efforts made to achieve higher efficiency by optimizing the hydraulic components and control strategies of WECs (Falcão,2010). For example, the Wavestar WEC uses a discrete displacement cylinder (Hansen et al., 2012), which has three active chambers connected by different pressure lines. The Pelamis’s hydraulic cylinders use cardan joints that buffer the shear force, thereby absorbing energy with different degrees of freedom (Henderson, 2006). A novel digital hydraulic motor developed by Salter and Artemis Intelligent Power Ltd. demonstrates higher transmission efficiency than that of traditional motors (Salter and Rampen, 1993; Salter and Lin, 1995). Today, the response control of the PTO has become an important factor for influencing efficiency. First applied to the Duck in the 1970s and then in other types of WEC, response control can ensure the survival of a WEC in extreme sea environments and extract a maximum amount of power under different incidental wave conditions (Falnes, 2002; Falcão,2007; Babarit et al., 2009). However, in most studies, the control of hydraulic resistance, denoted as FPTO, to enhance efficiency has typically been linear in form, which raises some problems. In this paper, we propose a nonlinear method for describing FPTOand use it in a new governing equation. In addition, despite the fact that it has previously been considered insignificant and often been disregarded, we examine the influence of the gas content of the fluid on WEC efficiency.
The rest of this paper is organized as follows. In Section 2, we propose a nonlinear PTO based on some theoretical analysis and use it to describe the governing equation of the buoy. In Section 3, we describe a physical experiment that provides a key parameter for the expression of hydraulic resistance and which is closely related to the efficiency, as determined from our model test results.Finally, in Section 4, we use numerical analysis to determine the influence of the gas content of the hydraulic fluid on the efficiency of the WEC.
2 Hydraulic PTO
2.1 Accumulator
Accumulators can smooth the fluctuation caused by waves and guarantee more stability in the operation speed of the generator. The three main energy storage methods used in energy accumulators are based on gravity, spring,and gas. The air-charged accumulator is used most widely in WECs, the structure of which is illustrated in Fig.1.
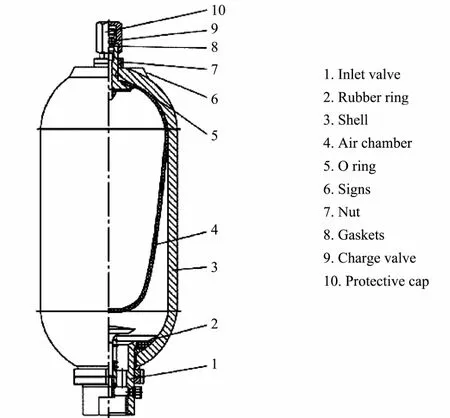
Fig.1 Schematic of the gas accumulator.
The gas in the accumulator is regarded as an ideal or perfect gas. Considering the long-term energy storage process, isothermal conditions are applied between the initial and energy-charging states.
2.2 Governing Equation
2.2.1 Hydrodynamics of wave energy absorption
In our theoretical analysis, to simplify the derivation,we regard the buoy with a single degree of freedom (oscillating in heave) as a cylinder. Fig.2 shows a motion diagram of a heaving buoy in waves. The waves are linear and we assume the fluid to be non-viscous and irrotational.
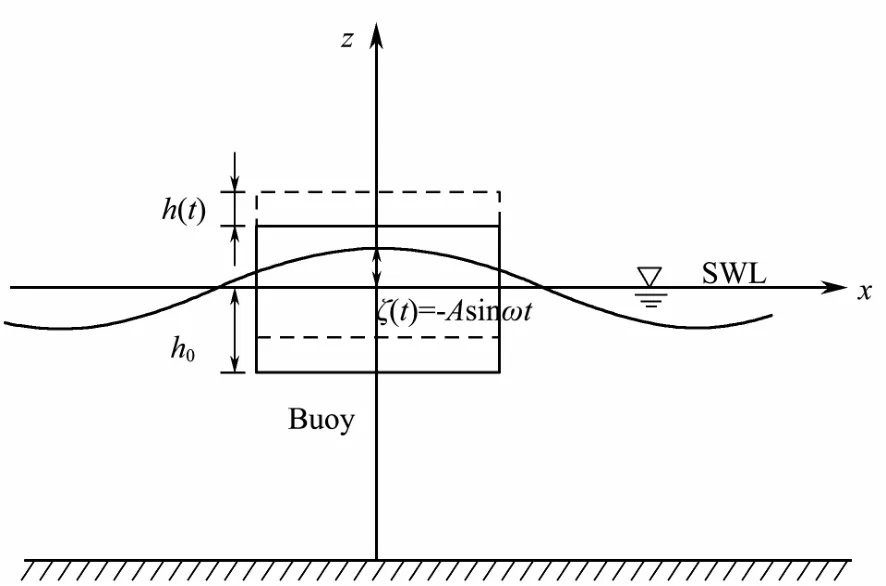
Fig.2 Motion diagram of a heaving buoy.
In Fig.2, h(t) is the displacement of the buoy and h0is the submergence depth below still water level. In linear wave theory, the wave surface function is expressed as

where A is the wave amplitude, ω is the angular frequency, and t is time.
According to Newton’s law, the governing equation for an oscillating body is as follows:

where m is the mass of the buoy, FBis the buoyancy, FDis the dynamic force, and FPTOis the hydraulic resistance.
As a result of the movement of the buoy, FBis not static and is independent of the buoy velocity and acceleration. As such, FBcan be represented as follows:

where g is the gravitational acceleration and S is the base area of the cylinder.
FDincludes the drag, inertial, and diffraction forces.Since the fluid is non-viscous and irrotational and the wavelength is much longer than the diameter of the buoy,FDis approximately equal to the inertial force. The inertial force is caused by the variation in fluid pressure. Acceleration of the fluid leads to the pressure variation. In previous studies, the Morison equation has often been used to calculate the inertial force. So, FD(Shi et al.,2016) can be expressed as follows:
where CMis the inertial force coefficient and UZis the vertical velocity of water.
In the simplest hydraulic PTO system, the hydraulic circuit comprises a container, a gas accumulator, several hydraulic cylinders, manifolds, and a hydraulic motor.The manifolds ensure that the fluid is pumped into the accumulator whether the buoy is heaving up or down. In linear systems, FPTOis often expressed as

where C, K0are constants, -K0h(t) represents the spring effect, and -Ch˙( t) is the damping caused by energy extraction. Under these assumptions, FPTOis proportional to the velocity of the buoy. However, when the buoy is in operation, the FPTOvalue increases and the increasing FPTOshould allow the buoy amplitude and velocity to decrease, because a stronger FPTOyields greater damping.This is an obvious contradiction. In fact, FPTOis proportional to the pressure in the cylinder, which is the same as the pressure in the accumulator. A new nonlinear FPTOexpression is required.
2.2.2 Nonlinear hydraulic resistance
According to the ideal gas law, as follows:

where Pgasis the pressure in the accumulator and Vgasis the volume of the air bag.
If we take the time differential of Eq. (4), we obtain the following:

When the accumulator is charged, the volume of the air bag is reduced and we can express the rate of volume reduction as follows:

where S0is the average area of the hydraulic cylinder piston and S0can be represented as (Srod+Snorod)/2, where Srodis the area of the hydraulic cylinder’s rod port and Snorodis the area of the hydraulic cylinder’s head port.
Then, we can write Eq. (5) as follows:

where P0is the initial pressure of the accumulator and V0is the volume of the accumulator.
Due to the relatively long charging period, we can express the pressure gradient in the accumulator as Pgas=P0+rt, where r is a coefficient. We verified this assumption in a model test.
The hydraulic resistance can be expressed as follows:

By putting Eq. (7) into Eq. (8), we can obtain the hydraulic force, as follows:

Eq. (9) indicates that the PTO is influenced by both the velocity and the charging time, and we can obtain the coefficient r experimentally. We can calculate all the energy extracted by the oscillating buoy in a given time interval as follows:

where W is the energy absorbed by the WEC.
According to the linear wave theory, we can express the efficiency of the first step of energy conversion as follows:

where D0is the energy capture width of the WEC, Tsis the charging time, N is the wave number in Ts, N=Ts/T, T is the wave period, and L is the wavelength.
2.2.3 Buoy governing equation
Under the potential flow hypothesis, the velocity potential equation is as follows:

By substituting Eq. (1) with Eqs. (2), (3), and (9), we can obtain the following governing equation:
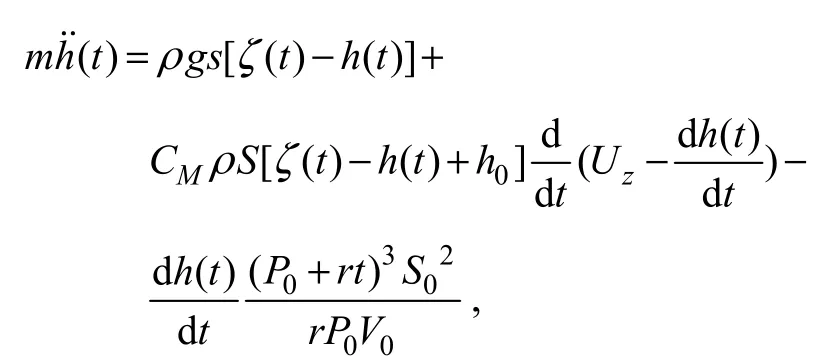
assuming that

We consider the mass of the buoy to be as follows:

The bottom of the buoy will never rise above the water surface, so η(t)/h0<<1 if we suppose the following:

The governing equation then becomes the following:

In the initial state, the buoy is static, so the velocity and displacement are zero.
3 Model Experiment
Here, we describe our physical model experiment of the hydraulic system, which we applied in the combined heaving-buoy WEC. To test the total energy conversion and energy transfer in the whole process, we designed an experiment for two 100-kW combined heaving-buoy WEC prototypes (Fig.3). In these prototypes, there are four buoys on one and five buoys on the other. The energy conversion in the model is the same as that in the prototypes, although the model has only one buoy.
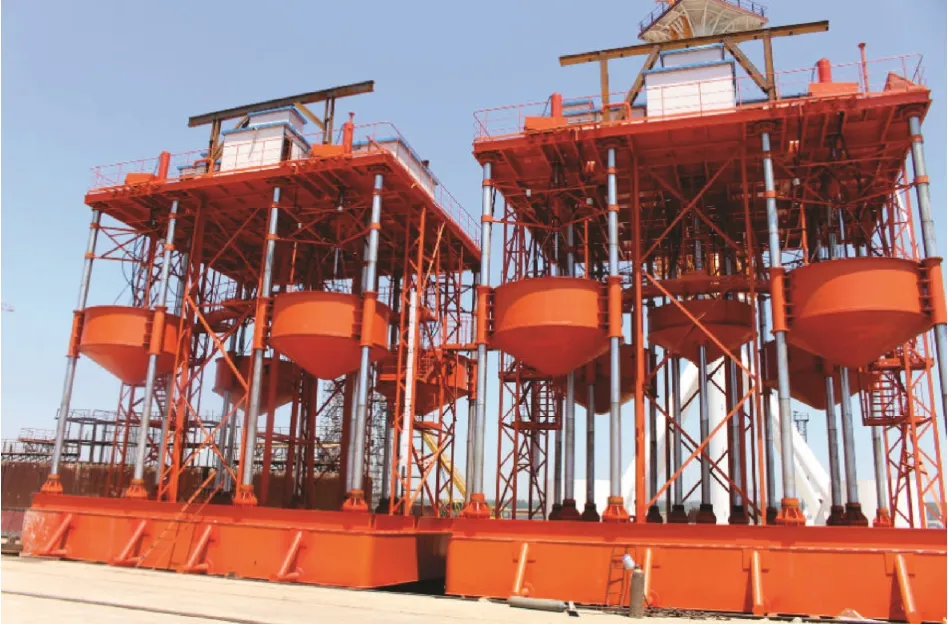
Fig.3 100-kW combined heaving buoy WEC prototypes.
3.1 Model Design
We manufactured the test model at the Ocean University of China. Table 1 lists the model parameters.
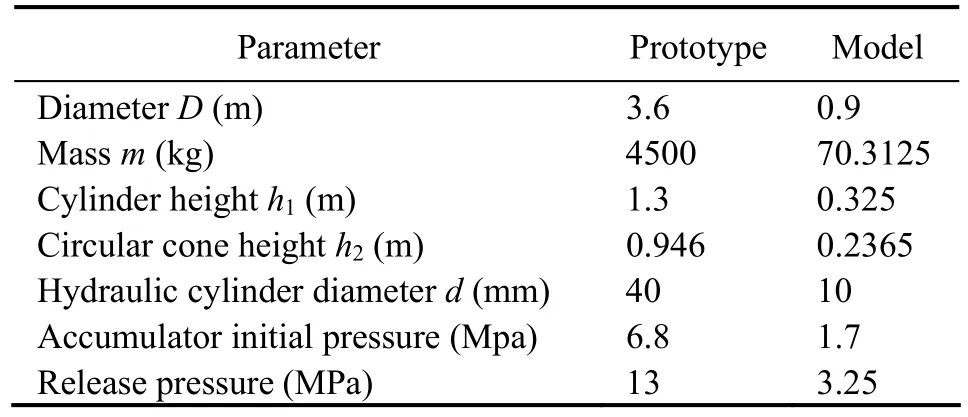
Table 1 Parameters of prototype and model
Fig.4 shows the buoy model, in which the buoy moves along three polished rods with three linear bearings. To reduce the frictional force on the linear bearings, these three polished rods are oriented perpendicular to the pedestal. A displacement sensor (ranging from 0 to 50 cm,accuracy 0.1%) is installed on the top of the rod and is connected to the buoy. The frame is stationed with one platform on the top, which is also connected to the three rods. There is a circular hole in the middle of the platform through which the cylinder and hydraulic pipes are assembled. Clump weights can be placed into the groove in the middle of the buoy to adjust the mass.
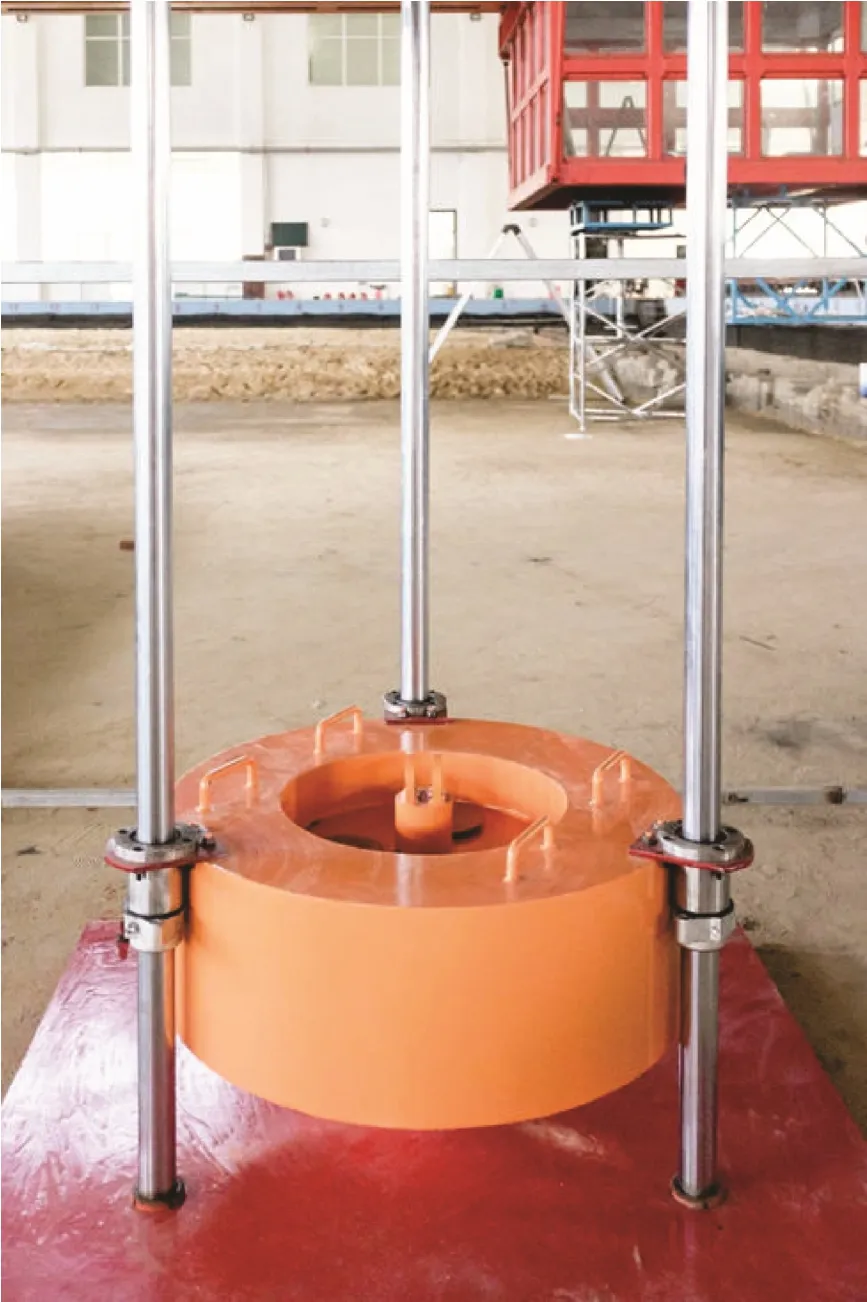
Fig.4 Experimental buoy model.
Fig.5 shows the hydraulic system model, in which there are three accumulators with different initial pressures (1.4 ,1.7, and 2.2 Mpa) that can be used independently via the manifold control. Also, to guarantee measurement accuracy, we used high-precision flowmeters (ranging from 0-3 L min-1, accuracy 0.1%) and pressure meters (ranging from 0-5 Mpa, accuracy 0.1%). These meters monitor the flow and pressure change in real time in the hydraulic circle when the system is in operation. The hydraulic motor is connected to the generator by a torque transducer(ranging from 0-5 N m, accuracy 0.1%) that records the torque and rotation of the motor. To avoid any gas effect in the hydraulic system, we installed an exhaust gas system in the circuit to maintain a low-level gas content. We specially designed the data acquisition equipment and software, with a sampling rate of 100 kHz, to simultaneously collect flow rate, pressure, rotation speed, torque,displacement, and power data.
3.2 Experiment
We conducted the model test in a wave tank, based on the gravity similarity principle, with a length scaling of 1:4. The basin in which we tested the WEC is 60 m long,36 m wide, 1.5 m deep, and is equipped with a multi-di-rectional wave maker and overhead X-Y carriage system.To ensure the stability of the approaching wave, we located the anchorage points 25 m from the wave maker.Fig.6 shows a schematic of the experimental layout, in which we used wave-height meters. In the figure, gauge A records the incident wave height, gauge B records the wave height in front of the device, and gauge C records the wave height behind the device.
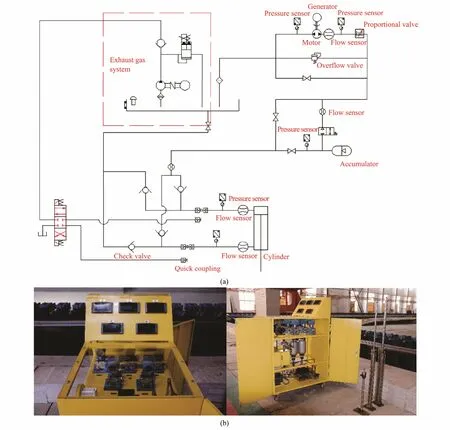
Fig.5 Experimental hydraulic system. (a) Schematic of system process; (b) photographs of the hydraulic system model.

Fig.6 Experimental layout.
To investigate the absorbed power of the WEC and the characteristics of r, in this test, we applied three different initial pressures to the accumulator, which are considered to be the most suitable values for this device. The method for determining the initial pressure of the accumulator is described in the paper by Zhang (2015). The release pressure is the same for all the cases and we applied regular waves in the experiments. The incident waves in coastal north China are sheltered and blocked by an island chain in the Western Pacific. Table 2 lists the wave conditions, based on the typical wave conditions near Qingdao(Shi et al., 2017) and the scale ratio.

Table 2 Wave conditions and initial pressure
3.3 Model Test Results
Energy transfer in the hydraulic system is a two-step process involving energy storage and release. In Eq. (11),r irectly indicates the hydraulic system efficiency because the time required for charging is much longer than that for release. Fig.7 shows the pressure in the accumulator for different initial pressures and wave conditions. As we can see in the figure, the gradient of the curve r is different in different cases. For the storage process, the pressure change rate in the accumulator is nearly constant. In addition, when the initial pressure increases, the change rate shows greater linearity. As shown in the results, the pressure in the accumulator is approximately proportional to the time before release. In Eq. (10), r is the rate of the accumulator pressure with time, which can be obtained in a model test. The fluctuations of the curve caused by the gas in the fluid and electromagnetic interference are more obvious when the pressure is low.
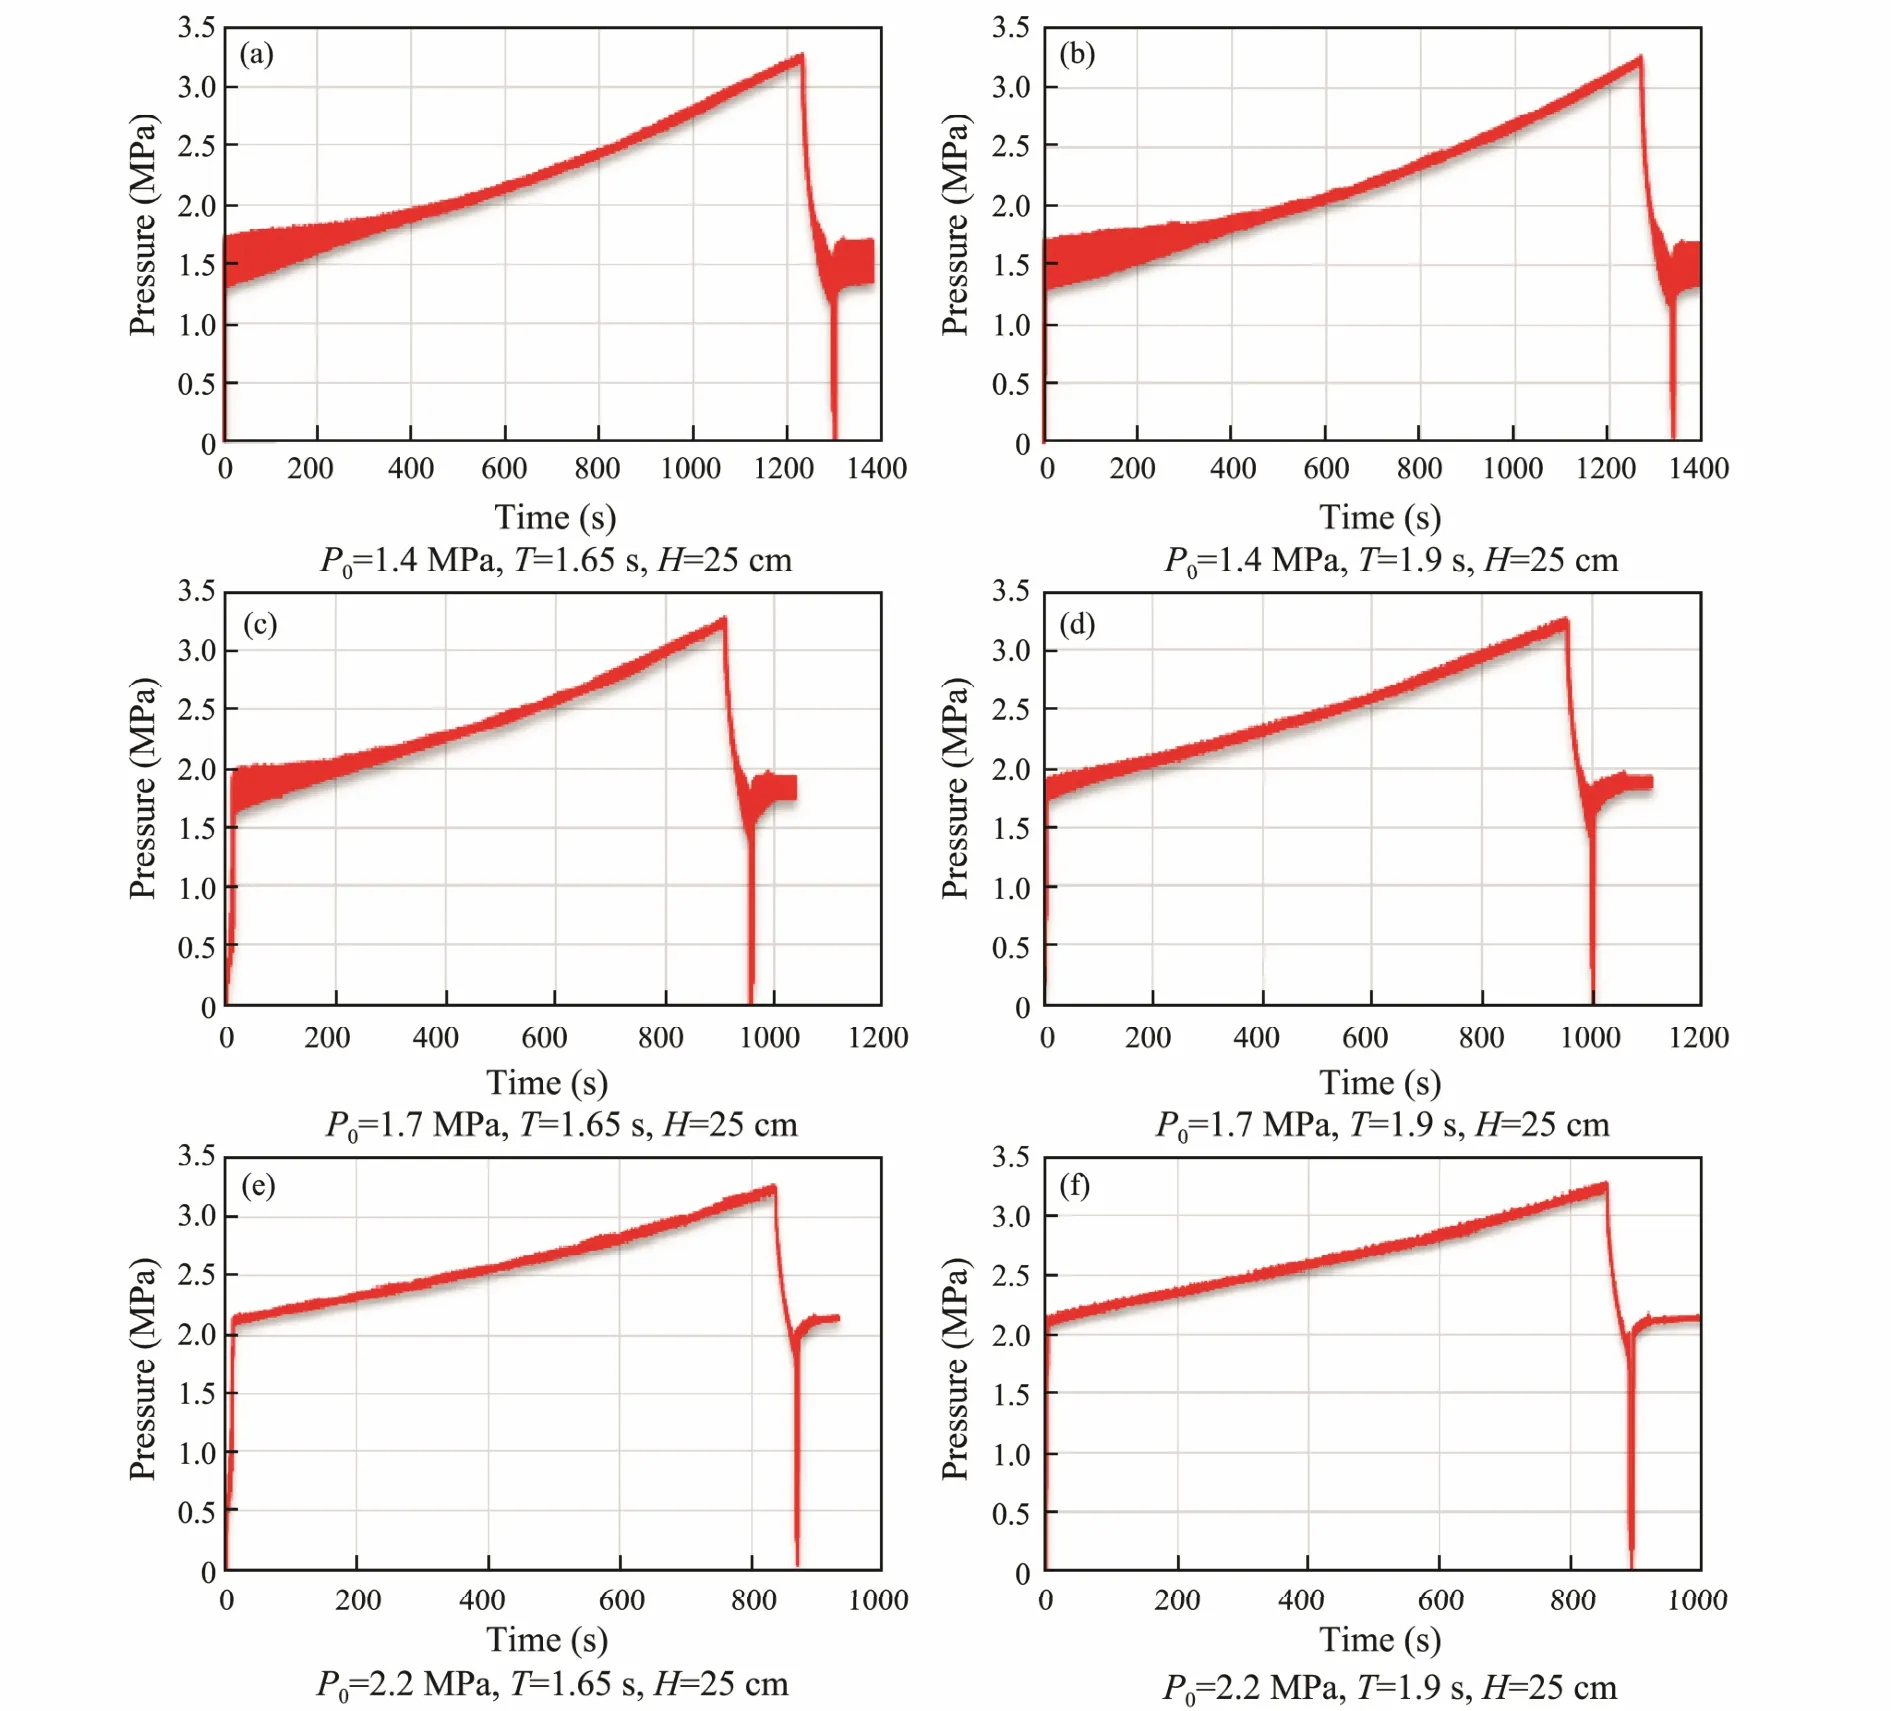
Fig.7 Pressure in the accumulator under different initial pressures and wave conditions.
In the release process, the release time is related to the generator loading. In this test, we set the electric loading to 1000 Ohms, and this remained constant in all cases.The value of r depends on the difference between the initial and release pressures, as shown in Table 3.
Considering that all the energy output is supplied by the accumulator’s discharge, if we ignore any of the losses, the value of r increases with increases in the power of absorption, as shown in Table 4. As such, larger values of r indicate higher efficiency. In Table 3, the value of r is smaller when the wave period is larger, but this does not mean that the WEC performs better with shorter wave periods.Generally, the height of high-frequency waves is small,which means the displacements of the buoy are also small,but when the frequency of the approaching wave is close enough to the intrinsic frequency of the WEC, we obtain the highest efficiency. The initial pressure of the accumulator is another important factor influencing efficiency. In this model system, we found 1.7 MPa to be a suitable value that is almost independent of wave conditions.

Table 3 The value of r under different initial conditions

Table 4 The power absorption under different values of r
4 Numerical Simulation of Effects of Gas Content
4.1 Input Conditions
Fig.8 shows the displacements of the buoy in the model test. Due to the long charging time, we see a distinction only between the opening and closing of the solenoid valves.
In the above cases, when the valve opens (at the end of the charging process), the maximum displacement of the buoy (15 cm) occurs; the minimum displacement of the buoy is related to the internal pressure, as the PTO damping depends on some of the parameters of the accumulator.The difference between the maximum and minimum displacements is not very obvious and the change rate of the displacement is not very high. Here we can replace the initial displacement condition with a sine signal, the amplitude of which is the mean value of the buoy displacement, and the period of which is the same as the wave period.

Fig.8 Displacements associated with the opening and closing of the solenoid valves under different initial pressures.
4.2 Effect of Gas Content
Numerical modeling of this system also has two phases -charging and releasing. When the pressure inside the accumulator reaches the release point, the simulation stops and the accurate time is recorded. We set the parameters to be the same as in the physical experiment.
In applications, hydraulic fluid always contains some gas (most of which is air) that dissolves in the liquid by the formation of bubbles. In the AMESIM model, the gas content is defined as follows:

where Vgis the volume of air inside a liquid under atmospheric pressure at 0℃ and VLis the volume of the liquid under atmospheric pressure at 0℃.
In the charging period, we used this simulation to investigate how gas influences the charging time. We set the gas content of the hydraulic fluid to 1%, 1.5%, 2%,2.5%, 3%, 3.5%, 5%, 6%, 7%, and 8%, and the results are shown in Table 5.
Fig.9 shows the relationship between the power absorption of the accumulator and the gas content.
We can see that the efficiency decreases rapidly when the gas content increases slightly, and that the quickest decrease occurs when the gas content is below 0.9%. If the gas content exceeds 3%, the power absorption remains at a constant low level. The value of 3% is irrelevant to the accumulators and wave conditions. By comparing the model test and simulation results, we see that the gas content should not be more than 1.8%. The releasing step is not as sensitive to the gas content, because it is mainly affected by the generator load. The gas has a lower density and greater compressibility than the fluid.When the volume changes, the gas has more of a reaction than the fluid. Cavitation and the gas-liquid impact brought by the gas can decrease WEC efficiency and even lead to hydraulic system failure. To reduce the gas content,a number of methods can be employed. First, the PTO system should employ a closed-type hydraulic system with a pressurization tank. Gas pressurization can restrain the adverse effect of various gases and guarantee the cleanliness of the fluid to extend fluid life. Secondly, to reduce the number of places with 90˚ bends, the hydraulic pipes should add fixed points of attachment as much as possible. Finally, exhaust gas must be expelled prior to WEC operation.
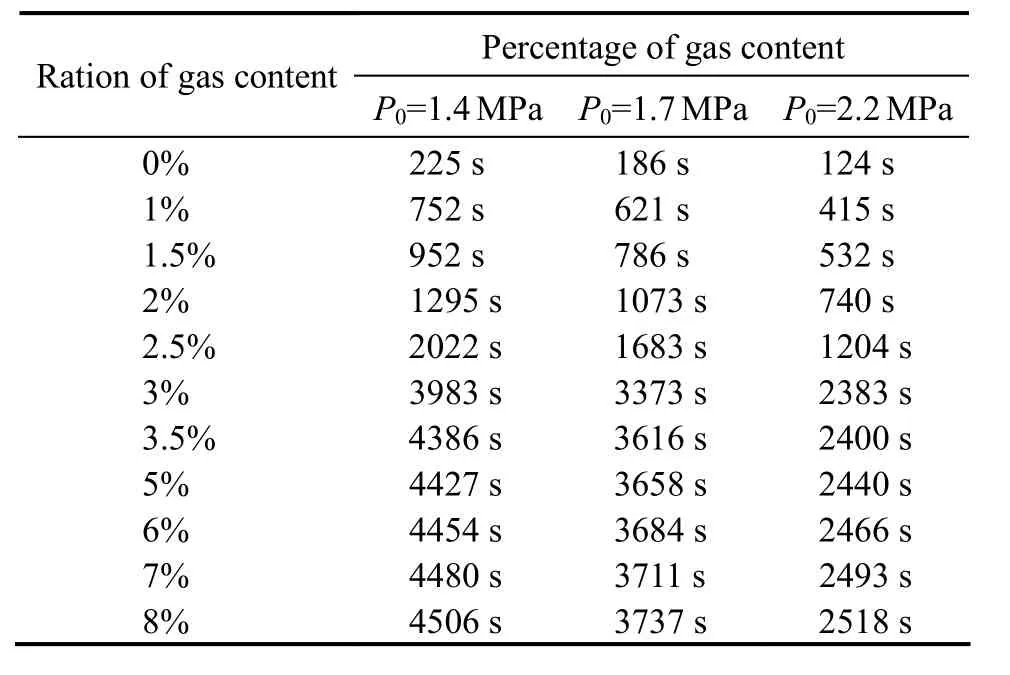
Table 5 The charging time under different gas content ratios and initial pressures
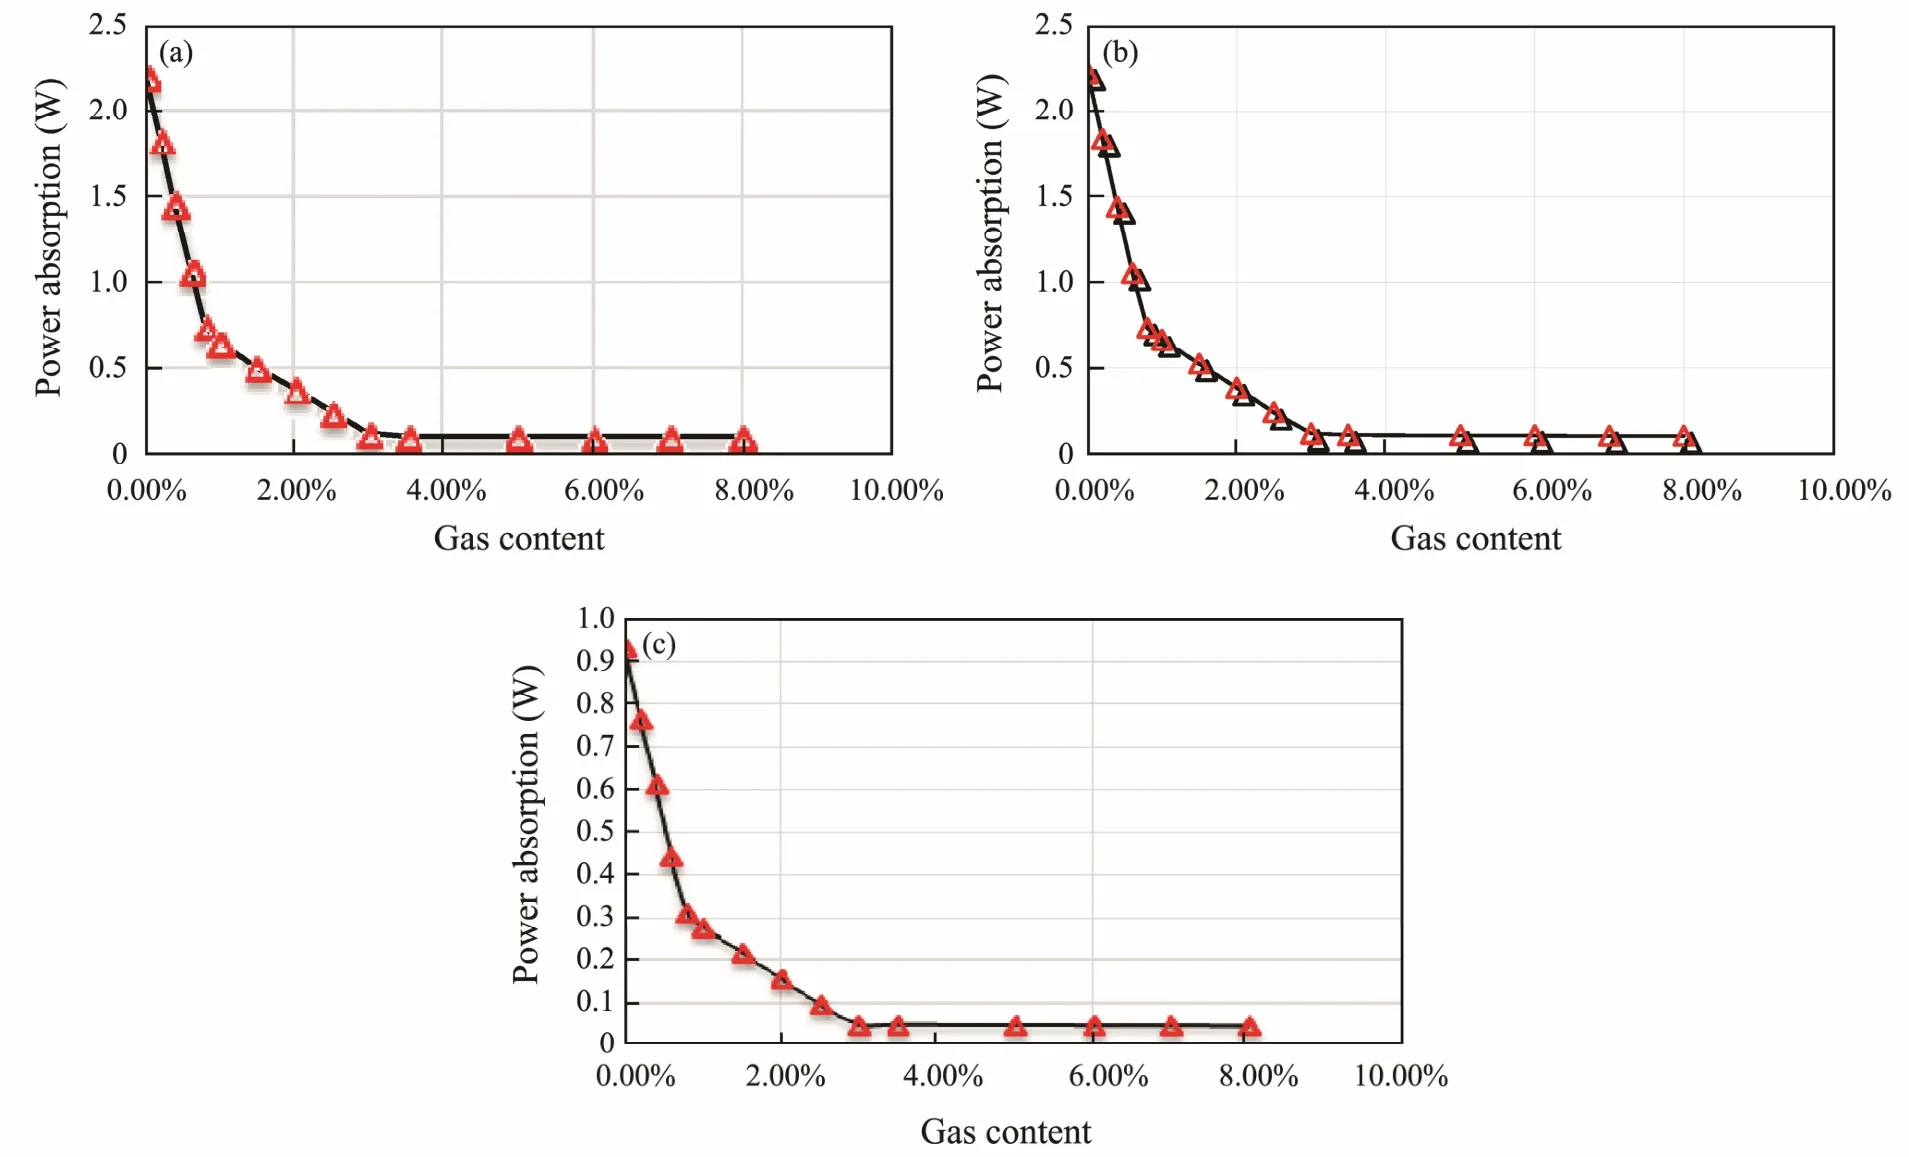
Fig.9 Relationship between gas content and the accumulator power of absorption. (a) P0=1.4 MPa; (b) P0=1.7 MPa; (c)P0=2.2 MPa.
5 Conclusions
In this paper, we theoretically, physically, and numerically investigated the efficiency of a hydraulic system with an accumulator in an oscillating WEC. In our theoretical analysis, we obtained a governing equation that includes a nonlinear expression of the hydraulic resistance. Based on our model test results, we conclude that the pressure change rate of the accumulator can reflect the efficiency of this system, wherein the higher the pressure change, the higher is the efficiency. In our numerical simulation, we found the gas content in the hydraulic fluid to play an important role in the efficiency of the power absorption. When the gas content exceeds 3%, the efficiency will be very low. Further studies should be conducted on the nonlinear PTO and ways to decrease the gas content in hydraulic fluid.
Acknowledgements
The authors would like to acknowledge the support of the Marine Renewable Energy Project (No. GHME2016 YY02), the National Natural Science Foundation of China(Nos. 41376100 and41706100), the Shandong Provincial Natural Science Key Basic Program (No. ZR2017ZA0202),and the Fundamental Research Funds for the Central Uni-versities (No. 201564005).
杂志排行
Journal of Ocean University of China的其它文章
- Effect of Different Dietary Protein and Lipid Levels on the Growth, Body Composition, and Intestinal Digestive Enzyme Activities of Juvenile Yellow Drum Nibea albiflora (Richardson)
- Modelling Wave Transmission and Overtopping Based on Energy Balance Equation
- Extreme Sea Level Rise off the Northwest Coast of the South China Sea in 2012
- Spatial Distribution and Seasonal Variation of Explosive Cyclones over the North Atlantic
- The Influence of Two Kinds of El Niño Events on the Strong Tropical Cyclone Generation and Strength in the Pacific Ocean
- Sea State Bias Estimation with Least Absolute Shrinkage and Selection Operator (LASSO)
