Experimental and simulation of the reactive dividing wall column based on ethyl acetate synthesis☆
2018-08-18JiangweiXieChunliLiFeiPengLihuiDongShuaimingMa
Jiangwei Xie,Chunli Li,2,*,Fei Peng,Lihui Dong,Shuaiming Ma
1School of Chemical Engineering&Technology,Hebei University of Technology,Tianjin 300130,China
2National-Local Joint Engineering Laboratory for Energy Conservation of Chemical Process Integration and Resources Utilization,Tianjin 300130,China
Keywords:Reactive dividing wall column Catalyst loading method Ethyl acetate Simulation Energy saving
ABSTRACTReactive dividingwall column(RDWC) is a highly integrated unitwhich combines reaction distillation (RD)with dividing wall column separation technology into one shell, and it realized the chemical reaction and the separation of multiple product fractions simultaneously. In this paper, the reaction of esterification with acetic acid and ethanol to produce ethyl acetate was used as the research system, experiments and simulations of the RDWC were carried out. This system in the traditional process mostly used the homogeneous catalyst (e.g. sulfuric acid). However, in view of the corrosion of the equipment caused by the acidity of the catalyst, we used the heterogeneous catalysts – iron exchange resins – Amberlyst15 and proposed a novel catalyst loading method. Firstly, the reliability of the model of the simulation was verified by the experimental study on the change of liquid split ratio and reflux ratio. After that, the four-column model was established in Aspen Plus to analyze the effects of the amount of azeotropic agent, reflux ratio and acetic acid concentration. Finally, for a fair comparison, the economic analysis was conducted between traditional RD column and RDWC. The results showed that RDWC can save 34.7% of total operating costs and 18.5% of TAC.
1.Introduction
Distillation is one of the most commonly used separation methods for liquid mixtures in the chemical industry.Although it has a well known benefit and a wide range of applications,one of its shortcomings is significant energy demand[1],and thus brought great economic and environmental penalties.This encourages academia and industry to explore energy-saving strategies for the distillation process.
Reactive distillation is a very promising distillation technology that has been proved in a variety of successful applications[2,3].Its appearance has revolutionized the long-standing scholar's understanding of the reaction and separation.It is the new unit which can realize chemical reaction and the physical separation process in a single column[4].Compared with conventional process,it can remove products formed in the reaction zone of a reactive distillation column,therefore,it has a favorable effect on selectivity and conversion.Previous reports indicate that a lot of reactions can be used in the reactive distillation column.As Luyben and Yu[3]reported in 2009,there are 236 reactions that can be used in reactive distillation in their book published(Fig.1).
The structure of the dividing wall column(DWC)can be traced back to the United States Patent[5]in 1933.However,it has not been paid enough attention for a long time.In the 1970s and 1980s,due to the fluctuations in energy prices,the existing state of affairs of the low thermodynamic efficiency of traditional distillation column urgently needed to change.Moreover,BASF succeeded in the industrialization of the DWC in 1984[1]which also contributed to the renewed emphasis on the DWC.After that,more and more studies have been done on it.The study shows that,compared to the traditional distillation column,the DWC can not only achieve multi-component separation in a single column,but also save 10%to 50%of the energy consumption and 25%to 35%of the equipment investment[6].In recent years,process intensification[7]has gradually become a major trend in chemical engineering,scholars are very interested in carrying out reactions in the DWC,which led to the generation of the reactive dividing wall column(RDWC).

Fig.1.The schematic diagram of a reactive dividing wall column.
After the emergence of the RDWC,scholars have done a lot of research on it.Kenig et al.proposed a novel rate-based model of nonreactive and reactive DWC in 2007[8].And the simulation results show that the RDWC can significantly improve the selectivity of the reaction process.Anton A.Kiss's group reported the application of the RDWC in practice first in 2009[9,10].A novel biodiesel process based on RDWC was proposed in 2012[11],and the optimal con figuration was established by simulated annealing method,which could save up to 25%energy consumption.The dynamic analysis of RDWC was carried out on the basis of rigorous steady state simulation.The results showed that the proposed control structure exhibits excellent performance under the circumstances of industrially relevant disturbances[12].Georg Fieg's group also had done a lot of work on the RDWC.They conducted extensive experimental and simulation studies on RDWC,and taking into account the occurrence of the side reaction in 2016[13].After that,a further study[14]was carried out to propose a semi short cut method to determine the minimum vapor demand of the RDWC and to explain its energy-saving mechanism.Then,the Influence of the separation performance of the reaction system on the energy saving potential was systematically studied[15].Hernandez et al.[16–19]conducted a series of studies on the RDWC.They used the reaction of ethanol and acetate esterification to form ethyl acetate as the system,and carried out the steady and dynamic simulation of RDWC in 2009[17].They found that the RDWC could achieve the set point value in both temperature control loops.
Sun et al.[20,21]proposed a short-cut design method of the RDWC which is based on the Underwood equations.After that,they carried out the steady and dynamic simulation of the RDWC,and the results showed that the RDWC not only had good controllability but also can achieve 20.1%energy savings when compared with the conventional column process.Ye et al.[22]studied the design and control of the RDWC,and optimized by using TAC minimum as the objective function.The results showed that the RDWC,compared with the conventional column,can save energy consumption by 12.4%and the TAC by 16.4%.Thereafter,they proposed a novel RDWC process for producing isobutyl acetate by transesterification[23].Yuan et al.proposed a new process for the selective hydrogenation of C3 stream in ethylene plant by using RDWC[24],and also studied on its control system[25,26].
Through the above description we can see that there is only one report on the practical application of the RDWC.The purpose of this work is to investigate the operational performance of the RDWC and the feasibility of preparing ethyl acetate in the RDWC.Firstly,the Influence of the liquid split ratio and reflux ratio was studied experimentally.In parallel with the experiment,the Computer Aided Software,Aspen Plus 7.2,was used to simulate the effect of the amount of azeotropic agent,the reflux ratio and the acetic acid concentration using a four column model.Finally,for a fair comparison,the economic analysis was conducted between the traditional reactive distillation column and the RDWC.
2.Experimental
2.1.Pilot plant
Our laboratory has been working on the research of the distillation column,which involves the design,optimization and control of the traditional distillation column and the non-RDWC[27–29].
A pilot plant for the RDWC was set up in our laboratory.The photo and the schematic diagram were depicted in Fig.2.It can be seen from the picture that the space on the two sides of the dividing wall is replaced by two straight parallel pipe sections which were connected at both ends. This was chosen due to the small diameter. Another reason is that the heat transfer across the dividing wall is not considered in the study.
The total height of the pilot plant is 4000 mm.It is made of 316L stainless steel except for the feeding equipment and condensing device made of glass.The column is divided into three parts.The upper and lower parts of the column have an inner diameter of 41mm and a heightof packing of 600 mm and 500 mm,respectively.The dividing wall part is divided into feed section and side section.Each section has the height of packing of 1500 mm.The feed section is divided into non-reactive zone and reactive zone.The side section and the non-reactive zone of the feed section have an inner diameter of 28 mm.The reactive zone of the feed section has an inner diameter of 38mm. The random packingused in this work is Dixon with a size of 3 mm × 3 mm.
In addition to the actual distillation column,the set-up includes the column shell,condenser,reboiler,three heat exchangers(W1–W3), five tanks(V1–V5)for the liquid phase and two peristaltic pumps(P1–P2).The liquid split ratio is realized through a funnel controlled by a solenoid valve moving from one side to the other.
In order to analyze the performance of the column,many Pt 100-sensors are used for the temperature measurement which has an accuracyof±0.5°C.The pressure is measured bya U-tube manometer filled with water.The composition of the samples was obtained by Shimadzu GC-2014 chromatography.
We also built a device for measuring pressure drop and the detailed information was shown in Fig.3.The height of the packed bed is 1.2 m,and the inner diameter the column was 38 mm.It contains ten catalyst beds.
2.2.Chemicals and catalyst
In this work,the reaction of esterification with acetic acid and ethanol to produce ethyl acetate was used as the research system.
Heterogeneously catalyzed reactive distillation has many advantages compared with the homogeneously catalyzed process con figuration.For example,the former can not only adjust the location and size of the catalyst but also reduce the corrosion of the equipment caused by the catalyst(e.g.,sulfuric acid).In addition,it also can avoid the separation of the homogeneous catalyst from the bottom product.Because of these advantages,we chose the strongly acidic ion exchange resin Amberlyst™15Dry as the catalyst for this reaction and filled with 0.15 kg in the reactive zone.
A novel catalyst loading method was proposed in this work,which is similar to the SCPI structure developed by Tianjin University [30,31]. As can be seen in Fig. 4, the catalyst is alternately distributed on the left and right sides of the reaction zone in the vertical direction and is separated from the packing in the same location in the horizontal direction by the dividing wall.

Fig.2.The reactive dividing wall column used in this work.

Fig.3.Schematic diagram of experimental device for pressure drop measurements.
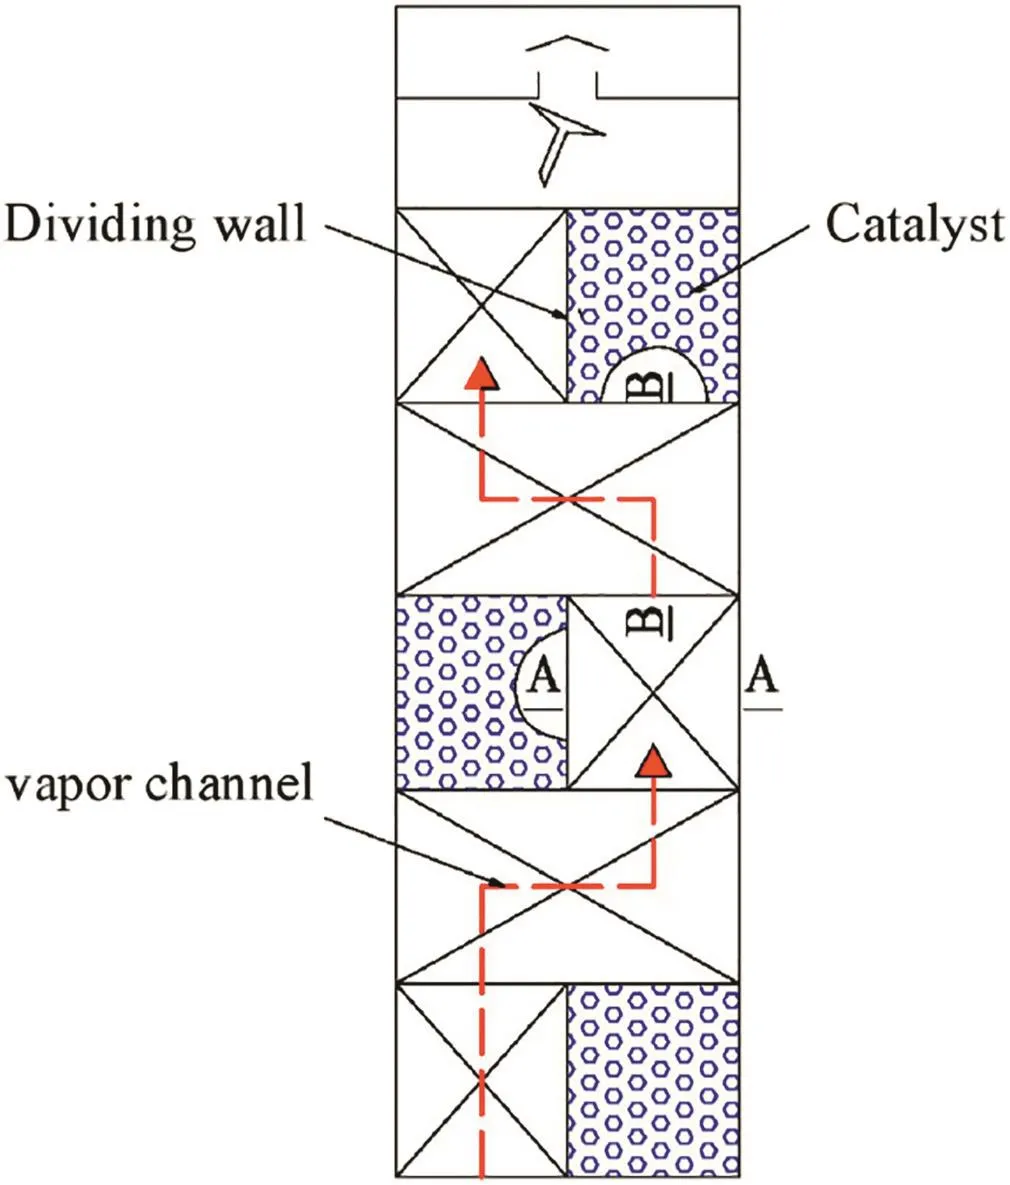
Fig.4.Schematic diagram of catalyst loading inside the reactive zone.
For this catalyst loading method,the processes of the reaction and separation are conducted alternately.The liquid phase reaction is conducted in the catalyst bed.And the heat and mass transfer of the gas–liquid countercurrent flow is conducted in the separation section.The liquid flows downward,driven by its own gravity,uniformly through the packing and catalyst bed.This can avoid the problem of slow renewal of the catalyst surface due to the lateral diffusion of liquid to the surface of the catalyst.Gas flows upward from the bottom,bypassing the reaction section,into the upper separation section.It can avoid contact between the gas and liquid in the catalyst bed and can reduce the pressure drop of the column.
As is shown in the picture A-A cross-section is semicircular(see Fig.5)and is expressed as:


Fig.5.The schematic diagram of A-A(A2=πD2/8)cross-section and B-B(A1=HD)cross section.
And B-B cross-section is rectangular(see Fig.5)and is expressed as:

where D is the diameter of the prefractionator,m,H is the height of the rectangle,m.
As can be seen from Figs.4–5,there is a certain distance(H)between the catalyst beds,which not only provides channels for gas phase(red dashed line)but also avoids the contact between gas and liquid in the catalyst bed,thus reducing the pressure drop of the column greatly.Therefore,the distance(H)between the catalyst beds is an important parameter that affects the pressure drop.In addition,the distance(H)between the catalyst beds also affects the internal structure of the column,which affects the hydrodynamic performance of the column,and then affects the separation performance of the column.Therefore,it is necessary to study the parameter of the distance(H)between catalyst beds.However,the focus of this paper is to investigate the operational performance of the RDWC and the feasibility of preparing ethyl acetate in the RDWC,so only two different distances are selected to carry out the related experiments.

2.3.Kinetic model and thermodynamic model
2.3.1.Kinetic model
The reaction being used in this study was shown below:

In order to avoid the problem of corrosion and re-separation caused by the homogeneous catalyst,the heterogeneous catalyst Amberlyst™15Dry was chosen to be used in this work.The kinetic equations for this reversible reaction can be expressed as follows[32]:

where r is the rate of the reaction involved in the esterification of HAc and EtOH,kmol·s−1,k±1is preexponential factor,kmol·and a is the activity.
2.3.2.Thermodynamic model
In this paper,due to the presence of azeotrope,the phase equilibrium of the whole system was very complex.Because of the strong nonideality and the presence of gas–liquid–liquid equilibrium(VLLE)of the system,the NRTL-HOC thermodynamic model was used to estimate vapor–liquid equilibrium with liquid activity coefficients calculated by the NRTL model and the Hayden and O'Connell[33]method was used to calculate the dimerization and trimerization in the vapor phase.The NRTL binary interaction parameters in the Aspen Plus were shown in Table 2.The simulated and experimental boiling point rankings for pure components and the azeotropic information were shown in Table 1.The results of the experiment and simulation were in good agreement.

Table 1 The azeotropic compositions and temperatures of the mixture
3.Experimental Column Operation
The HETP of the column was determined by the ideal mixture of ethyl alcohol absolute and n-butanol.The experimental device parameters of RDWC were shown in Table 3.
Before the test process starts running,the mixture of 4 L Acetic acid(99.8wt%),2 L N-butyl acetate(72 wt%)and water(28 wt%)was added to the column bottom.Afterwards,the electrical heating was turned on.Because the boiling point of n-butyl acetate and water binary azeotrope was minimal,it was the first to vaporize.When the binary azeotropic mixture vapor rose to the position of the liquid splitter,the feed stream switch was opened and fed at a certain ratio.When the temperature at the column to preached the final steady stateoperation value,the distillate stream switch opened.The re flux stream was used to control the temperature at the column top.Then,the switch of the side stream was turned on,and the final value was adjusted gradually.Once the temperature at the column bottom reached the final steady state operation value,the switch of the bottom stream was opened.When all the temperatures reached the set value,the system went into a steady state.
During the Case1 experiments,the vent of the condenser was connected with the atmosphere.The reactive zone was from stages 6 to 14(Table 3).At this point,the A-A cross-sectional area(A2)was equal to the B-B cross-sectional area(A1).Both the mass flow rate and the composition of the two feed streams were changed slightly.There boiler duty was changed from 0.3 to 0.6 kW,and the liquid split ratio was changed from 0.4 to 0.6.The liquid split ratio in this work was defined as the ratio of the total amount of liquid towards the pre-fractionator at the top of the dividing wall.The vapor split ratio in this work was defined as the ratio of the total amount of vapor towards the prefractionator at the bottom of the dividing wall,and the vapor split was self-adjustable.
During the Case2 experiments,the vent of the condenser was connected with the atmosphere as well.The reactive zone was from stages 2 to 14(Table 3).At this time,the A-A cross-sectional area(A2)was twice as much as the B-B cross-sectional area(A1).The remaining parameters varied in the same range,except for the range of the liquid split ratio(0.33–0.54).
4.Results and Discussion
4.1.Model validation
In the present work,we used the four-column model(Fig.6)for steady-state simulation in Aspen Plus,the same operating conditions were entered as the experiment during the simulation process(Table 3).The compositions of the distillate,side product and bottom stream were shown in Table 4.

Fig.6.The schematic diagram of four-column RDWC model.
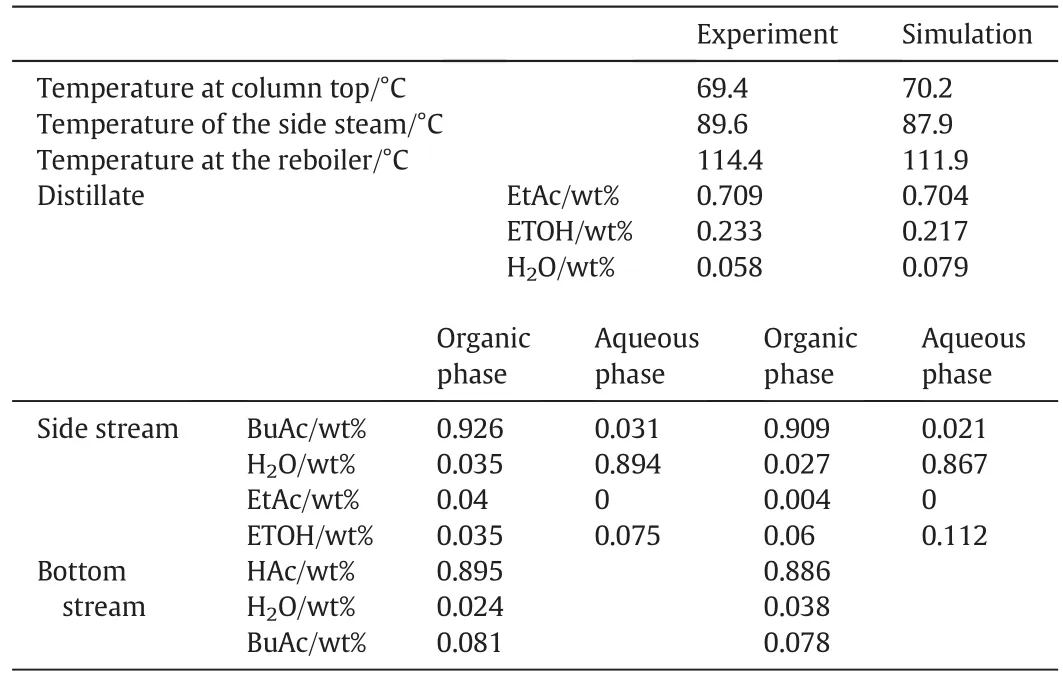
Table 4 The experimental values and simulation results of the reactive dividing wall column
As for the experiments of Case1 and Case2,the detailed information about temperature profiles was present in the simulation results.As can be seen in Table 4 and Figs.7–8,the experimental data and simulation results agreed well.

Fig.7.Experimental and simulated temperature pro file of RDWC(Case1).

Fig.8.Experimental and simulated temperature pro file of RDWC(Case2).
4.2.Experiment results
4.2.1.Pressure drop

Fig.9.Dry pressure drop compared between Case1 and Case2.
As can be seen from Fig.9,the dry pressure drop of both Case1 and Case2 was nearly the same.However,the dry pressure drop of Case2 was a little lower than the dry pressure drop of the Case1.As shown in Figs.10–11,the difference of pressure drop between Case1 and Case2 was more obvious.The reason is that the increase of H reduces the resistance of the gas phase to bypass the catalyst bed.

Fig.10.The experimental results for pressure drop of Case1.

Fig.11.The experimental results for pressure drop of Case2.
4.2.2.Effect of liquid split ratio(RL)
It can be clearly seen from Figs.12 and 4–5,when the H was different,the optimal performance point of the RDWC was changed.The optimal liquid split ratio value was changed from 0.57 to 0.43.The reason is that the change of the loading position of the catalyst makes the structural parameters in the reactive zone change,which leads to the change of vapor–liquid contact in the pre-fractionator.Therefore,the optimum countercurrent contacting conditions of the reactants in the reaction zone are obviously more important for the process.
4.2.3.Effect of re flux ratio
As shown in Fig.13,the ethanol conversion was optimal when the value of re flux ratio was equal 4.Because the boiling point of ethanol is lower than that of acetic acid and n-butyl acetate,it is easy to reach the upper part of the column.When the re flux ratio is relatively small,the unconverted ethanol at the column top is distill ated with the product,resulting in a decrease in conversion.However,when the re flux ratio is greater than 4,the ethanol conversion also decreases with the increase of the re flux ratio.The reason is that ethyl acetate is a product of there action,and when a large amount of ethyl acetate is refluxed into the reaction zone,an increase in the concentration of ethyl acetate causes an increase in the rate of the reverse reaction,resulting in a decrease in the conversion of ethanol.

Fig.12.The relationship between liquid split ratio(RL)and ethanol conversion.

Fig.13.The ethanol conversion and heat duty vary with the re flux ratio.
It can also be seen from Fig.10,the heat duty increases with the increase of the re flux ratio.This is because when the re flux ratio increases,the amount of re flux on the top of the column increases,then the vapor–liquid load in the column increases.
So far,the results had not shown the required ethyl acetate purity and the wanted ethanol conversion.A little ethanol was always contained in the distillate.One of the important reasons is that the reactive zone is still too short.Therefore,the next step is to increase the height of the reaction zone,and lay a solid foundation for further experimental research in this area.The experimental and simulation results are in good agreement,which shows that the device will definitely appear in the industry.So it can be expected that this con figuration will certainly be industrialized in the near future.
4.3.Simulation results
In this section,the mass concentration of ethanol and acetic acid was 95%and 85%,respectively.The flow rate of ethanol was 100 kmol·h−1,and the molar ratio of acetic acid to ethanol was 1.2.Based on the experimental results and the references[2,20],the theoretical stage number of each part of the reactive dividing wall column was determined.Table 5 showed the detailed information of the column in which the number of stages increases from the top to the bottom.

Table 5 The simulated parameters of reactive dividing wall column
All simulations were performed using the RADFRAC model based on a rigorous equilibrium phase model for solving the MESH equation in the computer aided simulator Aspen Plus,version 7.2.
4.3.1.Effect of acetic acid concentration
The detailed information on the acetic acid concentration and the amount of azeotropic agent,ethanol conversion,and heat duty was shown in Fig.14.The results showed that when the water content in the raw acetic acid was higher,the amount of azeotropic agent was increased.It is because the water is a product of the reversible reaction according to Eq.(3).In order to,therefore,improve the positive reaction rate,the more azeotropic agent is required to remove the water from the reaction zone.

Fig.14.The effect of acetic acid raw material purity.
Basedon Fig.14,it was found that,as the concentration of acetic acid increases,the ethanol conversion increased.This is because the increase in the stoichiometric ratio of acetic acid and ethanol increases the ethanol conversion.
The heat duty decreased with increasing acetic acid concentration.One of the reasons is that the boiling points of EtAc,binary azeotrope EtAc–H2O and ternary azeot rope EtAc–EtOH–H2O are 77.20 °C,71.61 °C,and 70.5 °C,respectively,all of them belong to the low boiling point“components”.Another important reason is that the increase of acetic acid concentration increases the amount of ethyl acetate generated in the reaction zone.The increased ethyl acetate can remove more water from the reaction zone,thus reducing the re flux of the top ethyl acetate.
4.3.2.Effect of the amount of azeotropic agent(BuAc)
As can be seen from Fig.15,with the increase of the amount of azeotropic agent the ethanol conversion increased first and then decreased.Although the heat duty decreased with the amount of azeotropic agent(BuAc),the amount of azeotropic agent cannot be increased without restriction.Because,as the optimal value of the amount of azeotropic agent is exceeded,the re flux flow is too low to meet the sharp split of the light components(EtAc,binary azeotrope EtAc–H2O and ternary azeotrope EtAc–EtOH–H2O)and heavy component(HAc)in the prefractionator,resulting in the acetic acid entering into the main column.Because of the loss of acetic acid,the ethanol conversion begins to decrease.

Fig.15.The relationship between the amount of azeotropic agent and reflux ratio,the heat duty and the ethanol conversion.
The results also showed that the heat duty and the re flux ratio decreased with the increase of the amount of azeotropic agent.There as on is that the added amount of azeotropic agent can remove more water from the reaction zone,which can reduce the amount of re flux of the top ethyl acetate.Therefore,both the re flux ratio and the heat load are reduced.
The relationship between the re flux ratio and the mass fraction of ethanol in the side stream and the ethanol conversion was shown in Fig.16.When the re flux ratio was too small,the separation of the light component from the intermediate component was no longer clear and the mass fraction of ethanol of the side stream is increased.When the re flux ratio is too large,a large amount of ethyl acetate was re fluxed into the reaction zone to reverse the reaction,the ethanol conversion was reduced.This result corresponded to the above experimental results(Fig.13).Fig.16 illustrated the mole fraction distribution of the RDWC.As can be seen from Fig.17,this con figuration eliminates the remixing phenomenon and improved the thermodynamic efficiency.

Fig.16.Effect of the re flux ratio on the amount of ethanol in the side stream and the ethanol conversion.
4.3.3.Economic evaluation
Under the same feed conditions,RD and RDWC were economically evaluated with an annual out put of 10000tons of ethyl acetate as a constraint.Tables 6 and 7 showed the accounting based and the accounting results,respectively.The results showed that the RDWC column can save 34.7%of the total operating costs and 18.5%of the TAC.

Fig.17.The mole fraction distribution of the reactive dividing wall column.
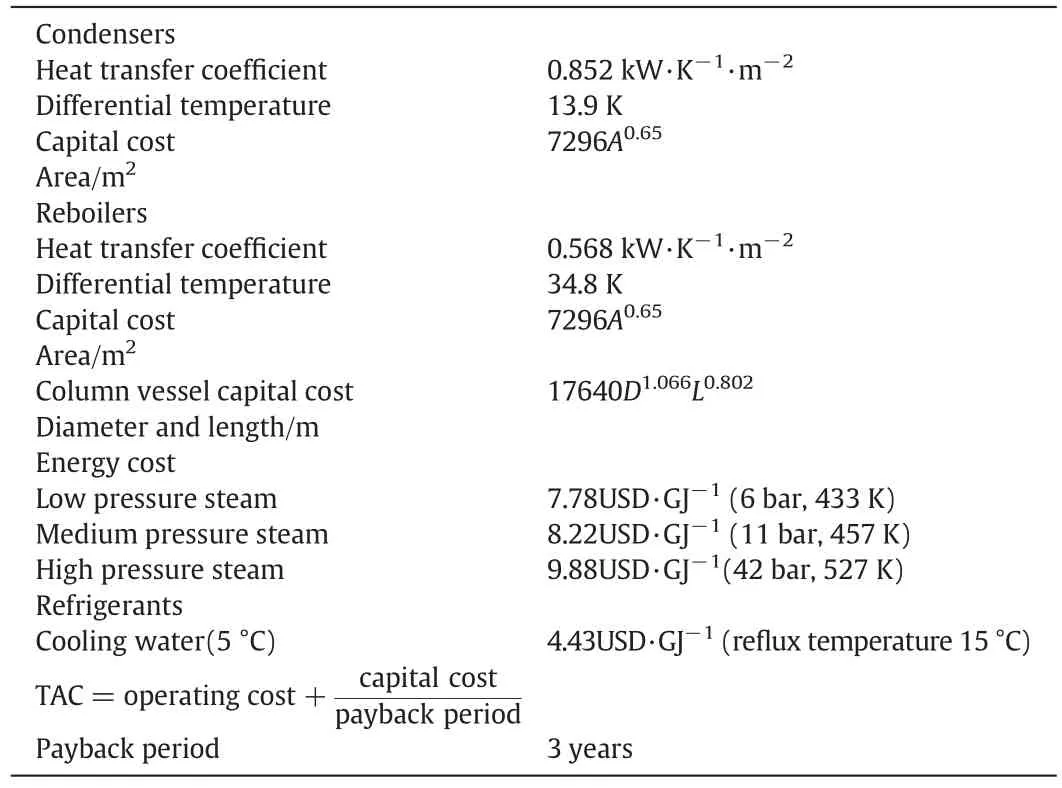
Table 6 Basis of economics[34]

Table 7 Economic comparison between the conventional RD process and reactive dividing wall column
5.Conclusions
In this paper,the reaction of esterification with acetic acid and ethanol to produce ethyl acetate was used as the research system,experiments and simulations of the RDWC were carried out.
The reliability of the model of the simulation was verified by the experimental study on the change of liquid split ratio and re flux ratio.It was found that the RDWC con figuration not only can be used for synthesis of ethylacetate but alsoprovidesa newidea for the co-production of ethyl acetate and butyl acetate.
A novel catalyst loading method was proposed.The structural parameter H has an optimal value to achieve the optimal contact between the gas and liquid phase reactive section of the column.
Finally,for a fair comparison,the economic analysis was conducted between traditional reactive distillation column and the RDWC.The results showed that the RDWC can save 34.7%of total operating costs and 18.5%of TAC.
Nomenclature
A area,m2
a the activity
BuAc n-butyl acetate
BuOH butanol
EtOH ethanol
EtAc ethyl acetate
F gas phase loading factor,Pa0.5
H height,m
k±1preexponential factor,kmol·
mcatmass of catalyst,kg
NFEtOHthe feed position of ethanol
NFHActhe feed position of acetic acid
NMCnumber of theoretical stages of main column
NRnumber of theoretical stages of common rectifying section
NRZnumber of theoretical stages of reactive zone
NSnumber of theoretical stages of common stripping section
RL liquid split ratio
RV vapor split ratio
r the rate of the reaction,kmol·s−1
TAC total annual cost
Subscripts
cat catalyst
EtOH ethanol
HAc acetic acid
MC main column
PF prefractionator
R rectifying
RZ reactive zone
S stripping
杂志排行

Chinese Journal of Chemical Engineering的其它文章
- High efficiency production of ginsenoside compound K by catalyzing ginsenoside Rb1 using snailase☆
- Selective aerobic oxidation of p-cresol with co-catalysts between metalloporphyrins and metal salts☆
- Degradation and mineralization of aniline by O3/Fenton process enhanced using high-gravity technology☆
- Three-liquid-phase extraction and separation of V(V)and Cr(VI)from acidic leach solutions of high-chromium vanadium–titanium magnetite☆
- Insight into the degradation mechanism of cefixime under crystallization condition☆
- Modeling investigation of geometric size effect on pervaporation dehydration through scaled-up hollow fiber NaA zeolite membranes☆