Enhanced Terahertz Fingerprint Detection beyond Refractive Index Sensing in a Periodic Silicon Waveguide Cavity
2018-07-27BeiZhuandZhanghuaHan
Bei Zhu and Zhanghua Han
Abstract—Resonance shifting due to refractive index changes is used quite often in terahertz sensing, but it does not show the advantages of substance identification of terahertz technology. Different from that approach,we explored the use of a cavity to enhance the sensitivity of terahertz sensing while retaining the original capability of substance identification. The defect mode of a one-dimensional photonic crystal cavity composed of periodic holes etched into a silicon wire waveguide was investigated for this purpose. The resonance of the defect mode was designed to match one characteristic absorption frequency of the sample. Due to the high dependence of the defect mode transmission on the material loss, the transmission sensitivity to the quantity of target was amplified significantly. The detection of αlactose was used as an example, which demonstrates steady detection with its thickness of a few microns.
1. Introduction
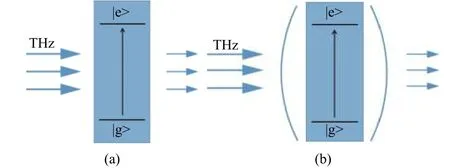
Terahertz defined as the frequency range from 0.1 THz to 10.0 THz (1012cycles per second) is one of the most promising spectral regions which has been less explored in the electromagnetic spectrum. Terahertz photonics is an extremely attractive research field in recent years[1], because it can be used in many practical fields, such as security monitoring[2],biomedical diagnosis[3]-[5], and terahertz imaging[6],[7]and communications[8],[9]. Especially, many chemical molecules have their characteristic absorption frequencies located in the terahertz regime, which means terahertz technology can play a unique role in the identification and detection of these molecules by observing the characteristic absorption frequencies of different materials[10]-[12]. This technique, usually referred to as terahertz fingerprint detection, is one of the most promising applications of terahertz technology. To date, most of the terahertz fingerprint detection uses the traditional transmission scheme, where terahertz radiation propagates through the bare sample and the transmitted power is normalized to that through air, as Fig. 1 (a)illustrates. Terahertz radiation propagates through the sample and gets absorbed when its photon energy matches the difference between two energy levels (|e> and |g>) of the sample. By observing the resonances and their drops in the transmission spectrum, the sample can be identified and its quantity can be evaluated. If the reflections at the sample surfaces are neglected,the transmittance can be simply modelled by the equation[13]:

wherek(ω) is the imaginary part of the sample complex refractive index and it reaches its spectrally local-maximum at the characteristic frequency,Lis the thickness of the sample, andλ0is the free space wavelength of the characteristic frequency. However, due to the small values ofk(ω) at the absorption resonances for most samples and the large values ofλ0at the terahertz frequencies, the absorption is weak and the required sample thickness is large to achieve an observable decrease in transmission for an effective identification. For example, in pharmaceutical applications,the sample is normally made into powder and then compressed into pellets with the thickness and diameter of a few millimeters[14]. However, there are still many circumstances where the sample thickness should be limited to the nanometer or micrometer level, e.g. in medical diagnosis. Then, an improved terahertz sensing device with an ultrahigh sensitivity is required, while the capability of substance identification using terahertz spectroscopy should be retained.

Fig. 1. Schematic diagrams for terahertz fingerprint detection using (a) a regular transmission mode by identifying the transmission drop at the resonance and (b) a cavity structure with the detect mode to enhance the sensitivity.
2. Design and Structure
If the length of the sample can be replaced by an effective valueLeffwhich is much larger than the physical lengthL, the transmittance will then be switched to

then a transmittance highly deviated from unity can be expected at the characteristic frequency. Inspired by this idea, one can see that the target sample can be placed into a cavity as shown in Fig. 1 (b). Two conditions should be fulfilled for this cavity. Firstly, the defect mode of the cavity structure should be spectrally matched with the characteristic frequency of the sample so that the absorption is spectrally at its maximum. Secondly, the quality factor of the defect mode should be high; then the terahertz radiation at this frequency will have a longer lifetime to interact with the target sample, leading to an effective sample lengthLeffmuch higher thanL. With these two conditions, the sensitivity of the terahertz fingerprint detection can be significantly increased and its capability of substance identification is retained as well, because the cavity is designed to work at exactly the same characteristic frequency of the target sample. It is not of our interest that the refractive index sensing in the means of resonance shifting as a function of refractive index when a new sample is introduced, which cannot realize the functionality of substance identification associated with terahertz spectroscopy, since the same resonance shift may result from a thinner sample with a higher index or a thicker sample with a lower index, and has no information revealing the absorption frequency of the sample.
We further demonstrate the enhancement of terahertz fingerprint detection using an on-chip photonic crystal (PC)cavity as an example, which is composed of periodic holes etched into a silicon wire waveguide working in the terahertz regime. The absence of the central hole leads to a peak in the transmission spectrum through this PC waveguide, and the peak resonance can be adjusted to match the characteristic absorption frequency of the target sample.α-lactose with its absorption at 0.529 THz is used as the example and when it is deposited over the cavity area on the waveguide, the transmission of the peak will experience a drop whose amplitude is affected by the thickness, which can be found in[17]. Therefore,α-lactose with the thickness of a few microns can be easily detected using this approach.
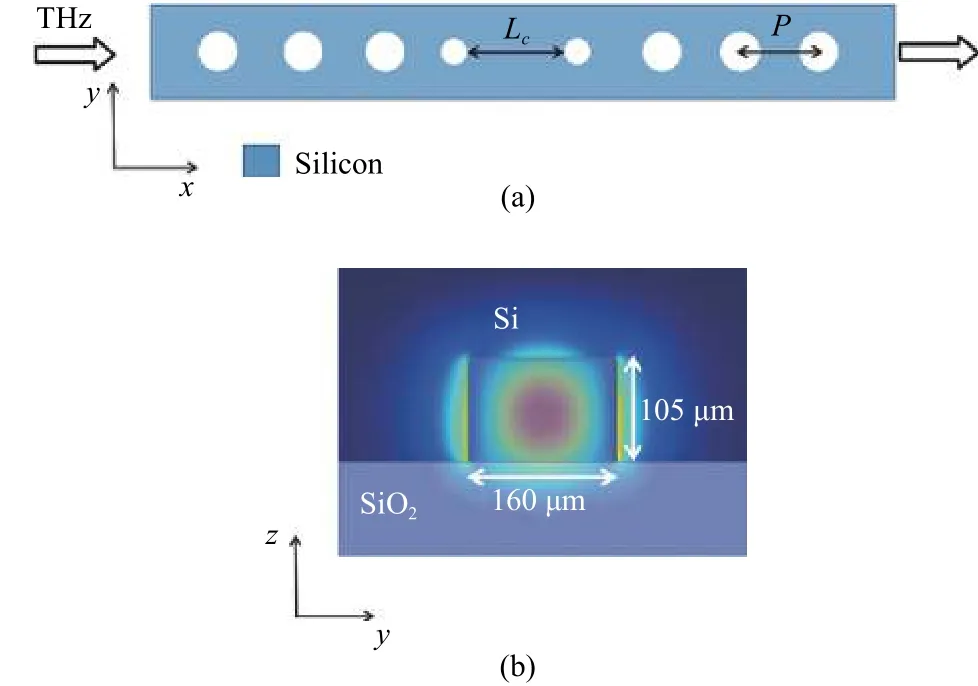
Fig. 2 (a) illustrates the schematic of the PC cavity structure, which consists of a silicon strip with a refractive index of 3.418, height of 105 μm, and width of 160 μm,respectively, on a quartz-crystal substrate whose refractive index is 2. The structure can be made by bonding a mechanically polished 105 μm-thick silicon wafer to quartz using a thin layer of epoxy. An array of periodic air holes with a periodicity ofP=250 μm is etched through the silicon layer while the central hole is removed to form a cavity along the propagation direction. To match the absorption of lactose, the length of cavity,Lc, can be adjusted to tune the spectral position of the defect mode and is found to be 371 μm when the defect resonance is at 0.529 THz. When terahertz radiation propagating along the Si waveguide arrives at the defect area, it will experience roundtrip reflections to form the Fabry-Perot type of cavities. The radius is 30 μm for the outmost six air holes and 20 μm for the two adjacent holes to the defect, to reduce the side lobes in the transmission spectrum. This kind of design has been well investigated in the communication band[15]. The finite-difference time-domain (FDTD) method is used to numerically investigate the characteristic of this cavity.The TE eigen mode of the waveguide with the electric field along theydirection is used for the excitation. The mode profile is shown in Fig. 2 (b). The transmittance is defined as the power in the Si waveguide after the cavity area normalized to that before the cavity.

Fig. 2. Schematic of the waveguide cavity: (a) top view of the PC cavity composed of periodic air holes etched into a Si waveguide with Lc=371 μm and P=250 μm and (b) mode profile of the TE mode propagating in the Si waveguide.
3. Results and Discussion
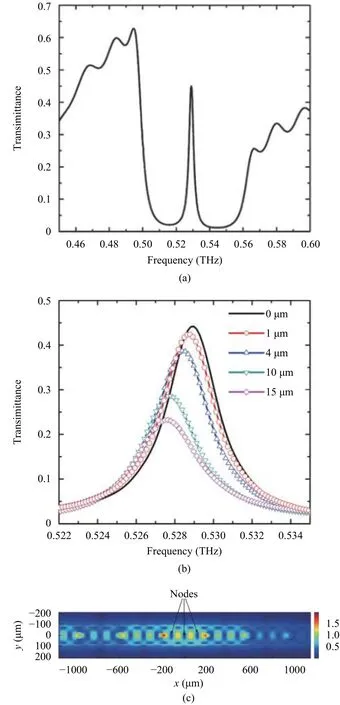
The transmission spectrum of the cavity structure withoutα-lactose is plotted in Fig. 3 (a). One can see the presence of the defect mode at 0.529 THz in a large bandgap between 0.50 THz and 0.56 THz. An enlarged spectrum around the resonance is shown as the black line in Fig. 3 (b), which shows that the resonance features a transmittance around 45% and a half-width at half-maximum (HWHM) bandwidth of 1.6 GHz.The distribution of electric field amplitude at the centralx-yplane is demonstrated in Fig. 3 (c). Three nodes are seen in the amplitude distribution in the defect area, indicating that the order of the Fabry-Perot cavity is 3.

Fig. 3. Simulation results: Simulated transmission spectra of the structure (a) without lactose and (b) with different thicknesses of lactose loaded on the top of the defect; (c) electric field profile in the central x-y plane of the Si waveguide.
An enhancement of the field is present in the middle of the structure due to the cavity effect. When a thin layer ofα-lactose is deposited on the top surface of both the silicon waveguide and the SiO2substrate (including the bottom of the holes) over the defect area of the structure, the peak transmission will be affected by the intrinsic loss of it. The transmission spectra whenα-lactose loaded are also calculated using the FDTD method. The thickness ofα-lactose can be controlled by dissolving it into an organic solvent with different concentration and drying it after dropping the solution onto the sample. Here the permittivity of lactose is modeled by using a series of Lorentzian oscillators to demonstrate its characteristic absorption frequencies as follows[16]:

whereε∞denotes the off-resonance background permittivity ofα-lactose,ωpandγpare the angular frequency and damping rate of each absorption oscillation, respectively,andεpis the oscillation strength factor. For simplicity, we only consider the first absorption resonance of lactose at 0.529 THz and the other parameters are as follows:ε∞=3.145,γp=1.59×10¹¹rad·s–1, andεp=0.052, which together gives a calculated permittivity close to the empirical values[17].
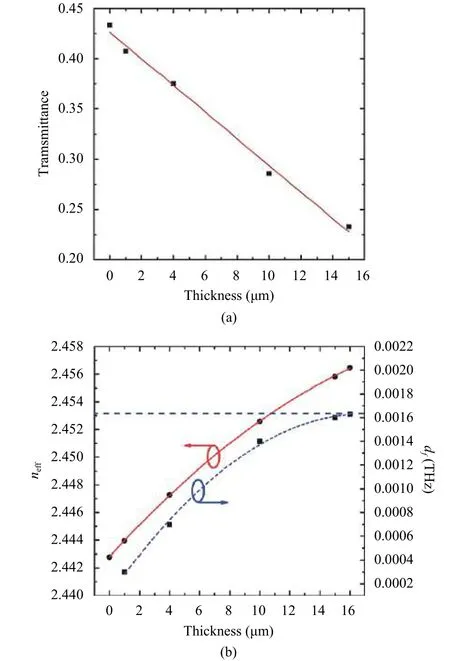
Fig. 3 (b) gives the transmission spectra whenα-lactose with different thicknesses of 1 μm, 4 μm, 10 μm, and 15 μm is loaded on top of the cavity, respectively. Two main features are worthy to note whenα-lactose is present. Firstly the transmittance at the resonance drops when the thickness ofαlactose increases. The dependence of resonance transmittance on theα-lactose thickness is shown in Fig. 4 (a) and demonstrates a linear behavior. The drop can then be used to estimate the thickness of sample loaded onto the cavity.Secondly, the position of the resonance redshifts along the left side of the original black curve (withoutα-lactose), as shown in Fig. 3 (b). The mode effective indexneffincreases when moreα-lactose with a dielectric constant larger than air is loaded onto the silicon waveguide cladding. That can be seen from the solid line in Fig. 4 (b) which demonstrates the calculated results ofneffas a function ofα-lactose thickness using a finite difference mode (FDM) solver. As a result, the total optical path inside the cavity increases leading to the redshift. Combining these two features, one can see that whenα-lactose thickness is above a certain level, the resonance will shift beyond the original curve and transmittance at the resonance is too low for observation.One can define the dynamic range of the cavity sensor as the thickness ofα-lactose at which the resonance shifts from 0.529 THz by HWHM of the original resonance. The resonance shift as a function of theα-lactose thickness can be estimated using the phase condition of the Fabry-Perot cavity[13]:

whereLeffis the cavity effective length taking into account the reflection phases at both ends of the cavity andmis the order of the cavity mode, which is 3 here. For simplicity we assume that the introduction ofα-lactose does not change the value ofLeff, then the change of the resonance frequency,df, can be calculated using the results ofnefffrom FDM. The dashed line in Fig. 4 (b) gives the calculated resonance shiftdfand the results agree quite well with those given by the FDTD fullwave calculations. One can also see that as the thickness ofα-lactose increases, the resonance shift is more significant. When theα-lactose thickness is 16 μm, the calculated resonance shift reaches HWHM,which indicates that the sensing dynamic range is achieved here.

4. Conclusions
In conclusion, we have described and numerically demonstrated a scheme to enhance the sensitivity of terahertz fingerprint detection in the terahertz regime with a PC cavity realized in a periodic silicon waveguide. By using a defect mode with the resonance matching with the absorption ofαlactose, the loading ofα-lactose significantly changed the transmittance of the defect resonance, which can be used to sense the thickness ofα-lactose. Anα-lactose thickness of a few microns can be easily detected using this scheme and note that the sensitivity is related with the quality factor of the transmission peak (defined as the resonance frequency divided by the FWHM of the resonance)[18]. The quality factor of the investigated cavity can be calculated to be only 331 by using the data in Fig. 3 (a) and it can be increased by optimizing the photonic crystal cavity. The dynamic sensing range of this cavity enhanced sensor was also discussed. Although the defect mode was designed forα-lactose and the capability of substance identification is still retained using this approach.This presents an efficient method of terahertz fingerprint detection to identify and detect the target sample with the thickness of a few microns, which is required for biomedical applications.
杂志排行
Journal of Electronic Science and Technology的其它文章
- Model-Based Adaptive Predictive Control with Visual Servo of a Rotary Crane System
- Mining Frequent Sets Using Fuzzy Multiple-Level Association Rules
- Secure Model to Generate Path Map for Vehicles in Unusual Road Incidents Using Association Rule Based Mining in VANET
- Systematic Synthesis on Pathological Models of CCCII and Modified CCCII
- Improvement of an ID-Based Deniable Authentication Protocol
- Improved Method of Contention-Based Random Access in LTE System
