Comparison of Di ff erent Generation Mechanisms of Free Convection between Two Stations on the Tibetan Plateau
2018-06-29LangZHANGYaomingMAWeiqiangMAandBinbinWANG
Lang ZHANG,Yaoming MA∗,3,Weiqiang MA,3,and Binbin WANG
1Key Laboratory of Tibetan Environment Changes and Land Surface Processes,Institute of Tibetan Plateau Research,Chinese Academy of Sciences,Beijing 100101,China
2University of Chinese Academy of Sciences,Beijing 100049,China
3CAS Center for Excellence in Tibetan Plateau Earth Sciences,Chinese Academy of Sciences,Beijing 100101,China
1.Introduction
Land–atmosphere interactions a ff ect the energy and water cycles over a wide range of scales(Betts et al.,1996).Among these interactions,relatively small-scale processes have a crucial in fl uence on the development of convective clouds and precipitation,e.g.,local circulation systems induced by the dynamical or thermal e ff ects of topography are difficult to simulate accurately using models(Xu et al.,2008;Eigenmann et al.,2009;Gerken et al.,2014).On the other hand,many studies have reported(Mayer et al.,2008)tracegas transport induced by local circulation,e.g.,sudden ozone reduction events on a mountain summit as a result of the occurrence of free convection conditions(FCCs)in a valley(Mayer et al.,2008)and high ozone events on the mountain summit region of Mount Everest(Zhu et al.,2006;Cai et al.,2007;Semple and Moore,2008).Therefore,investigating the characteristics of local circulation systems,e.g.,the trigger conditions or driving mechanism of FCCs(Hanesiak et al.,2004;Eigenmann et al.,2009),will contribute to improving the simulation capability of sub-grid physical processes and the understanding of observed air matter exchange in alpine regions.
Eigenmann et al.(2009)investigated near-ground FCCs in the Kinzig Valley,Black Forest,Southeast Germany by using eddy covariance(EC)measurements combined with a Doppler radar system and discussed the applicability of using the EC method to detect FCCs.Following this study,Zhou et al.(2011)analyzed FCCs in a typical land–lake breeze circulation at Nam Co Station,which is near Nam Co Lake in Tibet.Buoyant forces generated by elevated heating of a mountain slope can induce local mesoscale circulations,usually referred to as upslope winds or anabatic winds(Lee and Kimura,2001).However,if the land-use type of the highland is forest and the lower land is grass or cropland,it can induce a circulation that is counter to upslope winds(Hanesiak et al.,2004).For this reason,we chose the Qomolangma Monitoring and Research Station for Atmosphere and Environment(QOMS),which has bare soil underlying the surface of a mountain,and the Southeast Tibet Monitoring and Research Station for Environment(SETS),which has forest on a mountain and high grass in a valley,to detect the FCCs and compare the di ff erences.Subsequently,we investigated the in fl uence of the monsoon on FCCs.
QOMS and SETS have similar terrain features but completely di ff erent characteristics of underlying surface in the adjacent area.There are probably essential distinctions between the generation mechanism and structure of local smallscale circulation at these two stations.This analysis focuses on discussing the di ff erences in FCCs between the two stations under the in fl uence of speci fi c background circulation and is a supplement to the results of Eigenmann et al.(2009)and Zhou et al.(2011).The present study aims to investigate the near-ground FCCs based on EC data at QOMS and SETS,and aims to serve as a reference for further research on local circulation systems.
2.Site description and experimental data
The stations under investigation in the present study—namely,QOMS(28◦21.640N,86◦56.910E;4298 m MSL)and SETS(29◦45.870N,94◦44.30E;3327 m MSL)—were established in 2006 and are in the Rongbuk Valley approximately 42 km north of Mt.Qomolangma(Sun et al.,2007)and 6 km north of the town of Lulang in Linzhi County near the southeastern border of Tibet,respectively.The Rongbuk Valley is oriented in a north-northeast–south-southwest direction with high mountains to the south and a width of approximately 1.2 km(Sun et al.,2007).Mountain crests in the adjacent area(within 10 km)of QOMS and SETS reach maximal values of approximately 5200 m and 5000 m MSL,respectively.The target underlying surface type of QOMS is a fi eld of gravel mixed with a small fraction of grass and some herbaceous plants in the valley(see Figs.1a and b).The valley in which SETS is situated is oriented north-northeast–south-southwest with high mountains to the south.The width of this valley ranges from 400 m to 500 m,and the target land-use type is a high grass fi eld(see Figs.1c and d).
The data used in this study are obtained from the EC tower.An EC system(measurement height:3.25 m(QOMS)and 3.04 m(SETS);sampling frequency:10 Hz),equipped with a sonic anemometer(CSAT3,Campbell Scienti fi c Inc.,Logan,USA.,was used for collecting wind vector and sonic temperature data.An open-path H2O/CO2gas analyzer(Li-7500,LI-CORBiosciences,NebraskaUSA)wasusedforwa-ter vapor and CO2concentrations observation.

Fig.1.Topographic features(left)and land-use type(right)of(a,b)QOMS and(c,d)SETS.The locations of the two stations are marked by a red cross in each plot.
3.Data processing and quality assessment
The EC data measured at QOMS and SETS were processed with TK3,a software developed at the Department of Micrometeorology,University of Bayreuth(Mauder et al.,2007;Mauder and Foken,2011),which includes all fl ux correction steps(Webb et al.,1980;Vickers and Mahrt,1997;Wilczak et al.,2001)and a quality assessment applied on the satisfaction of stationary and integral turbulence characteristics(Foken and Wichura,1996;Gckede et al.,2004;Eigenmannetal.,2009).Ageneralviewofsensibleheat fl ux,latent heat fl ux and wind direction in 2011 at QOMS and SETS is shown in Fig.2,where the y-axis represents the instrument recording time(LST,UTC+8),with the white areas denoting missing data.

Fig.2.Sensible heat fl ux(H;units:W m−2),latent heat fl ux(LE;units:W m−2)and wind direction in 2011 at(a,c,e)QOMS and(b,d,f)SETS.
Footprint analyses have to be performed to evaluate the spatial representativeness of measurements.For the present study,a forward Lagrangian footprint model(Rannik et al.,2003)combined with the fl ux data quality assessment scheme of Foken and Wichura(1996)was applied to provide a basis for data fi ltering(Gckede et al.,2004,2006;Eigenmann et al.,2009).Furthermore,the impact of internal boundary layers caused by the discontinuities of surface properties should be checked.The relation proposed by Raabe(1983)is as follows:

This relation can be used to approximately determine the height δ of the new equilibrium layer(Foken,2008a)in order to check the impact of the internal boundary(Eigenmann et al.,2009).Here,x is the fetch(m),and z is the height(m)of the sensor.In this study,the e ff ect of the fence is considered as an obstacle.The measuring height of both sites is greater than twice that of the fence height;hence,the infl uence of the fence on fl ux measurements can be neglected.Table 1 shows the results for the approximately calculated fetch of the target underlying surface type for QOMS(gravel mixed with grass)and SETS(high grass).“I”presented in this table indicates that the fetch of the target land-use type is sufficiently large to make the internal boundary layer higher thanthemeasurementheight.AtQOMS,thenewequilibrium layer is below the measurement level in the 270◦and 300◦directions.The fl ux measurements within these two sectors are under the in fl uence of the internal boundary layer and should be discarded.However,the in fl uence of the heterogeneous underlying surface on the overall assessment was weak because these regions do not lie in the prevailing wind direction.For the case at SETS,the terrain is more complicated and the fetch of the 30◦,60◦,90◦,120◦,330◦and 360◦sectors denotes the distance between the EC tower and the outer edge of the surface discontinuity.Flux measurements for wind directions of 90◦and 120◦,where the measuring height of 3.04 m is greater than δ,and 150◦,240◦,270◦and 300◦,where the measuring height is lower than δ,can be associated with the target land-use type(high grass).The footprint analysis results are also presented in Table 1.Generally,if the fl ux contribution from the target land-use type was less than 80%and the δ was greater than the measurement height,the fl ux data should be excluded from further analyses(Mauder et al.,2006).

Table 1.Average fl ux contribution(%)obtained by footprint analyses from the target underlying surface type “grass and gravel”at QOMS and “high grass”at SETS,in 12 independent wind directions and three stability classes.The internal boundary layer height δ and the fetch x in each direction are also listed.
4.Results and discussion
4.1.Detection of FCCs
The stability parameter ζ,

can be used to detect the occurrence of FCCs(Eigenmann et al.,2009).Here,z,L,k,g,w,θvand u∗represent measurement height,Obukhov length,von-K´arm´an’s constant,gravitational acceleration,vertical wind speed,virtual potential temperature and friction velocity,respectively.The subscriptindicates the turbulent fl ux equal its respective surface value,andis the covariance of w and θv.This parameter can be considered as B/S,where and


These are the buoyancy term(B)and the shear term(S)in the TKE function respectively.Free convection occurs when ζ<−1(Foken,2008b),i.e.,the thermal e ff ect dominates the dynamic e ff ect.In other words,if high buoyancy fl uxes coincide with low u∗,FCCs will be triggered.To obtain more detailed information on the temporal structure of FCCs,both 30 min and 5 min were used as the average block length of the EC fl ux data calculation in the present study.Moreover,only fl ux data with quality fl ags not exceeding 3 within the 30 min data evaluated by the scheme of Foken and Wichura(1996),with the contribution of the target underlying surface exceeding 80%and without disturbance engendered by an internal boundary layer,were used to detect FCCs.In addition,to avoid calculation illusion,the detection of FCCs discarded the data with a sensible heat fl ux less than 20 W m2.
QOMS is on the northern side of Mt.Qomolangma under the in fl uence of katabatic fl ow over glaciers(Sun et al.,2007).The in fl uence of downslope katabatic glacier winds(southerly or south-southeasterly)on up-valley winds(northnortheasterly)forced by solar heating delays the onset and weakens the intensity of up-valley winds.Figures 3a1–f1 show a typical day of FCC occurrence on 12 April 2011 at QOMS.In the morning,the glacier wind intensity is not suffi ciently strong,and thus thermally driven up-valley winds can occur approximately two hours after sunrise.During the onset of up-valley winds,an increasing sensible heat fl ux(Fig.3b1)caused by solar heating occurs with a lower wind speed and u∗.The fi rst occurrence of FCCs occurred at approximately 1040 LST and was the result of a horizontal wind speed decrease caused by a change in local circulation from prevailing katabatic glacier winds to prevailing upvalley winds,which was accompanied by increasing buoyancy fl uxes.A sudden change in wind direction and an increase in wind speed after 1040 LST(see Figs.3c1 and e1)implies the domination of thermally induced valley circulation over katabatic glacier winds from 1040 to 1330 LST.After this period,a slightly weak decreasing trend in solar heating(see Fig.3d1),caused by occasional cloud cover,weakened the intensity of up-valley winds.Meanwhile,the increasing temperature di ff erence between the ice surface and the air nearby strengthens the glacier winds(Sun et al.,2007).Although the transient cloud cover reduces solar heating,the considerable surface heating does not disappear but,rather,is partially weakened.Therefore,during the period from 1330 to 1500 LST,the oscillation of wind direction caused by local circulation variation induces the occurrence of a low wind speed together with high buoyancy,i.e.,the occurrence of FCCs.However,during the monsoon,the circumstance is di ff erent and will be discussed in section 4.3.
Figures 3a2–f2 show a classic case of the occurrence of FCCs on 3 April 2011 at SETS.Figures 4c2 and 4e2 show that down-valley winds become inconspicuous during the night and u∗maintains a lower value before sunrise.Unlike at QOMS,FCCs do not just occur during lower wind-speed periods.Therefore,the occurrence of FCCs(approximately from 0940 to 1200 LST)is not the result of a decrease in horizontal wind speed but is triggered completely by strong solar heating.Shortly after 1200 LST,the persistent enhancement of upslope wind speeds led to the buoyancy term not being able to dominate the shear term any longer,resulting in the disappearance of FCCs.
4.2.Near-ground boundary layer structure during FCCs
The continuous wavelet transform(CWT)is used to analyze the turbulent spectra.This spectral operator was applied to analyze the turbulent structure of vertical wind speeds and temperatures during the period from 0900 to 1700 LST(480 min)at QOMS and from 0800 to 1600 at SETS using the same data analyzed in Fig.3.The CWT was completed using SOWAS—the Software for Wavelet Spectral Analysis and Synthesis(Maraun and Kurths,2004;Maraun et al.,2007).To eliminate the e ff ect of diurnal variation and reduce the processing time,the raw data were detrended and block averaged from the original 10 Hz to 0.5 Hz before the CWT calculation.
Figures 4a and b show the normalized wavelet power spectra of the vertical wind speed and air temperature at QOMS,respectively.It is signi fi cant that lower-frequency turbulence contributes more spectral power during the fi rst FCC period,marked by the black dotted vertical lines.The time scale of air in plumes or thermals cycling once between the bottom and the top of the mixed layer is approximately 5 to 15 min in a well-developed convective boundary layer(Stull,1988).The structure of large-scale turbulence(lowerfrequency turbulence)presented in Fig.4a conforms to this thermal characteristic.The white dotted vertical lines mark thestartandendtimeofthesecondFCCperiod,duringwhich large-scale turbulence still contributes more power but it is not as obvious as during the fi rst FCC period.This dynamic may be the result of higher wind speeds during the second period.
The situation at SETS,as depicted in Figs.4c and d,is di ff erent from that at QOMS.The period marked by the black dotted vertical lines contains a low wind-speed period before sunriseandtheonsetofFCCs.AttheonsetofFCCs,thespectral power is contributed mostly by large-scale turbulence.Moreover,thiscircumstancedoesnotjustoccurduringFCCs,andthereisevenlarger-scaleturbulenceoutsideFCCperiods.A possible interpretation is that the considerable heterogeneity of the land surface and the resulting internal boundary layers at SETS(see Fig.1d)induce low-frequency turbulence.
It is worth noting that the scale of some turbulence is greater than 30 min,which means the EC calculation method cannot capture all types of turbulence power.The average near-ground energy balance closure at QOMS and SETS is 74%and 72%,respectively.Turbulence with scales greater than 30 min led to the imbalance of surface energy.
4.3.Distribution of FCCs during the entire year
Because both QOMS and SETS are in a region under a monsoonal in fl uence,the existence of di ff erences between the monsoon and non-monsoon seasons should be considered.Figure 5a shows the distribution of FCCs during 2011,excluding the period when precipitation and sensible heat fl uxes were less than 20 W m−2.The onset of FCCs is most common from 1.5 to 2 h after sunrise during non-monsoon periods and approximately 4 h or more after sunrise during the monsoon season.To obtain accurate FCC distribution characteristics during the monsoon without confusion caused by data blackout during September and October,supplemen-tary analysis based on a 30 min block average was performed with a more complete data record from 2014.The results indicate that the occurrence of FCCs during the monsoon become more dispersed and less frequent than during the nonmonsoon season.

Fig.4.CWT analysis of the(a,c)vertical wind speed and(b,d)air temperature,(a,b)from 0900 to 1700 LST(480 min)on 12 April 2011 at QOMS,and(c,d)from 0800 to 1600 LST(480 min)on 3 April 2011 at SETS.Two black dotted lines marked the period of FCCs during morning and the yellow dotted lines marked the period of FCCs during afternoon.
During the monsoon season,katabatic glacier winds(southerly or south-southeasterly)cease during the night(see Fig.2e).Thisdisappearanceallowsthehorizontalwindspeed decrease caused by the wind-direction change from katabatic glacier winds to up-valley winds in the morning to cease,undermining the onset of FCCs.Moreover,because of increased water vapor content during the monsoon season,the sensible heat fl ux is not very high—normally less than 200 W m−2.FCCs can only occur with a lower wind speed in most cases.A few hours after sunrise,the temperature difference between the ice surface and air nearby strengthened by solar heating leads to the onset of down-valley glacier winds(Sunetal.,2007).Inotherwords,bothup-valleywinds and down-valley glacier winds are induced by solar heating.Thus,when the intensity of solar heating is close to an appropriate range,the horizontal wind direction is likely to oscillate between two directions.This oscillation leads to the horizontal wind speed decreasing,and then,FCCs to occur.Take 22 July 2011 as an example( fi gures not shown).During FCC periods,the range of sensible heat fl ux is approximately 50–200 W m−2,and the wind speed decreases because of the oscillation of the wind direction from 0◦to 45◦.
At SETS,the situation is much simpler,because the trigger mechanism of FCCs is no longer the low horizontal wind speed coupled with higher sensible heat fl ux,but strong solar heating,independently.Figure 5c shows the distribution of FCCs at SETS in 2011.The occurrence of FCCs is approximately one hour after sunrise,and there is no obvious difference between the monsoon and non-monsoon periods,except for the increasing probability of FCC occurrence caused by more frequent cloud cover during the afternoon during the monsoon.
5.Conclusion
Two observation stations(QOMS and SETS)with similar valley topography and a di ff erent underlying surface type were chosen to analyze the triggering mechanism of FCCs and compare the di ff erences.To obtain high-quality surface turbulent fl uxes,which can be used for the detection of FCCs,footprint analysis for the data representativeness of the target underlying surface type and investigation of the internal boundary layer disturbance combined with the quality control and assessment software TK3 was applied to process the turbulence data both at QOMS and at SETS.Glacier winds and valley winds constitute the local circulation at QOMS.FCCs at this station are the result of a horizontal wind speed decrease caused by change in wind direction from katabatic glacier winds to up-slope winds and weakened up-valley winds due to cloud cover.SETS,which has a forest on the mountain and high grass in the valley,presents di ff erent characteristics in terms of FCCs.Because of the low wind speed before sunrise,FCCs occurring during the morning are not triggered by a horizontal wind speed decrease,but by strong solar heating.Spectral data analyzed using CWT reveals large-scale turbulence near the ground emerging from the detected FCCs.However,the heterogeneous underlying surface at SETS creates large-scale turbulence during periods without the occurrence of FCCs.The distribution of FCCs at QOMS for the whole year indicates that FCCs occur later andbecomemoredispersedandlessfrequentduringthemonsoon than during the non-monsoon seasons.At SETS,there is no signi fi cant di ff erence between the monsoon and nonmonsoon periods,except the increased occurrence probability of FCCs during the afternoon during the monsoon.In conclusion,both orography and the ambient underlying surface type can a ff ect the occurrence of FCCs.
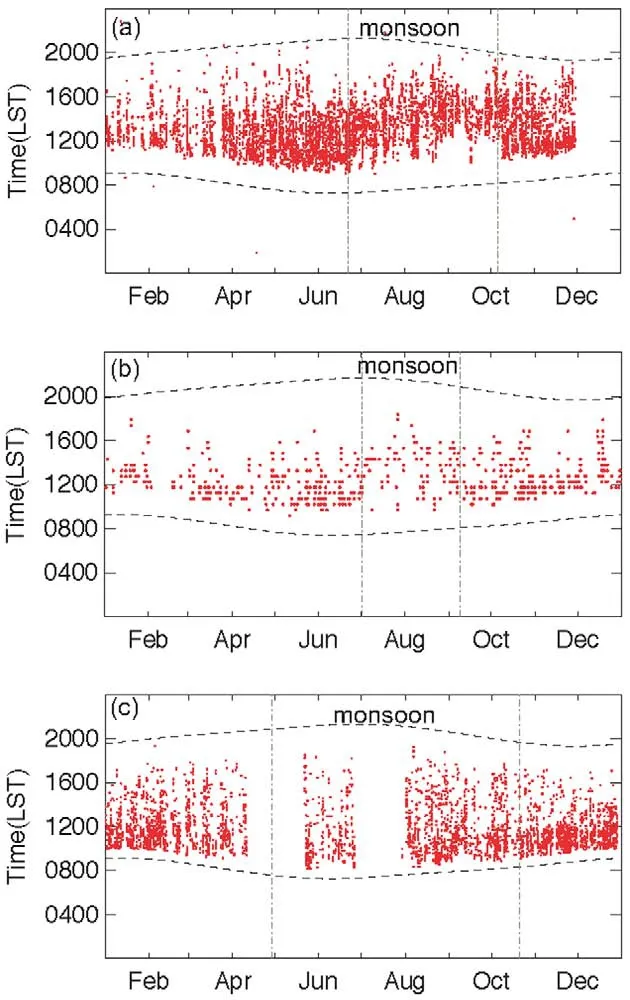
Fig.5.Distribution of FCCs in(a)2011 and(b)2014 at QOMS and(c)at SETS in 2011.The dashed lines indicate sunrise and sunset,and the gray vertical dotted lines outline the monsoon season.
Acknowledgements.This research was funded by the Key Research Program of Frontier Sciences of the Chinese Academy of Sciences(Grant No.QYZDJ-SSW-DQC019),the National Natural Science Foundation of China(Grant Nos.41661144043,91337212,91637313 and 91737205),and the CAS “Hundred Talents”program(Dr.Weiqiang MA).The authors would like to thank Dr.Yongjie WANG,Dr.Zhongyan WANG,Dr.Zhikun ZHU,Dr.Cunbo HAN and colleagues from QOMS and SETS for their installation and maintenance of the measurement systems.The EC data can be download from http://zenode.org/record/20349#.
REFERENCES
Betts,A.K.,J.H.Ball,A.C.M.Beljaars,M.J.Miller,and P.A.Viterbo,1996:The land surface–atmosphere interaction:A review based on observational and global modeling perspectives.J.Geophys.Res.,101,7209–7225,https://doi.org/10.1029/95JD02135.
Cai,X.H.,Y.Song,T.Zhu,W.L.Lin,and L.Kang,2007:Glacier winds in the Rongbuk Valley,north of Mount Everest:2.Their role in vertical exchange processes.J.Geophys.Res.,112,D11102,https://doi.org/10.1029/2006JD007868.
Eigenmann,R.,S.Metzger,and T.Foken,2009:Generation of free convection due to changes of the local circulation system.Atmos.Chem.Phys.,9,8587–8600,https://doi.org/10.5194/acp-9-8587-2009.
Foken,T.,and B.Wichura,1996:Tools for quality assessment of surface-based fl ux measurements.Agricultural and Forest Meteorology,78,83–105,https://doi.org/10.1016/0168-1923(95)02248-1.
Foken,T.,2008a:Micrometeorology.Springer,Berlin,Heidelberg,https://doi.org/10.1007/978-3-540-74666-9.
Foken,T.,2008b:The energy balance closure problem:An overview.Ecological Applications,18,1351–1367,https://doi.org/10.1890/06-0922.1.
Gerken,T.,T.Biermann,W.Babel,M.Herzog,Y.M.Ma,T.Foken,and H.-F.Graf,2014:A modelling investigation into lake-breeze development and convection triggering in the Nam Co Lake basin,Tibetan Plateau.Theor.Appl.Climatol.,117,149–167,https://doi.org/10.1007/s00704-013-0987-9.
Gckede,M.,T.Markkanen,C.B.Hasager,and T.Foken,2006:Update of a footprint-based approach for the characterisation of complex measurement sites.Bound.-Layer Meteor.,118,635–655,https://doi.org//10.1007/s10546-005-6435-3.
Hanesiak,J.M.,R.L.Raddatz,and S.Lobban,2004:Local initiation of deep convection on the Canadian prairie provinces.Bound.-Layer Meteor.,110,455–470,https://doi.org/10.1023/B:BOUN.0000007242.89023.e5.
Lee,S.H.,and F.Kimura,2001:Comparative studies in the local circulations induced by land-use and by topography.Bound.-Layer Meteor.,101,157–182,https://doi.org/10.1023/A:1019219412907.
Maraun,D.,and J.Kurths,2004:Cross wavelet analysis:Signi ficance testing and pitfalls.Nonlinear Processes in Geophysics,11,505–514,https://doi.org/10.5194/npg-11-505-2004.
Maraun,D.,J.Kurths,and M.Holschneider,2007:Nonstationary Gaussian processes in wavelet domain:Synthesis,estimation,and signi fi cance testing.Phys.Rev.E,75,016707,https://doi.org/10.1103/PhysRevE.75.016707.
Mauder,M.,C.Liebethal,M.Gckede,J.-P.Leps,F.Beyrich,and T.Foken,2006:Processing and quality control of fl ux data during LITFASS-2003.Bound.-Layer Meteor.,121,67–88,https://doi.org/10.1007/s10546-006-9094-0.
Mauder,M.,and Coauthors,2007:The energy balance experiment EBEX-2000.Part II:Intercomparison of eddy-covariance sensors and post- fi eld data processing methods.Bound.-Layer Meteor.,123,29–54,https://doi.org/10.1007/s10546-006-9139-4.
Mauder,M.,and T.Foken,2011:Documentation and instruction manual of the eddy-covariance software package TK3.Arbeitsergebnisse,Nr.46.,Universitt Bayreuth,Bayreuth.
Mayer,J.C.,K.Staudt,S.Gilge,F.X.Meixner,and T.Foken,2008:The impact of free convection on late morning ozone decreases on an Alpine foreland mountain summit.Atmos.Chem.Phys.,8,5941–5956,https://doi.org/10.5194/acp-8-5941-2008.
Raabe,A.,1983:On the relation between the drag coefficient and fetch above the sea in the case of o ff-shore wind in the near shore zone.Z.Meteor.,33,363–367.
Rannik,¨U.,T.Markkanen,J.Raittila,P.Hari,and T.Vesala,2003:Turbulence statistics inside and over forest:In fl uence on footprint prediction.Bound.-Layer Meteor.,109,163–189,https://doi.org/10.1023/A:1025404923169.
Semple,J.L.,and G.W.K.Moore,2008:First observations of surface ozone concentration from the summit region of Mount Everest.Geophys.Res.Lett.,35,L20818,https://doi.org/10.1029/2008GL035295.
Stull,R.B.,1988:An Introduction to Boundary Layer Meteorology.Dordrecht:Kluwer Academic Publishers.
Sun,F.L.,Y.M.Ma,M.S.Li,W.Q.Ma,H.Tian,and S.Metzger,2007:Boundary layer e ff ects above a Himalayan valley near Mount Everest.Geophys.Res.Lett.,34,L08808,https://doi.org/10.1029/2007GL029484.
Vickers,D.,and L.Mahrt,1997:Quality control and fl ux sampling problems for tower and aircraft data.J.Atmos.Oceanic Technol.,14,512–526,https://doi.org/10.1175/1520-0426(1997)014<0512:QCAFSP>2.0.CO;2.
Webb,E.K.,G.I.Pearman,and R.Leuning,1980:Correction of fl ux measurements for density e ff ects due to heat and water vapour transfer.Quart.J.Roy.Meteor.Soc.,106,85–100,https://doi.org/10.1002/qj.49710644707.
Wilczak,J.M.,S.P.Oncley,and S.A.Stage,2001:Sonic anemometer tilt correction algorithms.Bound.-Layer Meteor.,99,127–150,https://doi.org/10.1023/A:1018966204465.
Xu,Z.X.,T.L.Gong,and J.Y.Li,2008:Decadal trend of climate in the Tibetan Plateau—regional temperature and precipitation.Hydrological Processes,22,3056–3065,https://doi.org/10.1002/hyp.6892.
Zhou,D.G.,R.Eigenmann,W.Babel,T.Foken,and Y.M.Ma,2011:The study of near-ground free convection conditions at Nam Co station on the Tibetan Plateau.Theor.Appl.Climatol.,105,217–228,https://doi.org/10.1007/s00704-010-0393-5.
Zhu,T.,and Coauthors,2006:Downward transport of ozone-rich air near Mt.Everest.Geophys.Res.Lett.,33,L23809,https://doi.org/10.1029/2006GL027726.
杂志排行

Advances in Atmospheric Sciences的其它文章
- In fl uence of Low-frequency Solar Forcing on the East Asian Winter Monsoon Based on HadCM3 and Observations
- Atmospheric Response to Mesoscale Ocean Eddies over the South China Sea
- Source Contributions to PM2.5under Unfavorable Weather Conditions in Guangzhou City,China
- Changes in the Proportion of Precipitation Occurring as Rain in Northern Canada during Spring–Summer from 1979–2015
- Varying RossbyWave TrainsfromtheDevelopingtoDecayingPeriodof theUpper Atmospheric Heat Source over the Tibetan Plateau in Boreal Summer
- Characterizing the Relative Importance Assigned to Physical Variables by Climate Scientists when Assessing Atmospheric Climate Model Fidelity