Varying RossbyWave TrainsfromtheDevelopingtoDecayingPeriodof theUpper Atmospheric Heat Source over the Tibetan Plateau in Boreal Summer
2018-06-29ChuandongZHURongcaiRENandGuoxiongWU
Chuandong ZHU,Rongcai REN,and Guoxiong WU
1State Key Laboratory of Numerical Modeling for Atmospheric Sciences and Geophysical Fluid Dynamics(LASG),Institute of Atmospheric Physics,Chinese Academy of Sciences,Beijing 100029,China
2Collaborative Innovation Center on Forecast and Evaluation of Meteorological Disasters and KLME,Nanjing University of Information Science and Technology,Nanjing 210044,China
3University of Chinese Academy of Sciences,Beijing 100049,China
1.Introduction
As a huge heat source of the atmosphere in summer,the thermal in fl uence of the Tibetan Plateau(TP)is known to be crucial for the formation of the atmospheric circulation patterns and climate anomalies not only within the Asian region but also across the globe(Ye and Wu,1998;Duan et al.,2012).The highly elevated surface sensible heat over the TP can drive strong vertical motion in summer,which can act as a powerful“air pump”to pump the lower air upwards and result in divergence and anticyclonic circulation in the upper troposphere(Ye and Yang,1979;Wu et al.,1997).Other observational evidence(Flohn,1960;Reiter and Gao,1982;Yanai et al.,1992)and an early numerical experiment(Krishnamurti et al.,1973)have also con fi rmed that it is the diabatic heating over the summer TP that generates the South Asian high(SAH)—an important circulation system in the upper troposphere in summer(Mason and Anderson,1963).In particular,it is the inhomogeneous spatial distribution of the diabatic heating over the TP and eastern Asia that determines the locations of the SAH and the northwestern Paci fi c subtropical high(NWPSH)(Wu and Liu,2000;Liu et al.,2001a;Liu et al.,2004;Wu et al.,2015).
Althoughthe land–sea thermalcontrast is knowntobethe main driver of monsoonal circulation(Murakami and Ding,1982;Luo and Yanai,1983,1984;Chen et al.,1991),the strong heat source over the TP has been recognized as one of the most important factors modulating the onset and intensity of the Asian summer monsoon(ASM)(e.g.Yanai and Wu,2006;Wu et al.,2007;Romatschke and Houze,2011).For example,the sensible heating over the TP originated in spring canleadtoanearlierreversalofthemeridionalgradientofthe atmospheric temperature over the east side of the TP,which leads to the fi rst onset of the ASM in the northeastern part of the Bay of Bengal(Wu and Zhang,1998).When the sensible heating over the TP is anomalously strong in spring,the seasonal reversal of the vertical shear of both the zonal and meridional wind in the East Asian monsoon region is anomalously early,which marks an earlier onset of the East Asian summer monsoon(EASM)(Duan et al.,2013).In particular,recent evidence based on data analysis and numerical experiments provided by Wu et al.(2012)further proved that the variability of the EASM,as well as the eastern part of the South Asian summer monsoon,can indeed be attributed to the thermal forcing anomalies over the TP.
Owing to the high elevation and vast area of the TP heating,its in fl uence can be passed to remote regions outside Asia.Coupled with the SAH and strong upward motion over the TP,compensative downward motion always prevails over the vast surrounding regions(Ye and Wu,1998).The downward motion to the east of the TP can be as far away as the central North Paci fi c,and that to the west—over Afghanistan,Iran,and Saudi Arabia—is largely responsible for the dry climate and deserts in these regions(Yang et al.,1992;Rodwell and Hoskins,1996;Ye and Wu,1998;Wu et al.,2009).In the meridional direction,the divergent fl ow overtheTPmayextendsouthwardsacrosstheequator and induce downward motion in the southern subtropics,thus forming the well-known Hadley-monsoonal meridional circulation(Ye and Wu,1998).It may also extend northwards and then descend to the north of the TP,corresponding to the Taklimakan and Dzungaria deserts(Ye and Yang,1979).On the other hand,the in fl uence of the TP may also be passed to remote regions via a Rossby wave train(RWT).The modeling results of Hoskins and Karoly(1981)and Huang and Gambo(1981)suggested that the atmospheric responses to mechanical and thermal forcing of large-scale topographies may exhibit Rossby wave patterns.Two southeastward-propagating RWTscanbeidenti fi edinsummeracrosstheNorthernHemisphere,one of which is generated from the Rocky Mountains and the other from the TP(Grose and Hoskins,1979).Huang(1985)also indicated that the propagation of Rossby waves forced by a strong TP thermal forcing may result in anticyclonic circulation at 300 hPa over the TP,Sea of Okhotsk,and the northern part of North America,and cyclonic circulation over the west of Lake Baikal and the Aleutian region.In particular,modeling studies by Wu et al.(1997)and Ye and Wu(1998)emphasized that the elevated surface sensible heating over the TP can excite an RWT pattern across the globe.The RWT splits over the North Paci fi c,with its southern branch bending southward along the westerlies at the bottom of the tropical upper-tropospheric trough(TUTT);and its northern branch propagating further eastward to Alaska and Baffin Bay,and then bending southward over the North Atlantic to the north of Cape Verde,where the axis of the subtropical high lies.A similar RWT pattern emanating from the TP was also identi fi ed by Liu et al.(2002)and Wu et al.(2002).Theseresultsindicatedaclearpathwayfortheremote in fl uences of TP surface heating on the atmospheric circulation and climate from the subtropics to the high latitudes.
However,the TP heat source in summer tends to be dominated by convective condensation heating in the upper troposphere,especially over the eastern TP region(Chen et al.,1985;Jiang et al.,2016),although the surface sensible heating is known to be the primary driver of the related vertical motion over the TP(Wu et al.,2002).This implies a further elevated atmospheric heat source over the TP,which may excite RWTs that are di ff erent from those excited by the surface sensible heat source.In addition,on top of the interannual variabilities of the TP heat source upon which most previous studies have focused(Krishnamurti et al.,1973;Reiter and Gao,1982;Wu et al.,1997;Ye and Wu,1998;Zhao and Chen,2001;Ueda et al.,2003;Duan et al.,2005,2013;Liuetal.,2007a;Zhangetal.,2009),signi fi cantintraseasonal timescale(10–30 days)variations have been identi fi ed for the column-integrated apparent heat source,especially over the eastern TP(Nitta,1983).Wang and Duan(2015)further indicated the dominance of a quasi-biweekly(10–20 days)oscillation mode of the precipitation,diabatic heating and tropospheric circulation over the TP.In terms of the origin of this quasi-biweekly oscillation over the TP,agreement is still lacking as to whether it originates locally or is in fl uenced by circulation in the tropics or in the middle and high latitudes(Wang and Duan,2015).Consistent with the quasi-biweekly oscillation of the heat source over the TP,the SAH,particularly its longitudinal position,seems also to exhibit quasibiweekly variation in boreal summer(Tao and Zhu,1964;Liu et al.,2007b;Ren et al.,2007).This longitudinal shifting of the SAH has been found to be closely related to an opposing longitudinal shift of the NWPSH in the lower and mid troposphere(Tao and Zhu,1964;Ren et al.,2007),which in turn is closely related with extreme changes in monsoonal rainfall over the East Asian region.The present study focuses on the daily variations of the upper-tropospheric heat source over the TP,and investigates the RWT related to this TP heat source in boreal summer.
In particular,we examine the dynamic and thermodynamic processes related to the daily variations of the upper atmospheric heat source over the Tibetan Plateau(TPUHS)and the associated RWT,and demonstrate the possible climatic impacts of the RWT on the atmospheric circulation and weather anomalies in summer in the northern extratropics.The aim in carrying out this work is to help improve our understanding of the climatic e ff ects of TP heating,on multiple timescales,as well as the remote in fl uence of the TP on the northern extratropics in summer.
Following this introduction,section 2 introduces the data and method;section 3 demonstrates the seasonal evolution of the TPUHS in summer and its dominant sub-monthly variability;section 4 illustrates the di ff erent RWTs related to the TPUHS from its developing to decaying period;section 5 explores the possible e ff ects of the TP-related RWTs on the climatological circulation systems and weather anomalies in the northern extratropics;and section 6 provides a summary and discussion.
2.Data and method
2.1.Data
The daily atmospheric circulation fi elds are from the National Centers for Environmental Prediction and National Center for Atmospheric Research(NCEP–NCAR)reanalysis dataset(Kalnay et al.,1996),which covers the period from 1 January 1979 to 31 December 2014,and has a horizontal resolution of 2.5◦latitude×2.5◦longitude and 17 pressure levels spanning from 1000 to 10 hPa.The daily surface sensible heat fl ux fi elds from NCEP–NCAR covers the same period as the atmospheric circulation fi elds,and are interpolated from Gaussian grids to 2.5◦latitude×2.5◦longitude grids before analysis.The daily precipitation fi elds are from the Global Precipitation Climatology Project(GPCP),version 1.2,1◦Daily Precipitation Dataset(Bolvin et al.,2009),covering the period from 1 January 1997 to 31 December 2014.We fi rst calculate the daily annual cycle of all variables by taking an average of them across the 36 years for each calendar day,and then we remove the daily annual cycle from the respective original fi elds to obtain the daily anomaly fi elds.The reliability of the NCEP–NCAR reanalysis in representing the diabatic heating over the TP and its variabilities has already been validated in many previous studies(e.g.,Nigam et al.,2000;Rodwell and Hoskins,2001;Duan,2003;Wang et al.,2011).We also con fi rmed the general consistency of the NCEP–NCAR reanalysis with other datasets(e.g.,JRA-55)in representing the TP heat source and the related RWTs.
2.2.Method
2.2.1. Heat source index
Based on the large-scale heat budget equation(Yanai et al.,1992):

where Tairdenotes air temperature;is the horizontal wind vector;ω is the vertical velocity in pressure(p)coordinates;θ is the potential temperature;p0equals 1000 hPa;and κ=R/cp,with R being the gas constant and cpthe speci fi c heat capacity of dry air at constant pressure,we fi rst obtain the apparent heat source(Q1) fi elds at 19 pressure levels(1000,925,850,700,600,550,500,450,400,300,250,200,150,100,70,50,30,20,and 10 hPa).Because the main focus of this study is the heat source in the upper troposphere,ratherthanthesurfacesensibleheatsource,wethenvertically integrate Eq.(1)from the tropopause pressure level(pt=100 hPa)to the lowest pressure level(pb)that is about 100 hPa away from the surface to obtain the column-integrated atmospheric heat source

By averaging the(the angle brackets denote column integration)over the TP region(25◦–40◦N,70◦–105◦E)and above the altitude of 1500 m,we further de fi ne a daily TP apparent heat source index(THI).
We also calculate the diabatic heating rate(K d−1)from dθ/dt(θ is the potential temperature)for each pressure level and the surface(Wu et al.,1999),to show the spatiotemporal evolution of the atmospheric heat source from the surface to the upper layer.
2.2.2.Statistical signi fi cance test
We apply the Student’s t-test to assess the statistical signi fi cance of our results,where the e ff ective sample size(N0)is estimated using the method discussed in Bretherton et al.(1999):

where N is the original sample size,and r1and r2are the lag 1 auto-correlation coefficients of the two time series involved.As the lag 1 auto-correlation for the THI is 0.678,we have N0=0.37N,assuming that r1=r2,when we assess the statistical signi fi cance of the regressions against the THI.
2.2.3. Wave activity fl ux
To facilitate a subjective representation of Rossby waves,we adopt the three-dimensional wave activity fl ux in a spherical log-pressure coordinate,de fi ned by Plumb(1985):

where

represents the static stability(the caret denotes an area average over the region north of 20◦N),Φ is the geopotential,u and v are the zonal and meridional components of horizontal wind,the primes denote the deviations from zonal means,Tairis the air temperature,H is the scale height,λ is longitude,ϕ is latitude,a is Earth’s radius(6378.388 km),and Ωis Earth’s rotational angular velocity(7.2685×10⁻⁵rad s−1).The primes denote the deviations from zonal means.Because the wave activity fl ux is parallel to the local group velocity of Rossby waves,it can e ff ectively indicate the propagating direction of the wave energy.
3.Seasonal evolution of the TPUHS over the summer TP and its dominant quasibiweekly variability
3.1.Seasonal evolution of the TPUHS
Figure 1a shows the seasonal evolution of the area-mean column-integrated(from 100 hPa to the pressure level that is about 100 hPa away from the surface)apparent heat source()and the area-mean surface sensible heat fl ux(SH)over the TP region.It can be seen that the intensity of the atmospherichas already become lager than the surface SH since May.Thereafter,while the atmospherickeeps increasing after May and reaches 90–95 W m−2in June–July,the surface SH shows a weaker increase and remains at around 50 W m−2from May to October.This clearly indicates the dominance of strong latent condensation heating(LH)on the variation of the TP heat source in summer.After summer,both the SH anddecrease sharply from September,with the SH gradually becoming stronger than theand beginning to dominate the TP heat source again.

Fig.1.Seasonal evolution(May–October)of(a)the area-mean surface sensible heat fl ux(blue;units:W m−2)and vertically accumulated apparent heat source(red;units:W m−2)over the TP(25◦–40◦N,70◦–105◦E)above 1500 m,and(b)the 200-hPa zonal wind(units:m s−1)averaged from 70◦E to 105◦E.The horizontal black lines in(b)roughly mark the south and north boundaries of the TP,and the vertical blue lines indicate 18 July and 23 August,respectively.
The meridional location as well as the zonal structure of the upper-tropospheric westerly jet can a ff ect the propagation speed,amplitude and phase of the Rossby waves excited by a tropospheric heat source(Hoskins and Karoly,1981).By examining the successive seasonal shift of the East Asian upper-tropospheric westerly jet,Lin and Lu(2008)noted that it usually undergoes a signi fi cant northward shift around 20 July,and then stays stably to the north of 40◦N,or to the north of the TP,for some time.To con fi rm this,we display the seasonal evolution of the 200-hPa westerly jet(>20 m s−1)over the TP region(70◦–105◦E)in Fig.1b.It is apparent that the westerly jet shifts gradually northward from May to mid June and begins to be centered at 40◦N;then,it exhibits a further northward shift around 18 July and remains steadily at∼ 42.5◦N until 23 August,after which it begins to retreat southward.To consider the possible RWTs associated with the intensive deep convection and strong TPUHS covering most of the TP region,we focus mainly on the period from 20 July to 20 August in the following investigation.Actually,for the TPUHS in summer and its synoptic variations,the related RWTs during this period are the mostcompleteand strongest,compared with other time periods(data not shown).
3.2.The dominant quasi-biweekly variability of the TPUHS

Fig.2.Lead/lag regressions against the THI(units:W m−2)of the area-mean diabatic heating rate anomalies(units:K d−1)over the TP(a)at each level(contour interval:0.1;dashes for 0.05 and 0.15 are added)and(b)at the surface in boreal summer(20 July to 20 August).Stippling in(a)and dots in(b)indicate regressions above the 90%con fi dence based on the t-test.The abscissa is the lead time of the THI(units:d);the ordinate is the pressure level(units:hPa)in(a)and the amplitudes of the regression in(b).
To demonstrate the dominant variability of the TPUHS in boreal summer,we display in Fig.2a the lead/lag regressions of the layer-by-layer area-mean diabatic heating rate anomalies over the TP against the THI(contours).It is apparent that,relative to the maximum values around the peak day of the THI,signi fi cant regression values for most layers decrease sharply with the increase in the lead/lag time,and consistently tend to approach zero until day±7.By referencing to the lead/lag auto-correlation of the THI time series and the corresponding e-folding time shown in Fig.3,we can estimate that the lifetime of an anomalous THI event is about seven days,or the dominant variability of the THI(i.e.,the upper-atmospheric heat source in the troposphere over the TP)is in a quasi-biweekly timescale.Spectral analysis confi rms that the THI does exhibit signi fi cant quasi-biweekly(or 10–20 days)oscillation and the variance explained by the quasi-biweekly variability is up to 35.8%of the total variance(∼54.2)of the normalized THI timeseries(data not shown).As already mentioned in the introduction section,thequasi-biweeklyoscillationisthedominantmodeoftheintraseasonal variations of the column-integrated apparent heat source(Wang and Duan,2015).Consistent with this,Yang et al.(2016)identi fi ed a quasi-biweekly mode of the intraseasonal oscillations in the eastern TP summer rainfall.
In addition,Fig.2a also shows that the maximum regression center of the diabatic heating rate lies in the upper troposphere,and a maximum center appears in the further higher layer up to 150 hPa around the peak day of the THI[day(0)].This clearly indicates the further vertical deepening of the convective LH with the maturing of TPUHS events.From the lead/lag regressions of the surface diabatic heating rate over the TP against the THI,it is easy to identify that the surface SH is always much weaker than the LH in the upper atmosphere throughout the entire period(Fig.2b).This again con fi rms that the sub-monthly variations of the TP heat source are indeed dominated by condensation LH in the upper atmosphere.
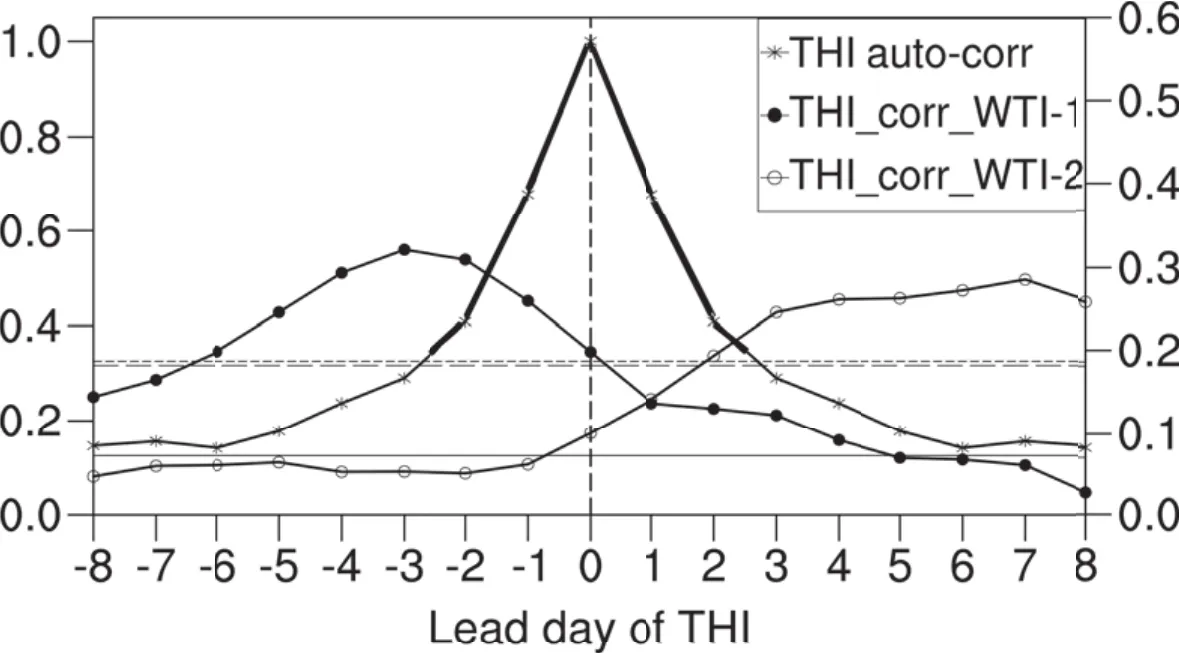
Fig.3.Lead/lag auto-correlation of the THI(asterisks,left ordinate),and crosscorrelation(right ordinate)between the THI and WTI1(dots)and that between THI and WTI2(circles).The thickened curve indicates the THI auto-correlation that is above 1/e.The horizontal solid,long-dashed and short-dashed lines denote the 99%con fi dence level for the THI auto-correlation,the THI–WTI1 cross-correlation,and the THI–WTI2cross-correlation,respectively,based on t-test.

Fig.4.Regression of(a)column-integrated apparent heat source(units:W m−2)and(b)surface sensible heat fl ux(units:W m−2)against the THI.Stippling indicates regressions above the 95%con fi dence based on the t-test.Blue contours delineate the TP’s topographic boundary of 1500 m.
Figure 4 further shows the spatial regression patterns of the column-integrated heat source(Fig.4a)and that of the surface sensible heat fl ux(Fig.4b)in boreal summer.It can be seen that anomalous TPUHS events are characterized by signi fi cant anomalous hQ1i over most of the TP region,except its far western part(Fig.4a).In contrast,signi fi cant SH anomalies are only found over the western TP and along the southern boundary area of the TP.This further con fi rms the overwhelming dominance of the upper-atmospheric LH source over the SH heat source in boreal summer.
3.3. Accompanying variations of the local circulation anomalies over the TP
Figure 5 shows the lead/lag regressions of the local mean circulation anomalies over the TP region against the THI in boreal summer.As an anomalous TPUHS grows[before day(0)],anomalous convergence/divergence in the lower/upper troposphere(shading)and anomalous ascent in the troposphere intensi fi es(contours),indicating the development of anomalous deep convection over the TP(Fig.5a).And after the peak[day(0)]of the anomalous TPUHS,they begin to weaken and gradually diminish within about four days[day(+4)].Because of the greatly deepened convection and the elevated strong LH release,the anomalous warm center that was originally located around 300 hPa before day(−4)is further elevated to about 150 hPa and above until the peak day[day(0)](Fig.5b).Although gradually weakening after day(+2),the warm center stays in this layer throughout the decaying period of the TPUHS.Owing to the much-elevated anomalous warm center,the anomalous geopotential high center that was originally centered at 300 hPa in the upper troposphere before day(−2)is temporarily replaced by negative height anomalies from the surface to the upper layer(up to 100 hPa)around day(0)(Fig.5c).However,these negative height anomalies,resulting from the thermal e ff ect of greatly elevated LH release in the upper troposphere,are relatively weaker above 200 hPa and only exist within two days around the peak day of the heat source.This is due to the counteracting dynamic e ff ect of the persisting divergence/convergence in the upper/lower troposphere(Fig.5a),which is always supporting an anomalous high/low in the upper/lower troposphere.Also associated with the greatly elevated heat source,the horizontal vorticity,originally characterized by positive/negative anomalies in the lower/upper troposphere,begins to be dominated by positive vorticity anomalies throughout the troposphere up to 50 hPa from day(−1)(Fig.5d).These results clearly indicate that the strong thermal e ff ect of the greatly elevated LH around the peak day of the TPUHS may temporarily o ff set the anomalous circulation pattern(anticyclonic circulation above cyclonic circulation)that prevails during the earlier developing period of the TPUHS.

Fig.5.Lead/lag regressions against the THI of the area-mean(a)horizontal divergence(shaded;units:10−6 s−1)and vertical velocity(contours;units:10−3Pa s−1;only those statistically signi fi cant above the 90%confi dence level are shown),(b)air temperature(units:◦C),(c)geopotential height(units:gpm),and(d)relative vorticity(units:10−6s−1)in the atmospheric column over the TP.Stippling in all panels indicates regressions above the 90%con fi dence level based on the t-test.The abscissa is the lead time of the THI(units:d);the ordinate is the pressure level(units:hPa).
4.Di ff erentRWT patterns during the developing/decaying period of anomalous TPUHS
4.1.RWT patterns
4.1.1.From vorticity anomalies
Figure 6 shows the lead/lag regressions of the 200-hPa zonal wind(contours)and relative vorticity(shading)anomalies in the Northern Hemisphere against the THI during summer.Firstly,it is clear that,when the TPUHS or the convective LH anomaly is weak and begins to grow from day(−7)to day(−5)(Figs.6a and b),signi fi cant negative vorticity anomalies dominate the TP,indicating an anomalous SAH relatedtotherelativelyweakandshallowTPUHSaccompanied by minor surface SH over the summer TP.Meanwhile,positive vorticity anomalies exist in two areas from the Caspian region to Kazakhstan and from northeastern China to Japan.Correspondingly,positivezonalwind anomaliesappeartothe north of the TP and extend along the latitudinal band from the northwestern TP to southern Japan.Together with the negative zonal wind anomaly centers existing north of the positive vorticity anomaly centers mentioned above,the zonal wind anomalies favor a slightly weakening and southward-shifting of the subtropical westerly jet(SWJ)axis(thick dashed line)located just to the north of the TP(Fig.6b).Along the SWJ axis,a clear teleconnection pattern of vorticity anomaly centers can be identi fi ed downstream as well as upstream of the TPduringthistime.Speci fi cally,thedownstreamteleconnection pattern consists of fi ve centers(marked “P”,“Q”,“R”,“S”and “T”)from the negative vorticity center(“P”)over the TP to the negative vorticity center(“T”)over the northeastern Paci fi c and west coast of North America;and the upstream teleconnection pattern includes four centers(marked“M”,“N”,“O”and “P”)from “M”near the Baltic Sea to “P”over the TP(Fig.6b).As the TPUHS continues to grow,the negative vorticity center over the TP gradually shifts south-ward from day(−4)to day(−3)(Figs.6c and d).Accompanying this is the southward-shifting westerly anomaly center to its north,thus favoring a further southward shift of the SWJ axis.The negative vorticity center“R”tends to split and weakens and shifts westward,while the“Q”center becomes strengthened and shifts westward to North China.A new branch of the downstream teleconnection pattern seems to appear,from “Q”to“S”via the negative vorticity center“R1”over the central North Paci fi c(Fig.6d).Also associated with the weakening and southward shifting of the SWJ axis,the upstream teleconnection pattern is signi fi cantly weakened until day(−3)(Fig.6d).

Fig.6.Lead/lag regressions against the THI of the relative vorticity anomalies(shaded;units:10−6s−1)and the zonal wind anomalies(contours;units:m s−1;interval:1;zero line omitted for clarity)at 200 hPa when the THI leads for(a)−7 days,(b)−5 days,(c)−4 days,(d)−3 days,(e)−1 day,(f)0 days,(g)2 days,(h)4 days,(i)6 days and(j)8 days.Hatched and stippled areas denote the 90%con fi dence level for relative vorticity anomalies and for zonal wind anomalies,respectively.The thick dashed line denotes the climatological westerly jet axis(>20 m s−1)during the period from 20 July to 20 August.The numbers in the upper-left corner of each panel indicate the lead time of the THI.The blue letters mark the RWT and the anomaly centers along it.
After,when the TPUHS is further intensi fi ed,the negative vorticity center“P”shifts further southward,away from the TP region,until day(−1)(Fig.6e).A much stronger westerly anomaly center is then located just over the TP region,which corresponds to a maximum positive vorticity anomaly center to its north.Thereafter,a meridional tripole pattern of vorticity anomalies,as well as zonal wind anomalies,from the south to the north of the TP region,forms(Figs.6e and f).The tripole pattern exists from day(−1)to day(+1)(data not shown),while the original teleconnection pattern downstream of the TP no longer exists during this time(Figs.6e and f).This implies that the maturing of an anomalous TPUHS event can temporarily disrupt the teleconnection pattern that has developed during the developing period of the TPUHS,by o ff setting the anomalous atmospheric circulation structure over the TP,as already shown in Fig.5.
With the decay of anomalous TPUHS events,and the weakening of the negative vorticity center south of the TP,both the strong westerly anomaly center over the TP and the associated meridional tripole pattern mentioned above quickly diminish from day(+2)to day(+4)(Figs.6g and h).However,the negative vorticity center north of the TP that originally extended eastward,begins to develop near the Baikal region(denoted as “B”).Later,we show that this anomalous anticyclone center is dynamically forced and exhibits a deep barotropic structure.With the intensi fi cation of this“B”center and the associated strong easterly anomaly center to its south afterwards,the SWJ tends to be mainly weakened in the upstream region from the eastern Caspian Sea to the northern TP,whereas it mainly shifts southward over its exit region(Figs.6g and h).Related to this,a new teleconnection pattern(B–C–D–E)seems to gradually form downstream along the SWJ axis.This new teleconnection pattern,with four vorticity anomaly centers(marked “B”,“C”,“D”and “E”)from region “B”near Baikal to “E”over the northeastern Paci fi c,becomes the most apparent until day(+8),when the TPUHS event has largely decayed(Fig.6j).
4.1.2.From geopotential height and wave fl ux anomalies
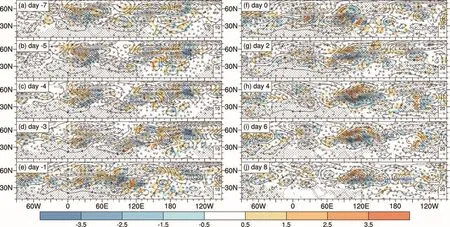
Fig.7.Lead/lag regressions against the THI of the geopotential height anomalies(contours;units:gpm;interval:4),the wave activity fl ux anomalies(vectors;units:10−2m2s−2;amplitudes larger than 0.6 are shown)calculated from the lead/lag regressions of stream function,and the wave activity fl ux divergence anomalies(shaded;units:10−5m s−2)at 200 hPa when the THI leads for(a)−7 days,(b)−5 days,(c)−4 days,(d)−3 days,(e)−1 day,(f)0 days,(g)2 days,(h)4 days,(i)6 days and(j)8 days.Stippling denotes the 90%con fi dence level for geopotential height anomalies,and the blue lines in(c),(d)and(j)delineate the Rossby wave rays.The numbers in the upper-left corner of each panel indicate the lead time of the THI.The blue letters and rays mark the RWT and the anomaly centers along it.
To con fi rm that the TPUHS-related teleconnection patterns identi fi ed above are RWTs,we similarly display in Fig.7 the lead/lag regressions of geopotential height and horizontal Eliassen–Palm(EP) fl ux and its divergence anomalies.It is clear that the height anomaly centers exhibit teleconnection patterns similar to those of the vorticity anomaly centers in Fig.6;plus,the signi fi cant anomalous EP fl ux fl ow that links the teleconnection centers clearly indicates that the teleconnection patterns are indeed RWTs.Speci fi cally,for the teleconnection pattern downstream of the TP at day(−7)when the TPUHS is weak,the wave- fl ux fl ow is mainly in the midlatitudesalongthe zonaldirection.Subsequently,the teleconnection anomaly centers during this time are seen mainly to be linked by this midlatitude wave- fl ux fl ow from the Baikal region,while the wave- fl ux fl ow from the TP region is still relatively trivial(Fig.7a).With the growth of the TPUHS and the southward shifting of the SWJ later on,the midlatitude wave- fl ux fl ow gradually weakens,while that originating from the TP region increases and gradually becomes the main wave- fl ux fl ow linking the anomaly centers(P–Q–R1–S–T)(Figs.7b–d).This suggests that,during the developing period of the TPUHS,the TP-related wave- fl ux fl ow can strongly modulate the RWT pattern in the extratropics,and is mainly responsible for a signi fi cant RWT pattern that extends from the TP to the northeastern Paci fi c and western coastal region of North America.
However,it should be noted that the wave- fl ux direction accompanying the upstream teleconnection pattern is southeastward rather than northwestward,indicating that this RWT is not originated from the TP region but from the North Atlantic region.Based on the climatological mean wave fl ux pattern(data not shown),we know that this RWT is a recurrent teleconnection pattern that plays an important role in linking the climate anomalies over the North Atlantic region to those over the Asian region(Chang et al.,2001;Buermann et al.,2005;Ren and Hu,2014).Nevertheless,this recurrent RWT pattern largely diminishes and breaks up around the TPUHS peak from day(−1)(Figs.7e and f),as also shown in Fig.6.
Around the TPUHS peak from day(−1),the anomalous high over the TP during the developing period is gradually replaced by an anomalous low,as already shown in Fig.5.This displacement of the geopotential anomaly center over the TP also results in the break-up of the downstream RWT(P–Q–R1–S–T)due to the displacement of the wave fl ux source(Figs.7e and f).Furthermore,the anomalous low over the TP(especiallyitswesternpart)inturnseemstoactasanewwave source,which points to the Baikal region and corresponds to signi fi cant intensi fi cation of an anomalous high center over the Baikal region from day(+1)(data not shown)to day(+4)(Figs.7g and h).Although the anomalous TP low weakens quickly after day(+1),the wave- fl ux fl ow from the western TP to the Baikal region is persistently clear(Figs.7g–i).This implies a clear linkage between the anomalous TP low and the anomalous Baikal high(center “B”),despite the zonal wave- fl ux fl ow in the midlatitudes seeming also to contribute to the intensi fi cation of center“B”during this time.After,center“B”becomes the main wave- fl ux divergence center for a new RWT that extends eastward,and a continuous eastward wave- fl ux fl ow from “B”to“E”becomes clear until day(+8)(Figs.7j).
4.2.Barotropic structure of the RWTs
After showing the di ff erent RWT patterns from the developing to the decaying period of the TPUHS,next we diagnose the vertical structure of the anomaly centers along the RWTs.To do this,we choose day(−3)and day(+8),when the RWTs are the most pronounced,and show in Fig.8 the vertical cross sections of the regressed geopotential height anomalies along the RWTs.It can be seen that the geopotential height anomaly centers along both RWTs consistently exhibit an equivalent barotropic structure.The exception is the anomaly center“P”over the TP at day(−3),which is anomalously positive/negative above/below 500 hPa and shows a general baroclinic structure.This demonstrates that these anomaly centers are indeed forced by dynamical processes associated with the RWTs;meanwhile,center“P”over the TP,which acts as the main wave source of the RWT P–Q–R1–S–T from day(−5)to day(−3)during the developing period of the TPUHS,is primarily thermally forced.

Fig.8.Vertical cross sections of the regressed geopotential height anomalies(contours;units:gpm;interval:2)(a)along the P–Q–R1–S–T RWT at day(−3),and(b)along the B–C–D–E RWT at day(+8).Shaded areas indicate the 90%con fi dence level of regression,based on the t-test.
Furthermore,although the anomalously positive“P”center becomes relatively weaker with the growth of the TPUHS until day(−3),it is obvious that other anomaly centers along the RWT P–Q–R1–S–T are stronger and exhibit a much deeper vertical structure than those along the RWT B–C–D–E(Fig.8a vs Fig.8b).The signi fi cant anomalies along the former RWT can span vertically from the lower troposphere tothestratosphereupto50hPa(Fig.8a),whereasthosealong the RWT B–C–D–E are mostly con fi ned to below 100 hPa—except center“B”,which also spans beyond 30 hPa.The vertically deep structure of the anomaly centers along the RWTs implies that the RWTs may have signi fi cant e ff ects on the circulation systems in the northern extratropics.
5.E ff ects of the RWTs on circulation and weather in the northern extratropics
5.1.RWT indices
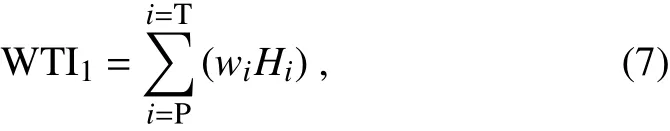
To demonstrate the e ff ects of the TPUHS-related RWTs on circulation and weather in the extratropics,we de fi ne two RWT indices to capture the synoptic variabilities of the RWTs more e ff ectively than using the THI index.The indices are based mainly on the RWT patterns on day(−3)and day(+8),when the RWTs are the most pronounced and complete.For the RWT during the developing period of the TPUHS,we choose to de fi ne the index based on the P–Q–R1–S–T branch.Speci fi cally,with this RWT as an example,we fi rst calculate the weight coefficients(wi)for the fi ve anomaly centers based on their relative intensities on day(−3),

where hiis the maximum value of the geopotential height anomaly center i(P,Q,R1,S,T).We then use the wito defi ne the daily RWT index for the developing period of the TPUHS(denoted as WTI1)through
where Hiisthe dailynormalized geopotential height anomaly time series for the anomaly centers.Similarly,the daily RWT index for the decaying period of the TPUHS(denoted as WTI2)is de fi ned as

Where wjis as same as wi,but for the geopotential height anomaly center j(B,C,D,E).Obviously,the values of the WTI1and WTI2daily indices fall within the range 0–1.As expected,Fig.3 shows that the two de fi ned wave indices are signi fi cantly correlated with the THI,and the maximum correlationappearsonthedaywhenWTI1leadstheTHIbythree days[day(−3)],and on the day when WTI2lags the THI by seven days[day(+7)].Below,based on these two wave indices,we diagnose the e ff ects of the TPUHS-related RWTs on circulation and weather in the extratropics.
5.2.E ff ects of the TPUHS-related RWT during the TPUHS developing period
Figure 9 shows the regressed anomaly patterns of the geopotential height at 200 hPa and 500 hPa(shading in Figs.9a and b),surface air temperature(Ts,Fig.9d),and 850 hPa wind and daily precipitation(Fig.9c)anomalies,against the fi rst RWT index(WTI1)de fi ned above.Firstly,it is apparent that the geopotential height anomaly patterns in Figs.9a and b are largely similar to that shown in Fig.7d,because of the signi fi cant relationship between the THI and WTI1shown in Fig.3.From the circulation patterns of the summer climatology(contours in Figs.9a and b),it is clear that the growth of the TPUHS can indeed exert a series of local and remote impacts on the circulation systems along the RWT in the troposphere.Speci fi cally,the positive “P”over the southern TP and the stronger negative“Q”together yield a slightly stronger but southward-shifted SAH along with a southward shifting of the SWJ(Fig.9a;also shown in Fig.7d).This corresponds to an anomalously stronger and southward-shifted NWPSH at 500 hPa over southeastern China(Fig.9b).On the other hand,the coexisting negative“Q”and downstream positive “R1”centers support an eastward extension of the SAH to the northwestern Paci fi c region(Fig.9a),and a strengthening of the NWPSH below in the middle troposphere over that region,which in turn favors a patternwithalowtothewestandahightotheeast(ora“lowwest–high-east”pattern)over the region from eastern China to the northwestern Paci fi c region(Fig.9b).Therefore,we can see that the wave-train-related anomalous precipitation zone in East Asia is southwest–northeast oriented—from the southeastern TP,the middle and lower reaches of the Yangtze and Huaihe river valleys,to Japan—where the anomalous lower-tropospheric fl ow converges(Fig.9c).Accompanying this is anomalously low Tsover the region from East China to Japan(Fig.9d).Meanwhile,negative precipitation and warm Tsanomalies exist to the south and north of the positive precipitation anomaly zone,respectively(Figs.9c and d).
Similarly,by supporting the formation of a low-west–high-east pattern over the west coast of North America,the negative“S”anddownstreampositive“T”centersareresponsible for the positive precipitation anomaly center in that region,as well as the cold Tsanomalies over a wider region of the North Paci fi c,Alaska and northeast of Kamchatka(Figs.9a–d).Meanwhile,the positive geopotential height anomalies related to center“T”over the eastern North Paci fi c act to weaken the TUTT over the northern Paci fi c(Fig.9a),which is another important circulation system in the upper troposphere in northern summer(Kelly and Mock,1982).The weakening of the TUTT obviously weakens the southwest-erly fl ow from the eastern North Paci fi c to the western part of the United States,which should prevail in boreal summer(Fig.9a).This corresponds to the warm Tsanomalies over the North America region(Fig.9d),although no signi fi cant negative precipitation anomalies appear(Fig.9c).

Fig.9.The regressed(a)200-hPa and(b)500-hPa geopotential height anomalies(shaded;units:gpm),(c)daily rainfall and 850-hPa wind(vectors;units:m s−1)anomalies(shaded;units:mm),and(d)surface air temperature anomalies(shaded;units:◦C)against the RWT index WTI1.Contours denote the corresponding summertime(20 July to 20 August)climatology(units:gpm;interval:40).Stippling indicates the 90%con fi dence level of the regression,based on the t-test.
5.3.E ff ects of the TPUHS-related RWT during the TPUHS decaying period
Firstly,it can be seen from Fig.10 that the precipitation and Tsanomalies associated with the second TPUHS-related RWT are much weaker and largely scattered(Figs.10c and d),due to the relatively weaker anomaly centers along the RWT(Figs.10a and b).Since the SAH as well as the NWPSH show less signi fi cant changes during this time(Figs.10a and b),the precipitation anomalies are largely scattered over most of East and South China,and the Tsanomalies are only weakly negative over the region from East China to Japan(Figs.10c and d).Nevertheless,it is clear that the positive“B”and negative “C”centers support a high-west–low-east pattern from the Baikal region to the east of Japan,responsible for the strong and warm Tsanomalies over a wider regionofNortheastAsia(Fig.10d).Aroundtheregionbetween the negative“C”and downstream positive“D”center,significantly positive precipitation anomalies exist over the North Paci fi c to the east of the Japan region(Fig.10c).In addition,the geopotential height anomalies associated with the positive“D”,and downstream negative“E”centers,and the even weaker positive center southeast of center“E”,contribute to deepen the TUTT(Fig.10a);however,this only results in weak and cold Tsanomalies over the northwest region of North America and over the northeastern North Paci fi c(Fig.10d),due to the weak intensity of the centers along this RWT.

Fig.10.As in Fig.9 but for the regression against the RWT index WTI2.
6.Summary
This study concerns the sub-monthly variability of the upper atmospheric heat source over the TP and the related RWTs in the northern extratropics in summer.To e ff ectively capture the variability of the TPUHS over the entire TP region,our study mainly focuses on the period from 20 July to 20 August,when the climatological westerly jet resides just to the north of the TP.We fi rst identify that the dominant variability of the TPUHS in summer(July–August)is quasibiweekly;and with the intensive development of an anomalous TPUHS event,the further elevated LH heating may temporarily o ff set the anomalous atmospheric circulation structure(anticyclonic circulation above cyclonic circulation)that prevails during the earlier developing period of the TPUHS,temporarily resulting in a low anomaly center over the TP in the upper troposphere where the SAH usually exists.However,this thermally forced anomalous low center diminishes rapidly due to the counteracting dynamic e ff ect of the persisting lower/upper convergence/divergence over the TP.
During the developing period of a TPUHS event,an anomalous high corresponding to weak and shallow LH over the TP acts as the main wave source of a southernbranch RWT(P–Q–R1–S–T)along the SWJ from day(−5)to day(−3),which extends northeastward and eastward to the northeastern Paci fi c and west coast of North America.However,accompanying the southward shift of the anomalous TP high,and the replacement by an anomalous TP low around the TPUHS peak,this TPUHS-related RWT is broken up from day(−1).Nevertheless,the existing anomalous low during this time then temporarily acts as a wave source to connect to an anomalous high over the Baikal region.After the anomalous TP low quickly diminishes,this strong anomalous Baikal high becomes the main wave source of a new RWT during the decaying period of the TPUHS.This RWT extends eastward from the Baikal region to the northeastern Paci fi c around eight days after the TPUHS peak.
Compared to that during the decaying period of the TPUHS,the RWT pattern during the developing period is stronger and presents a much deeper barotropic structure.Correspondingly,the signi fi cant extratropical in fl uences of the earlier RWT during the developing period of the TPUHS are much stronger and more systematic than those of the later RWT during the decaying period of the TPUHS.By modulating the circulation systems in the northern extratropics,the earlier RWT is associated with an anomalous southwest–northeast-oriented precipitation band extending from the southern TP and the middle and lower reaches of the Yangtze and Huaihe river valleys to Japan,whereas the later RWT only yields a signi fi cant precipitation anomaly center over the North Paci fi c—mainly to the east of Japan.The Tsanomalies associated with the earlier RWT are also generally stronger than those associated with the later one.
This study demonstrates the varying RWT patterns from the developing to the decaying period of anomalous TPUHS events,and investigates the related thermodynamic processes and the remote climate e ff ects of the TPUHS-related RWTs.The dynamic processes responsible for the linkage between the TPUHS variation and the changes in the RWT pattern are also illustrated.However,as already indicated in section 4,the RWT patterns identi fi ed in this study might be implicitly contributed by the midlatitude RWT prevailing in boreal summer,including the upstream RWT originated from the Atlantic.However,the possible e ff ects of midlatitude circulation on the local circulation anomalies over the TP are subject to further investigations in the future.Nevertheless,the demonstrated RWT patterns are what we can always observe during the life cycle of anomalous TPUHS events.In our group’s future work,we will also use general circulation models to simulate the RWT patterns that are purely excited by the anomalous TPUHS,and provide further evidence of the mechanisms,processes and the variations of the TPUHS-related RWTs.
Acknowledgements.Thanks to the two anonymous reviewers for their constructive comments and suggestions.This work was jointly supported by the National Science Foundation of China(Grant Nos.91437105,41575041 and 41430533)and the China Meteorological Administration Special Public Welfare Research Fund(Grant No.GYHY201406001).We are grateful for the availability of the NCEP–NCAR reanalysis dataset via the website http://www.esrl.noaa.gov/psd/data/gridded/data.ncep.reanalysis.html,and the GPCP dataset via http://precip.gsfc.nasa.nov/.
REFERENCES
Bolvin,D.T.,R.F.Adler,G.J.Hu ff man,E.J.Nelkin,and J.P.Poutiainen,2009:Comparison of GPCP monthly and daily precipitation estimates with high-latitude gauge observations.Journal of Applied Meteorology and Climatology,48,1843–1857,https://doi.org/10.1175/2009JAMC2147.1.
Bretherton,C.S.,M.Widmann,V.P.Dymnikov,J.M.Wallace,and I.Blad´e,1999:The e ff ective number of spatial degrees of freedom of a time-varying fi eld.J.Climate,12,1990–2009,https://doi.org/10.1175/1520-0442(1999)012<1990:TENOSD>2.0.CO;2.
Buermann,W.,B.Lintner,and C.Bon fi ls,2005:A wintertime Arctic Oscillation signature on early-season Indian Ocean monsoonintensity.J.Climate,18,2247–2269,https://doi.org/10.1175/JCLI3377.1.
Chang,C.P.,P.Harr,and J.H.Ju,2001:Possible roles of Atlantic circulations on the weakening Indian monsoon rainfall-ENSO relationship.J.Climate,14,2376–2380,https://doi.org/10.1175/1520-0442(2001)014<2376:PROACO>2.0.CO;2.
Chen,L.X.,E.R.Reiter,and Z.Q.Feng,1985:The atmospheric heat source over the Tibetan Plateau:May-August 1979.Mon.Wea.Rev.,113,1771–1790,https://doi.org/10.1175/1520-0493(1985)113<1771:TAHSOT>2.0.CO;2.
Chen,L.X.,Q.G.Zhu,H.B.Luo,J.H.He,M.Dong,and Z.Q.Feng,1991:The East Asian Monsoon.Chinese Meteorological Press,362 pp.(in Chinese)
Duan,A.M.,2003:The in fl uence of thermal and mechanical forcing of Tibetan Plateau upon the climate patterns in East Asia.PhD Dissertation,Institute of Atmospheric Physics,Chinese Academy of Sciences,23–31.(in Chinese)
Duan,A.M.,Y.M.Liu,and G.X.Wu,2005:Heating status of the Tibetan Plateau from April to June and rainfall and atmospheric circulation anomaly over East Asia in midsummer.Science in China Series D:Earth Sciences,48,250–257,https://doi.org/10.1360/02yd0510.
Duan,A.M.,W.R.Wang,Y.H.Lei,and Y.F.Cui,2013:Trends in summer rainfall over China associated with the Tibetan Plateau sensible heat source during 1980–2008.J.Climate,26,261–275,https://doi.org/10.1175/JCLI-D-11-00669.1.
Duan,A.M.,G.X.Wu,Y.M.Liu,Y.M.Ma,and P.Zhao,2012:Weather and Climate E ff ects of the Tibetan Plateau.Adv.Atmos.Sci.,29,978–992,https://doi.org/10.1007/s00376-012-1220-y.
Flohn,H.,1960:Recent investigation on the mechanism of the“summer monsoon”of southern and eastern Asia.Proc.Symp.Monsoon of the World,New Delhi,Hind Union Press,75–88.
Grose,W.L.,and B.J.Hoskins,1979:On the in fl uence of orography on large-scale atmospheric fl ow.J.Atmos.Sci.,36,223–234,https://doi.org/10.1175/1520-0469(1979)036<0223:OTIOOO>2.0.CO;2.
Hoskins,B.J.,and D.J.Karoly,1981:The steady linear response of a spherical atmosphere to thermal and orographic forcing.J.Atmos.Sci.,38,1179–1196,https://doi.org/10.1175/1520-0469(1981)038<1179:TSLROA>2.0.CO;2.
Huang,R.H.,1985:The in fl uence of the heat source anomaly over Tibetan Plateau on the northern hemispheric circulation anomalies.Acta Meteorologica Sinica,43,208–220,https://doi.org/10.11676/qxxb1985.026.(in Chinese)
Huang,R.H.,and K.Gambo,1981:The response of a model atmosphere in middle latitude to forcing by topography and stationary heat sources.J.Meteor.Soc.Japan,59,220–237,https://doi.org/10.2151/jmsj1965.59.2_220.
Jiang,X.W.,Y.Q.Li,S.Yang,K.Yang,and J.W.Chen,2016:Interannual variation of summer atmospheric heat source over the Tibetan Plateau and the role of convection around the western Maritime Continent.J.Climate,29,121–138,https://doi.org/10.1175/JCLI-D-15-0181.1.
Kalnay,E.,and Coauthors,1996:The NCEP/NCAR 40-year reanalysis project.Bull.Amer.Meteor.Soc.,77,437–471,https://doi.org/10.1175/1520-0477(1996)077<0437:TNYRP>2.0.CO;2.
Kelly,W.E.,Jr.,and D.R.Mock,1982:A diagnostic study of upper tropospheric cold lows over the western north paci fi c.Mon.Wea.Rev.,110,471–480,https://doi.org/10.1175/1520-0493(1982)110<0471:ADSOUT>2.0.CO;2.
Krishnamurti,T.N.,S.M.Daggupaty,J.Fein,M.Kanamitsu,and J.D.Lee,1973:Tibetan high and upper tropospheric tropical circulations during northern summer.Bull.Amer.Meteor.Soc.,54,1234–1249.
Lin,Z.D.,and R.Y.Lu,2008:Abrupt northward jump of the East Asian upper-tropospheric jet stream in mid-summer.J.Meteor.Soc.Japan,86,857–866,https://doi.org/10.2151/jmsj.86.857.
Liu,X.,W.P.Li,and G.X.Wu,2002:Interannual variation of the diabatic heating over the Tibetan Plateau and the Northern Hemispheric circulation in summer.Acta Meteorologica Sinica,60,267–277,https://doi.org/10.3321/j.issn:0577-6619.2002.03.002.(in Chinese)
Liu,X.,G.X.Wu,W.P.Li,and Y.M.Liu,2001a:Thermal adaptation of the large-scale circulation to the summer heating over the Tibetan Plateau.Progress in Natural Science,11,207–214.
Liu,Y.M.,G.X.Wu,and R.C.Ren,2004:Relationship between the subtropical anticyclone and diabatic heating.J.Climate,17,682–698,https://doi.org/10.1175/1520-0442(2004)017<0682:RBTSAA>2.0.CO;2.
Liu,Y.M.,B.J.Hoskins,and M.Blackburn,2007b:Impact of Tibetan orography and heating on the summer fl ow over Asia.J.Meteor.Soc.Japan,85B,1–19,https://doi.org/10.2151/jmsj.85B.1.
Liu,Y.M.,Q.Bao,A.M.Duan,Z.A.Qian,and G.X.Wu,2007a:Recent progress in the impact of the Tibetan Plateau on climate in China.Adv.Atmos.Sci.,24,1060–1076,https://doi.org/10.1007/s00376-007-1060-3.
Luo,H.B.,and M.Yanai,1983:The large-scale circulation and heat sources over the Tibetan Plateau and surrounding areas during the early summer of 1979.Part I:Precipitation and kinematic analyses.Mon.Wea.Rev.,111,922–944,https://doi.org/10.1175/1520-0493(1983)111<0922:TLSCAH>2.0.CO;2.
Luo,H.B.,and M.Yanai,1984:The large-scale circulation and heat sources over the Tibetan Plateau and surrounding areas during the early summer of 1979.Part II:Heat and moisture budgets.Mon.Wea.Rev.,112,966–989,https://doi.org/10.1175/1520-0493(1984)112<0966:TLSCAH>2.0.CO;2.
Mason,R.B.,and C.E.Anderson,1963:The development and decay of the 100-MB.Summertime anticyclone over southern Asia.Mon.Wea.Rev.,91,3–12,https://doi.org/10.1175/1520-0493(1963)091<0003:TDADOT>2.3.CO;2.
Murakami,M.,and Y.H.Ding,1982:Wind and temperature changes over Eurasia during the early summer of 1979.J.Meteor.Soc.Japan,60,183–196,https://doi.org/10.2151/jmsj1965.60.1_183.
Nigam,S.,C.Chung,and E.DeWeaver,2000:ENSO diabatic heating in ECMWF and NCEP-NCAR reanalyses,and NCAR CCM3 simulation.J.Climate,13,3152–3171,https://doi.org/10.1175/1520-0442(2000)013<3152:EDHIEA>2.0.CO;2.
Nitta,T.,1983:Observational study of heat sources over the eastern Tibetan Plateau during the summer monsoon.J.Meteor.Soc.Japan,61,590–605,https://doi.org/10.2151/jmsj1965.61.4_590.
Plumb,R.A.,1985:On the three-dimensional propagation of stationary waves.J.Atmos.Sci.,42,217–229,https://doi.org/10.1175/1520-0469(1985)042<0217:OTTDPO>2.0.CO;2.
Reiter,E.R.,and D.Y.Gao,1982:Heating of the Tibet Plateau and movements of the South Asian high during spring.Mon.Wea.Rev.,110,1694–1711,https://doi.org/10.1175/1520-0493(1982)110<1694:HOTTPA>2.0.CO;2.
Ren,R.C.,and J.G.Hu,2014:An emerging precursor signal in thestratosphereinrecentdecadesfortheIndiansummermonsoon onset.Geophys.Res.Lett.,41,7391–7396,https://doi.org/10.1002/2014GL061633.
Ren,R.C.,Y.M.Liu,and G.X.Wu,2007:Impact of South Asia High on the short-term variation of the subtropical anticyclone over western Paci fi c in July 1998.Acta Meteorologica Sinica,65,183–197,https://doi.org/10.11676/qxxb2007.018.(in Chinese)
Rodwell,M.J.,and B.J.Hoskins,1996:Monsoons and the dynamics of deserts.Quart.J.Roy.Meteor.Soc.,122,1385–1404,https://doi.org/10.1002/qj.49712253408.
Rodwell,M.J.,and B.J.Hoskins,2001:Subtropical anticyclones and summer monsoons.J.Climate,14,3192–3211,https://doi.org/10.1175/1520-0442(2001)014<3192:SAASM>2.0.CO;2.
Romatschke,U.,R.A.J.Houze Jr.,2011:Characteristics of precipitating convective systems in the South Asian monsoon.Journal of Hydrometeorology,12,3–26,https://doi.org/10.1175/2010JHM1289.1.
Tao,S.Y.,and F.K.Zhu,1964:The 100-mb fl ow patterns in southern Asia in summer and its relation to the advance and retreat of the West-Paci fi c subtropical anticyclone over the far east.Acta Meteorologica Sinica,34,387–396,https://doi.org/10.11676/qxxb1964.039.(in Chinese)
Ueda,H.,H.Kamahori,and N.Yamazaki,2003:Seasonal contrasting features of heat and moisture budgets between the eastern and western Tibetan Plateau during the GAME IOP.J.Climate,16,2309–2324,https://doi.org/10.1175/2757.1.
Wang,M.R.,and A.M.Duan,2015:Quasi-biweekly oscillation over the tibetan plateau and its link with the Asian summer monsoon.J.Climate,28,4921–4940,https://doi.org/10.1175/JCLI-D-14-00658.1.
Wang,T.M.,G.X.Wu,and M.Ying,2011:Comparison of diabatic heating data from NCEP/NCAR(I,II)and ERA40.Acta Scientiarum Naturalium Universitatis Sunyatseni,50,128–134.(in Chinese)
Wu,G.X.,and Y.M.Liu,2000:Thermal adaptation,overshooting,dispersion,and subtropical anticyclone Part I:Thermal adaptation and overshooting.Chinese Journal of Atmospheric Sciences,24,433–446,https://doi.org/10.3878/j.issn.1006-9895.2000.04.01.(in Chinese)
Wu,G.X.,Y.M.Liu,and P.Liu,1999:The e ff ect of spatially nonuniform heating on the formation and variation of subtropical high I:Scale analysis.Acta Meteorologica Sinica,57,257–263,https://doi.org/10.11676/qxxb1999.025.(in Chinese)
Wu,G.X.,and Y.S.Zhang,1998:Tibetan Plateau Forcing and the Timing of the Monsoon Onset over South Asia and the South China Sea.Monthly Weather Review,126,913—927,https://doi.org/10.1175/1520-0493(1998)126<0913:TPFATT>2.0.CO;2.
Wu,G.X.,W.P.Li,H.Guo,H.Li,J.Xue,and Z.Wang,1997:Sensible heat driven air-pump over the Tibetan Plateau and its impacts on the Asian summer monsoon.Collections on the Memory of Zhao Jiuzhang,D.Z.Ye,Ed.,Chinese Science Press,116–126.(in Chinese)
Wu,G.X.,B.He,Y.M.Liu,Q.Bao,and R.C.Ren,2015:Location and variation of the summertime upper-troposphere temperature maximum over South Asia.Climate Dyn.,45,2757–2774,https://doi.org/10.1007/s00382-015-2506-4.
Wu,G.X.,X.Liu,Q.Zhang,Y.F.Qian,J.Y.Mao,Y.M.Liu,and W.P.Li,2002:Progresses in the study of the climate impacts of the elevated heating over the Tibetan Plateau.Climatic and Environmental Research,7,184–201,https://doi.org/10.3878/j.issn.1006-9585.2002.02.06.(in Chinese)
Wu,G.X.,Y.Liu,X.Zhu,W.Li,R.Ren,A.Duan,and X.Y.Liang,2009:Multi-scale forcing and the formation of subtropical desert and monsoon.Annales Geophysicae,27,3631–3644,https://doi.org/10.5194/angeo-27-3631-2009.
Wu,G.X.,Y.M.Liu,B.He,Q.Bao,A.M.Duan,and F.F.Jin,2012:Thermal controls on the Asian summer monsoon.Scienti fi c Reports,2,404,https://doi.org/10.1038/srep00404.
Wu,G.X.,and Coauthors,2007:The in fl uence of mechanical and thermal forcing by the Tibetan Plateau on Asian Climate.Journal of Hydrometeorology,8,770–789,https://doi.org/10.1175/JHM609.1.
Yanai,M.,and G.X.Wu,2006:E ff ects of the Tibetan Plateau.Chap.13,Asian Monsoon,B.Wang,Ed.,Springer,Chichester,513–549.
Yanai,M.,C.F.Li,and Z.S.Song,1992:Seasonal heating of the Tibetan Plateau and its e ff ects on the evolution of the Asian Summer monsoon.J.Meteor.Soc.Japan,70,319–351,https://doi.org/10.2151/jmsj1965.70.1B_319.
Yang,J.,Q.Bao,B.Wang,H.Z.He,M.N.Gao,and D.Y.Gong,2016:Characterizing two types of transient intraseasonal oscillations in the Eastern Tibetan Plateau summer rainfall.Climate Dyn.,48,1749–1768,https://doi.org/10.1007/s00382-016-3170-z.
Yang,W.Y.,D.Z.Ye,and G.X.Wu,1992:The in fl uence of the Tibetan Plateau on the summer thermal and circulation fi elds over East Asia I.The Humidity on the western Tibetan Plateau in the Height of Summer.Chinese Journal of Atmospheric Sciences,16,41–51,https://doi.org/10.3878/j.issn.1006-9895.1992.01.06.(in Chinese)
Ye,D.Z.,and Y.X.Gao,1979:Meteorology of Tibetan Plateau.Science Press,278 pp.(in Chinese)
Ye,D.Z.,and G.J.Yang,1979:The Average Vertical Circulation over the Qinghai-Xizang Plateau.Science Press.(in Chinese)
Ye,D.Z.,and G.X.Wu,1998:The role of the heat source of the Tibetan Plateau in the general circulation.Meteor.Atmos.Phys.,67,181–198,https://doi.org/10.1007/BF01277509.
Zhang,Y.,L.X.Chen,J.H.He,and W.Li,2009:A study of the characteristics of the low-frequency circulation over the Tibetan Plateau and its association with precipitation in the Yangtze River valley in 1998.Acta Meteorologica Sinica,23,175–190.
Zhao,P.,and L.X.Chen,2001:Interannual variability of atmospheric heat source/sink over the Qinghai-Xizang(Tibetan)Plateau and its relation to circulation.Adv.Atmos.Sci.,18,106–116,https://doi.org/10.1007/s00376-001-0007-3.
杂志排行

Advances in Atmospheric Sciences的其它文章
- In fl uence of Low-frequency Solar Forcing on the East Asian Winter Monsoon Based on HadCM3 and Observations
- Atmospheric Response to Mesoscale Ocean Eddies over the South China Sea
- Source Contributions to PM2.5under Unfavorable Weather Conditions in Guangzhou City,China
- Comparison of Di ff erent Generation Mechanisms of Free Convection between Two Stations on the Tibetan Plateau
- Changes in the Proportion of Precipitation Occurring as Rain in Northern Canada during Spring–Summer from 1979–2015
- Characterizing the Relative Importance Assigned to Physical Variables by Climate Scientists when Assessing Atmospheric Climate Model Fidelity