Characterizing the Relative Importance Assigned to Physical Variables by Climate Scientists when Assessing Atmospheric Climate Model Fidelity
2018-06-29SusannahBURROWSAritraDASGUPTASarahREEHLLisaBRAMERPoLunMAPhilipRASCHandYunQIAN
Susannah M.BURROWS,Aritra DASGUPTA,Sarah REEHL,Lisa BRAMER,Po-Lun MA,Philip J.RASCH,and Yun QIAN
Paci fi c Northwest National Laboratory,Richland,Washington 99354,USA
1.Introduction
A critical aspect of any climate modeling research is an evaluation of the realism,or fi delity,of the model’s simulated climate through a careful comparison with observational data.For the purposes of this discussion,we de fi ne a climate model’s “ fi delity”broadly as the agreement of the simulated climate with the observed historical and presentday climate state,typically using a combination of satellite and ground-based observations, fi eld campaign measurements,and reanalysis data products as primary sources of observational data.At climate modeling centers around the world,the development of a new model version is always followed by a calibration(“tuning”)e ff ort aimed at selecting values for model parameters that are physically justi fiable and lead to a credible simulation of climate(Hourdin et al.,2017).Model tuning involves the completion of a large number of simulations with variations in parameters,input fi les,and other features of the model.Each simulation is painstakingly evaluated,typically by examining a set of priority metrics,accompanied by manual inspection of a variety of plots and visualizations of various modeled fi elds,and detailed comparisons to determine which model con fi guration produces a credible realization of the climate.Tuning one coupled climate model requires thousands of hours of e ff ort by skilled experts.Experts must exercise judgment,based on years of training,experience,and broad and deep understanding of the model,the physical climate system,and observational constraints,in determining which trade-o ff s are defensible when di ff erent optimization goals con fl ict.
Comparisons of model fi delity across multiple model simulations are also carried out in multi-model intercomparison projects(e.g.,Gleckler et al.,2008;Reichler and Kim,2008),and in perturbed parameter ensemble experiments for the purpose of quantifying model uncertainty or sensitivities(Yang et al.,2013;Qian et al.,2015,2016).Such studies aim to understand what factors lead to inter-model diversity and drive model sensitivities and to identify potential improvements.Additionally,if an adequate single metric of overall climate model fi delity could be developed,it could be applied to construct weighted averages of climate simulation ensembles(Min and Hense,2006;Suckling and Smith,2013),and used in automatic parameter optimization algorithms(Zhang et al.,2015).
Early e ff orts to characterize multi-variable climate model fi delitycalculatedanindexofclimatemodel fi delitybycalculating a normalized root-mean-square error or similar metric for each of a selected set of model variables,and then averaging these metrics for all variables(Gleckler et al.,2008;Reichler and Kim,2008).More nuanced objective methods have been proposed to account for the inherent variability in each fi eld(Bravermanetal.,2011),andforspatialandtemporal dependencies between variables(Nosedal-Sanchez et al.,2016).
These objective methods characterize how closely models resemble observations of speci fi c variables with an increasing degree of sophistication.Nevertheless,in all such approaches,expert judgement is exercised in the selection of which variables to include.In addition,in most previous studies,an implicit decision was made to treat all variables as being of equal physical importance.By contrast,when experts evaluate model fi delity,their decision-making implicitly incorporates their understanding of the physical importance of speci fi c variables to the science questions they are interested in,and more emphasis is placed on the most physically relevant variables.Recent studies have emphasized that the selection of assessed variables should re fl ect physical understanding of the system under consideration(Knutti et al.,2017)and that di ff erent research teams may select di ff erent optimization criteria when weighting model ensemble members,depending on their goals(Herger et al.,2017).
A potential path forward is to construct a fi delity index I that combines multiple metrics mithat characterize di ff erent aspects of model fi delity,weighted by their relative importance wi:

However,since the relative “importance”of di ff erent optimization goals is inherently subjective,any such index,including one in which all wiare equal,will be susceptible to criticism that the weights chosen are arbitrary.
Since expert judgement cannot be fully eliminated from the model evaluation process,we propose that it would be valuable to better understand and quantify the relative importance climate modelers assign to di ff erent aspects of model fi delity when making decisions about trade-o ff s.In addition,we believe it is important to quantify the degree to which consensus exists about the importance of such variables.In the longer term,we envision that this information can be used to develop metrics that quantify both the mean and the variability of the community’s judgements about climate model fi delity.
This paper reports on our fi rst step towards this long-term goal:the establishment of a baseline understanding of the level of importance that experts explicitly state they assign to di ff erent variables when evaluating the mean climate state of the atmosphere of a climate model.To this end,we conducted a large international survey of climate model developers and users,and asked them to indicate their view of the relative importance of a subset of variables used in assessing model fi delity,in the context of particular scienti fi c goals.The speci fi c aims of this study are to:(1)quantify the extent of consensus among climate modelers on the relative importance of di ff erent variables in evaluating climate models;(2)document whether modelers adjust their importance weights depending on the scienti fi c purpose for which a model is being evaluated;(3)determine whether either importance rankings or degree of consensus vary as a function of an individual’s experience or domain of expertise;and(4)provide baseline information for a planned follow-up study,a mock model evaluation exercise.In the follow-up study,described in more detail in section 4,we will investigate whether experts’assessments of models,on the basis of plots and metrics describing model–observation comparisons,are consistent with the relative importance that these experts previously assigned to individual variables for the assessment of model fi delity,with respect to speci fi c science goals.
We describe the present study in the following sections.Section 2 describes the design of the survey,recruitment of participants,and methods used in analyzing survey responses.Section 3 describes the results of the survey,including the distribution of importance rankings,degree of consensus,dependence of responses on the speci fi c science questionsandrespondents’levelofexperience,andperceived barriers to systematic quanti fi cation of climate model fi delity.Section 4 discusses a potential approach to synthesizing expert assessments of model fi delity and objective methods for fi delity assessment,by systematically measuring and explicitly accounting for the relative importance experts assign to di ff erent aspects of fi delity.Finally,section 5 summarizes the key points and conclusions from this study.
2.Survey design and methods
2.1.Survey aims,design and scope
We conducted a large international survey to document and understand the expert judgments of the climate modeling community on the relative importance of di ff erent model variables in the evaluation of simulation fi delity.
To keep the scope of this study focused,we only considered the evaluation of the annual mean climatology of an atmosphere-only model simulation,with prescribed SST.In addition,participants were asked to assume that their evaluation would be carried out only on the basis of scalar metrics(e.g.,RMSE,correlation)characterizing the agreement of the respective model fi eld with observations.
Transient features of climate were intentionally excluded from this study,but are of critical importance in model evaluation,and should be explored in future work.Similarly,coupled climate models have more complex tuning criteria that are not considered here.
We chose to limit the number of variables and criteria under consideration in order to encourage broader participation,and in anticipation of a planned follow-up study(described in more detail in section 4).Brie fl y,the follow-up study will invite experts to compare and evaluate climate model outputs,and will aim to infer the importance that expertsimplicitly assign to di ff erent aspects of model fi delity in conducting this assessment.To the best of our knowledge,this would be the fi rstattempttoexperimentallycharacterizeexpertevaluations of climate model fi delity,and so we aim to initially test the approach using a small number of key variables,which will allow for a more controlled study.The relative importance ratings and other input from experts reported in this study will both inform the design of the follow-up study and provide a priori values for Bayesian inference of the weights wi.
The importance of a particular variable in model evaluation will depend on the purpose for which the model will be used.To better constrain the responses,as well as to explore how expert rankings of di ff erent model variables might change depending on the scienti fi c objectives,we asked participants to rate the importance of di ff erent variables with respect to several di ff erent“Science Drivers”.A list of the six Science Drivers used in this survey is shown in Table 1.For each Science Driver,participants were presented with a preselected list of variables thought to be relevant to that topic,and asked to rate the importance of each variable on a sevenpoint Likert scale from “Not at all Important”to “Extremely Important”.Participants were also invited to provide written feedback identifying any “very important”or“extremelyimportant” variables that they felt had been overlooked;many took the opportunity to provide these comments,summarized in Tables S1–S3(see Electronic Supplementary Material).This feedback will be used to improve the survey design in the follow-up study.
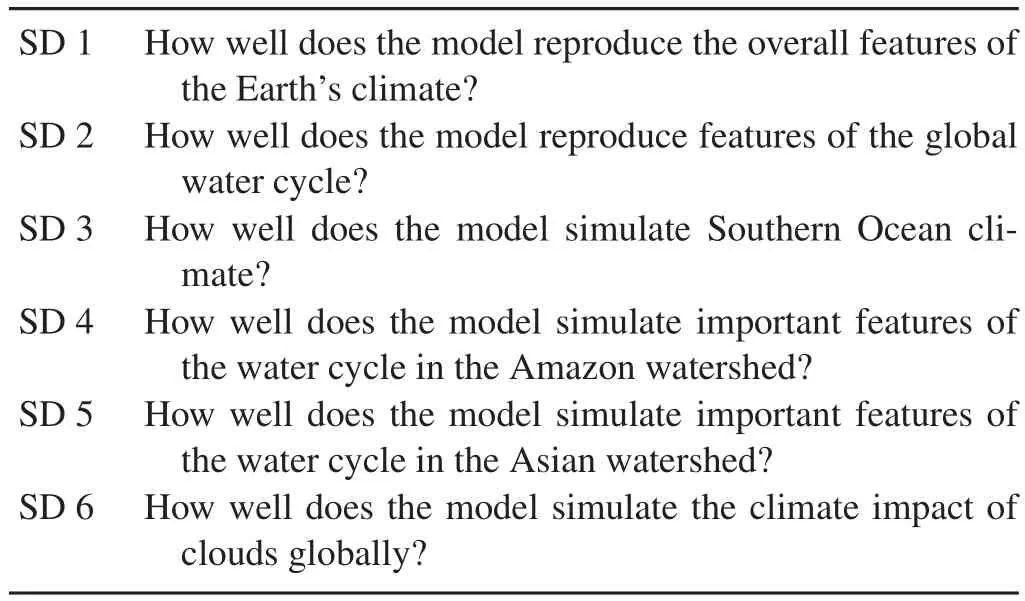
Table 1.Science Driver(SD)questions posed in this survey.
2.2. Survey recruitment,participation,and data screening
The survey was distributed via several professional mailing lists targeting communities of climate scientists,especially model developers and users,and by directly soliciting input from colleagues through the professional networks of the authors of this paper.Due to privacy restrictions,we are unable to report the identities or geographic locations of survey respondents,but we are con fi dent that they are representative of the climate modeling community.The survey was open from 18 January 2017 to 25 April 2017.Participants who had not completed at least all items on the fi rst Science Driver(N=12),and participants who rated themselves as “not at all experienced”with evaluating model fidelity(N=7)were excluded from analysis.Of the remaining 96 participants,81 had completed all six Science Drivers.
Our survey respondents were a highly experienced group,with the vast majority of participants rating themselves as either“very familiar”(40.6%)or“extremely familiar”(40.6%)with climate modeling.In addition,a large fraction of our participants had worked in climate modeling for many years,with the majority of participants(62)reporting at least 10 years’experience,and a substantial number of participants(31)reporting at least 20 years’experience with climate modeling.When asked to rate their experience in“evaluating the fi delity of the atmospheric component of global climate model simulations,”37.5%rated themselves as “very experienced,”and 20.8%as “moderately experienced”in “tuning/calibrating the atmospheric component of global climate model simulations”.An overview of the characteristics of the survey participants is shown in Fig.1.
2.3.Formal consensus measure:Coefficient of Agreement(A)
To quantify the degree of consensus among our participants,we employ a formal measure of consensus called the coefficient of agreement A(Ri ff enburgh and Johnstone,2009),which varies from values near 0(no agreement;random responses)to a maximum possible value of 1(complete consensus).Calculated values of A for the two experience groups,and their probability p of being signi fi cantly di ff erent from each other,are tabulated for all Science Drivers and variables in the Supplementary Tables S4–S6.
The coefficient of agreement is calculated from the observed disagreement dobsand the expected disagreement under the null hypothesis of random responses dexp.Let rmaxdenote the number of possible options(7 in the Likert scale used here);let r=1...rmaxdenote the possible responses(r=7 is “Extremely important”,r=6 is “Very important”,and so on);let nrdenote the number of respondents choosing the rth option,and let rmeddenote the median value of r from all respondents.The observed disagreement is then calculated as

where|rmed−r|is the weight for the rth choice.The expected disagreement is calculated as

The coefficient of agreement A is then calculated as the complement of the ratio of observed to expected disagreement:
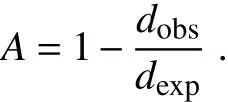
For randomly distributed responses,dobswould be close to dexp,and A would be close to zero;while for perfect agreement,dobs=0 and A=1.
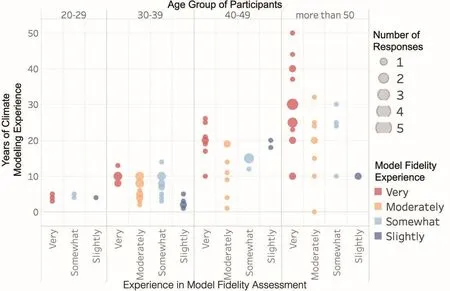
Fig.1.Characteristics of survey participants.
Because the value of A is sensitive to the total number of respondents N,the value of A is not comparable for subgroups of participants with di ff erent sizes.We performed additional signi fi cance testing to determine whether the degree of consensus was the same,or di ff erent,between our“high experience”and “low experience”groups,and/or between two survey drivers.
We test for statistically signi fi cant di ff erences between two values of the coefficient of agreement for two groups of responses,A1and A2,by performing a randomization test with the null hypothesis H0:A1=A2.To perform this test,we take l=1:100 random draws,without replacement,from the two groups of survey responses.For each lth draw,we calculate the di ff erence in the coefficient of agreement for the two groups,dl=|A1l−A2l|.We then calculate the p-value for rejection of the null hypothesis,i.e.,the probability that a di ff erence in agreement larger than the observed mean could occur by chance:

where dl,meanis the mean of all dl.
3.Survey results and discussion
Here we report on selected analyses and results from the survey.We focus primarily on:(1)the degree of consensus among experts on the importance of di ff erent model variables;(2)how responsive experts’assessments of variable importance are to the de fi ned scienti fi c objectives;and(3)di ff erences in expert ratings of variable importance between respondents with more climate modeling experience and those with less experience.
We also performed similar analyses comparing survey responses from model users and model developers.The responses of these two groups were statistically nearly identical,and so we do not report them in further detail.
3.1.Importance of di ff erent variables to climate model fidelity assessments across six Science Drivers
In this section,we discuss expert ratings of variable importance for the six science drivers.In order to understand whether participants’responses di ff ered depending on their degree of expertise,we fi rst divided the participants into two experience groups:those who rated themselves as“very experienced”in evaluating model fi delity were placed into the“high experience”group(N=36);all other participants were placed into the “low experience”group(N=60).
We emphasize that our“low experience”group consists largely of working climate scientists over the age of 30(95%),with a median of 10 years of experience in climate modeling.Inotherwords,our“lowexperience”groupmostly consists not of laypersons,students or trainees,but of earlyto-mid-career climate scientists with moderate levels of experience in evaluating and tuning climate models.Our“high experience”group consists largely of mid-to-late career scientists:the majority are over the age of 50(53%),with a median of 20.5 years of experience in climate modeling.Researchers on the development of expertise have argued that roughly 10 years of experience are needed for the develop-ment and maturation of expertise(Ericsson,1996);86%of our“high experience”group members have 10 years or more of climate modeling experience.
3.1.1. Science Driver 1:How well does the model reproduce the overall features of the Earth’s climate?
Our fi rst Science Driver asked respondents to assess the importance of di ff erent variables to“the overall features of Earth’s climate”.We believe that this statement summarizes the primary aim of most experts when calibrating a climate model.However,experts’typical practices are likely to be in fl uenced by factors such as the tools and practices used by their mentors and immediate colleagues,their disciplinary background,and their research interests.Such factors could contribute to di ff erences in judgments of what constitutes a“good”modelsimulation.TheaimofthisScienceDriveristo understand what experts prioritize when the goal is relatively imprecisely de fi ned as optimizing the “overall features”of climate;these responses can then be contrasted with the more speci fi c questions in the following fi ve Science Drivers.
Figures 2 and 3 show the distribution of responses for each variable in Science Driver 1 for the high and low experience groups.Figure 4(top)summarizes the mean and standard deviation of importance ratings for all variables in Science Driver 1.Overall,the variables most likely to be identi fi ed as “extremely important”were(in ranked order):rain fl ux(N=31),2-m air temperature(N=28),longwave cloud forcing(N=22),shortwave cloud forcing(N=21),and sea level pressure(N=20).The complete distributions of responses for all science drivers by experience group,together with statistical summary variables and signi fi cance tests,are shown in Tables S1–13.
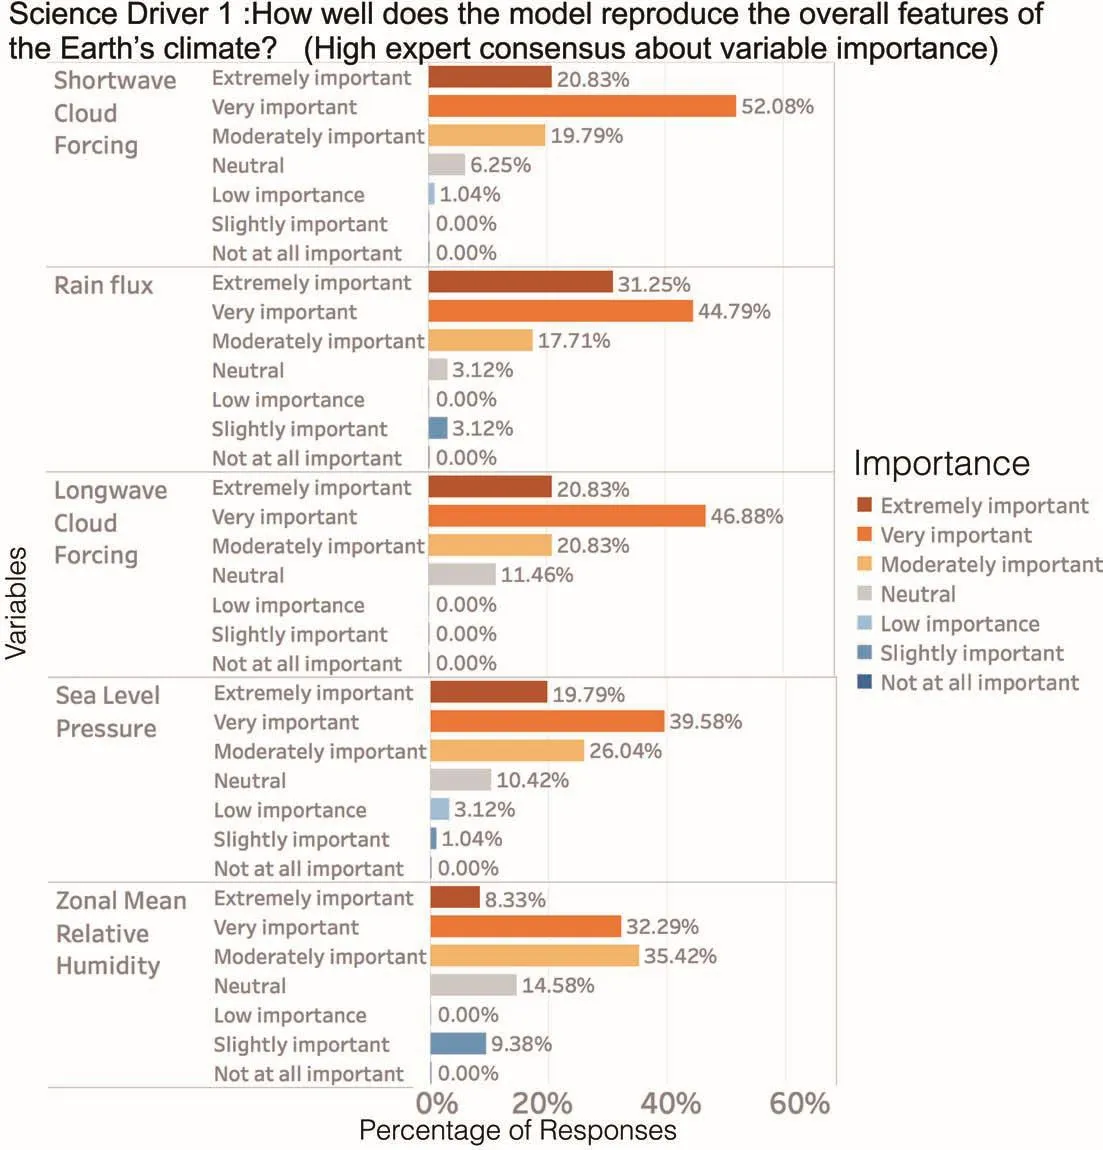
Fig.2.Science Driver 1:distributions of importance ratings,ranked by consensus,as quanti fi ed by the coefficient of agreement A,for variables with high expert consensus about their importance.
The distribution and degree of consensus is similar between the two groups,with no statistically signi fi cant differences for any variable(see Supplementary Tables S4–S6).This suggests that once an initial level of experience is acquired,additional experience may not lead to signi fi cant differences in judgments about model fi delity.

Fig.3.As in Fig.2 but for variables with low expert consensus about their importance.
It is instructive to examine which variables are the exceptions to this general rule;these exceptions hint at insights into where and how greater experience matters most in informing the judgments experts make about model fi delity.The distribution of responses of the high experience and low experience group di ff ered for only one item in Science Driver 1—the oceanic surface wind stress(p<0.01);for this variable,the median response of the high and low experience groups was“very important”and “moderately important,”respectively.We speculate that the high-experience group may be more sensitive to this variable due to(1)its critical importance to ocean–atmosphere coupling,and(2)awareness of the relatively high-quality observational constraints available from wind scatterometer data.
We also investigated the degree of consensus on the importance of di ff erent variables.We observe a clearly higher degree of consensus for some variables,compared to others.Across all participants(high and low experience groups together),there is a comparatively high degree of consensus on the importance of shortwave cloud forcing(A=0.67),longwave cloud forcing(A=0.62),and rain fl ux(A=0.62).In particular,there is comparatively little agreement on the importance of oceanic surface wind stress(A=0.39),due to the discrepancy between experience groups on this item,and on the aerosol optical depth(AOD;A=0.42).The data we collected do not allow us to be certain of the reasoning behind importance ratings,but the lack of consensus on AOD importance is perhaps unsurprising in light of the high uncertainty associated with the magnitude of aerosol impacts on climate(Stocker et al.,2013),and recent controversies among climate modelers on the importance of aerosols to climate,or lack thereof(Booth et al.,2012;Stevens,2013;Seinfeld et al.,2016).
3.1.2.Science Driver 2:How well does the model reproduce features of the global water cycle?
Our second Science Driver included a comparatively limited number of variables related to the global water cycle(Fig.4:middle).These should be considered in combination with Science Driver 6,which addresses the assessment of simulated clouds using a satellite simulator(Fig.5).
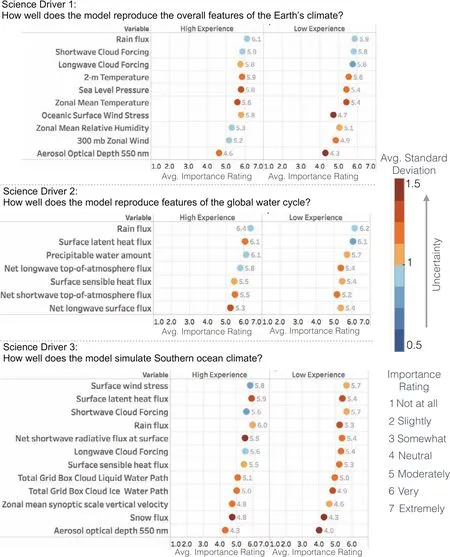
Fig.4.Science Drivers 1–3:mean responses,high and low experience groups,ranked by overall mean response from all participants;color of dots indicates standard deviation of responses.
While the di ff erences did not pass our criteria for statistical signi fi cance,we note a slight tendency for the high experience group to assign higher mean importance ratings to net TOA radiative fl uxes and precipitable water amount.We speculate that this might be due to a slightly greater awareness of,and sensitivity to,observational uncertainties among the high experience group,expressed as a higher importance rating for variables with stronger observational constraints from satellite measurements.This interpretation is supported bythecommentofonestudyparticipant(with20years’experience in climate modeling),who observed that“surface LH[latent heating]and SH[sensible heating]are not well constrained from obs[ervations].While important,that means they aren’t much use for tuning.”
3.1.3. Science Driver 3:How well does the model simulate Southern Ocean climate?
For Southern Ocean climate,surface interactions that affectocean–atmospherecoupling,includingwindstress,latent heat fl ux(evaporation)and rain fl ux,together with shortwave cloud forcing,were identi fi ed as among the most important variables by our participants(Fig.4:bottom).

Fig.5.Science Drivers 4–5:mean responses,high and low experience groups,ranked by overall mean response from all participants;color of dots indicates standard deviation of responses.
The high experience group rated rain fl uxes as more important(median:“very”important)compared to the low experience group(median:“moderately”important;probability of di ff erence:p=0.02).
It is interesting to compare the responses with Science Driver 1,which included many of the same variables.For instance,for AOD,the low experience group assigned a lower mean importance for overall climate(mean:4.32;σ:1.41)than for Southern Ocean climate(mean:4.04;σ:1.49);the high experience group assigned a higher mean importance for overall climate(mean:4.64;σ:1.16)than for Southern Ocean climate(mean:4.34;σ:1.13).
The reasons for this discrepancy are unclear.One possibility is that the high experience group may be more aware that over the Southern Ocean,AOD provides a poor constraint on cloud condensation nuclei(Stier,2016),and is affected by substantial observational uncertainties,with estimates varying widely between di ff erent satellite products.
3.1.4. Science Driver 4:How well does the model simulate important features of the water cycle in the Amazon watershed?
On Science Driver 4,which addresses the water cycle in the Amazon watershed(Fig.5:top),participants identi fi ed surface sensible and latent heat fl ux,speci fi c humidity,and rain fl ux as the most important variables for evaluation.It is possible that the more experienced group is more sensitive to the critical role of land–atmosphere coupling in the Amazonianwatercycle.Thisinterpretationwouldbeconsistentwith the additional variables suggested by our survey participants for this science driver,which also focused on variables critical to land–atmosphere coupling,e.g. “soil moisture”,“water recycling ratio”,and “plant transpiration”(Supplementary TableS2).Whilethevariablesselectedforthesurveyfocused largely on mean thermodynamic variables,commenters also mentioned critical features of local dynamics in the Amazon region,such as surface topography and“wind fl ow over the Andes”,“convection”,and vertical velocity at 850 hPa.
3.1.5.Science Driver 5:How well does the model simulate important features of the water cycle in the Asian watershed?
For Science Driver 5,focused on the Asian watershed,participants rated rain fl ux,surface latent heat fl ux,and net shortwave radiative fl ux at the surface as the most important variables(Fig.5:bottom).For variables included in both Science Drivers,the order of variable importance was the same as in the Amazon watershed,but di ff erent than in the Southern Ocean;some of these di ff erences will be discussed in section 3.3.Written responses again mentioned soil moisture(3×)and moisture advection(2×)as important variables missing from the list.
3.1.6.Science Driver 6:How well does the model simulate the climate impact of clouds globally?
The fi nal Science Driver addressed the evaluation of cloud properties in the model(Fig.6)using a satellite simulator,which produces simulated satellite observations and retrievals based on radiative transfer calculations in the model.“Very important”(6)was the most common response for all variables in Science Driver 6(Supplementary Table S15).
While di ff erences in responses between the two experience groups did not pass our bar for statistical signi ficance,the high experience group selected“extremely important”more frequently than the low experience group for the“high level cloud cover”and “low cloud cover”items,which also had the highest mean importance ratings in this Science Driver.

Fig.6.Science Driver 6:mean responses,high and low experience groups,ranked by overall mean response from all participants;color of dots indicates standard deviation of responses.
Five participants indicated that longwave cloud forcing and shortwave cloud forcing should have been included,and one respondent noted“A complete vertical distribution of cloud properties would be even more interesting than “low”,“medium”and “high”cloud cover.Cloud particle size and number would also be interesting.”Another responded that“cloud fraction is a model convenience but is quite arbitrary.”
3.2.Impactofexperienceonjudgmentsofvariableimportance
We hypothesized that:(H1)respondents with less experience in climate modeling would di ff er from more experienced respondents in their judgments of relative variable importance;and(H2)Respondents with greater experience in climate modeling would exhibit greater consensus in their judgments of the importance of di ff erent variables.
(H1):Using a Chi-squared signi fi cance test(details in the Supplementary Material),we fi nd support for di ff erences in assessment of variable importance by high and low experience groups,but only for certain selected variables.Compared to the low experience group,the high experience group rated ocean surface wind stress as more important to evaluation of global climate(Science Driver1)and rain fl uxas more important to evaluation of Southern Ocean climate(Science Driver 3).
Some other di ff erences are observable between the two groups(see Supplementary Tables S10–S15),but did not meet our criteria for signi fi cance;it is possible that additional di ff erences would emerge if a larger survey population could be attained.
(H2):We fi nd no statistically signi fi cant di ff erences in degree of consensus between the high and low experience groups.
The lack of large di ff erences in responses between the high and low experience groups suggests that variations in importance ratings are mainly driven by factors that are unrelated to the amount of experience the scientists have.Examples could include the speci fi c subdiscipline of the individual expert,or the practices and research foci that are common in their particular research community or geographic area.This result also suggests that expertise in climate model evaluation may reach a plateau after a certain level of pro fi ciency is attained,with additional experience leading to only incremental changes in expert evaluations and judgments.One possible reason for this is that the process of model evaluation is constantly evolving as updated model versions incorporate additional processes and improvements,new observational datasets become available,and new tools are developed to support the evaluation process.As a result,climate scientists continually need to update their understanding about climate models and their evaluation to re fl ect the current state-of-theart.Another possible explanation is that the culture of the climate modeling community may promote an efficient transfer of knowledge,as more experienced scientists o ff er training and advice to less experienced colleagues and to other research groups,shortening the learning curve of new scientists entering the fi eld.
3.3.Impact of Science Drivers on judgments of variable importance
We expected that survey participants would rate the importance of the same model variables di ff erently depending on the science goals,and indeed this is what we found.In this section,we focus on the ratings from the high experience group,but results from the low experience group are similar.
For instance,rain fl ux was rated as less important to evaluation of the Southern Ocean(mean:6.00;σ:1.12)than to global climate(mean:6.14;σ:0.92)or the Asian watershed(mean:6.32;σ:1.00),while shortwave and longwave cloud forcing were rated as less important to the Asian watershed(shortwave:mean:5.48;σ:0.84;longwave:mean:5.23;σ:1.01)than to global climate(shortwave:mean:5.89;σ:1.02;longwave:mean:5.78;σ:1.02)or Southern Ocean climate(shortwave:mean:5.63;σ:0.86;longwave:mean:5.56;σ:0.90).Surface wind stress was rated more important in the Southern Ocean(mean:5.84;σ:1.30),and less important in the Asian watershed(mean:5.10;σ:1.33),compared to its importance to global climate evaluation(mean:5.81;σ:1.02).While total cloud liquid water path was rated as equally important in the Southern Ocean(mean:5.09;σ:1.10),Amazon watershed(mean:5.06;σ:1.29),and Asian watershed(mean:5.13;σ:1.13),total cloud ice water path was rated as less important to the evaluation of the model in the Amazon watershed(mean:4.45;σ:1.52)and Asian watershed(mean:4.74;σ:1.22),compared to the Southern Ocean(mean:5.03;σ:1.13).
These di ff erences indicate that experts adjust the importance assigned to di ff erent metrics depending on the science question or region they are focusing on.As a result,we recommend that future work focused on understanding or quantifying expert judgments of model fi delity should always be explicit about the scienti fi c goals for which the model under assessment will be evaluated.
3.4. Perceived barriers to systematic quanti fi cation of model fi delity
We also explored the community’s perceptions about the current obstacles to systematic quanti fi cation of model fidelity(Fig.7).Survey participants identi fi ed the lack of robust statistical metrics(28%)and lack of analysis tools(10%)as major barriers,with 17%selecting “all of the above”.
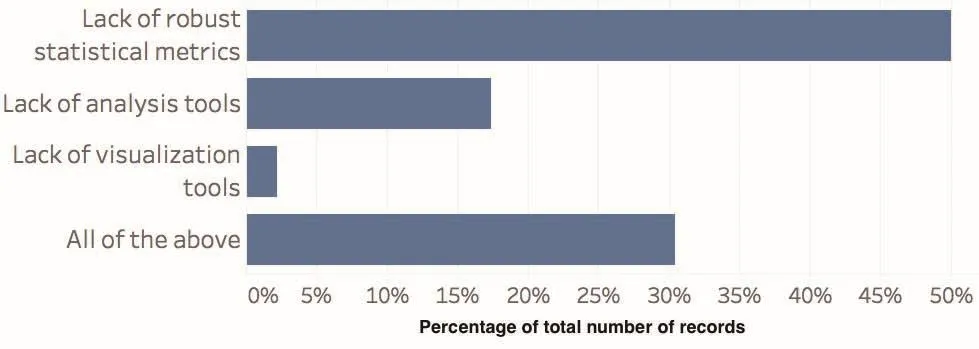
Fig.7.Perceived barriers to systematic quanti fi cation of model fi delity.Answers were selected from a predetermined list in response to the prompt:“Which one among the following,do you feel,is the biggest barrier towards systematic quanti fi cation of model fi delity?”
Many participants selected the option “Other”and contributed written comments.We grouped these into qualitative categories of responses.The most commonly identi fi ed issues related to:
•Lacking or inadequate observational constraints and error estimates for observations(8×);
•Laboriousness of the tuning process(7×);and
•Challenges associated with identifying an appropriate single metric of model fi delity(7×).
On the fi nal point,many of the comments focused on the risk of oversimplifying the analysis and evaluation of models:“Focusing on single metrics over simpli fi es the analysis too much to be useful.It is often hard to identify good vs.bad becauseoneaspectworkswhileothersdon’t,anddi ff erentmodels have di ff erent trade o ff s.”“No one metric tells the whole story;this may lead to false con fi dence in model fi delity.”Another commenter noted that“it’s very hard to create a single metric that accurately encapsulates subjective judgments of many scientists.”Finally,several respondents noted other barriers,including a perceived lack of sufficient expertise in the community,a perception that some widespread practices are inadequate or inappropriate for model evaluation,and a lack of sufficient attention to model sensitivities,as opposed to calibration with respect to present-day mean climate.
4.Prospects for synthesizing expert assessments and objective model fi delity metrics
As discussed in section 1,there are many potential applications for a climate model index that summarizes the model’s fi delity with respect to a particular science goal.However,one challenge is that an assessment of which models most resemble the observations depends in part on which observed variables are evaluated,and how much relative importance is assigned to each of them.A model fi delity index can be conceptualized as a weighted average of di ff erent objective metrics(Eq.1),but di ff erent experts might reasonably make di ff erent choices in assigning values to the weights,resulting in models potentially being ranked di ff erently by different experts,as illustrated in Fig.8.Furthermore,the information that experts implicitly use and the relative importance they assign to di ff erent aspects of the model’s fi delity when evaluating actual model output,likely di ff ers from their explicit statements about evaluation criteria.A systematic approach is needed to understand which information experts actually use in evaluating models,how much consensus exists among experts about variable importance when evaluating real model output,and how sensitive a proposed model fi delity index would be to di ff erences in these judgments between experts.
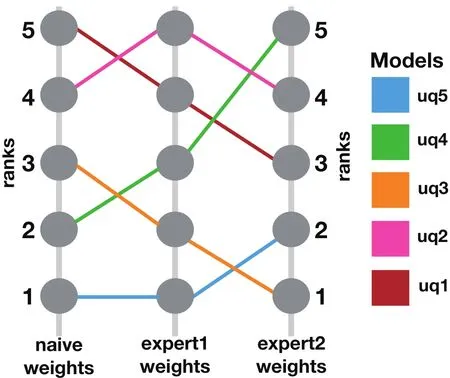
Fig.8.Illustration of the concept of overall model fi delity rankings and their sensitivity to expert weights.Consider the pair of models uq1 and uq2,where the overall fi delity of the model is evaluated as a weighted mean of several component scores.If uq1 performs better than uq2 on some component scores,but worse on others,the ranking of these models according to their overall mean fi delity metric will be sensitive to how strongly each component metric is weighted.In this example,the rankings of several models using “naive weights”(unweighted average)are compared to rankings that use importance weights derived from the responses of two di ff erent experts in our survey.
The survey described in this paper represents a fi rst step towards building that understanding.It also provides baseline information that will inform and be used in analysis of a second planned study,in which experts will be invited to evaluate the output from real model simulations.This mock model assessment exercise will enable us to address additional questions,such as:(1)How much consensus exists among experts when evaluating the fi delity of actual model simulations(as opposed to assessing variable importance in the abstract)?(2)can an index Iinferredbe constructed by using experts’assessments of real model output to infer the weights wi,inferredthat they implicitly assign to fi delity of different model variables?(3)Do the weights wi,inferredthat are inferred from experts’assessments of real model output agree or disagree with the relative importance that experts assigned to di ff erent variables a priori,as reported in this study?
5.Summary and conclusions
In this article we report results from a large community survey on the relative importance of di ff erent variables in evaluating a climate model’s fi delity with respect to a particular science goal.We plan to use the results of this study to inform the development of a follow-up study in which experts are invited to evaluate actual model outputs.
We show that experts’rankings are sensitive to the scienti fi c objectives.For instance,surface wind stress was rated as among the most important variables in evaluation of Southern Oceanclimate,andamongtheleastimportantinevaluationof the Asian watershed.This suggests the possibility and utility of designing di ff erent and unique collections of metrics,tailored to speci fi c science questions and objectives,while accounting explicitly for uncertainty in variable importance.
We fi nd no statistically signi fi cant di ff erences between rankingsprovidedbymodeldevelopersandmodelusers,suggesting some consistency between the developer and user communities’understanding of appropriate evaluation criteria.We also fi nd that our“high experience”group,consisting mostly of senior scientists with many years of climate modeling experience,and our “low experience”group,consisting mostly of early and mid-career scientists,were in agreement about the importance of most variables for model evaluation.However,within each group,there are also substantial disagreements and diversity in responses.The level of consensus is particularly low for AOD,which some participants rated as“extremely important”and others rated as“not at all important.”Additionally,in our survey sample,greater experience with evaluating model fi delity was not associated with greater consensus about the importance of di ff erent variables in model evaluation,and led to only minor changes in estimates of variable importance,i.e.,to small changes in the frequency distribution of importance ratings,which are only statistically signi fi cant for a small number of variables.
Itisimportanttonotethatwhenexperts’responsesonthis survey di ff er,it does not necessarily imply that their evaluations of actual climate models would also di ff er.We anticipate that experts perform actual model evaluations in a more holistic manner and draw on much broader information than was included in this survey.In order to make initial progress on this extremely complex topic,we limited the scope of the study to evaluation of global mean climate,but the timedependent behavior of the system is also critical to assess,as well as features of the coupled climate system.Future research should extend this approach to include evaluation of diurnal and seasonal cycles;multi-year modes of climate variability such as ENSO,QBO,and PDO;extreme weather events;frequency of extreme precipitation;and other timedependent features of the climate system.Other,more complex metrics of model fi delity could also be considered,e.g.,object-based veri fi cation approaches,and scale-aware metrics that would be robust to changes in model resolution.
Several study participants noted that issues related to observational datasets continue to be a major challenge for model evaluation.This includes logistical issues,such as theiravailabilitythroughacentralizedrepository,instandardized formats,and in updated versions as new data become available.However,more fundamentally,the limitations of observational constraints continue to be a major obstacle,including the lack of observations of certain key model variables,and the lack of estimates of the observational uncertainty for many datasets.Climate model evaluation e ff orts could also bene fi t from the increased adoption of metrics and diagnostic visualizations that directly incorporate information on observational uncertainty and natural variability,providing greater transparency and richer contextual information to users of these tools.
The labor-intensiveness of model evaluation e ff orts was noted by several survey participants,and is well-known to most scientists familiar with climate model development.Climate modeling centers invest an enormous amount of computational and human resources into model tuning.At a rough estimate,tuning a coupled climate model requires the e ff orts of about fi ve full-time equivalent(FTE)scientists and engineers for each major model component(atmosphere,ocean and sea-ice,and land)as well as fi ve FTEs for the overall software engineering and tuning of the coupled system.An intense tuning e ff ort for a new major version of a coupled climate model may last for about one year and be repeated every fi ve years,for an average investment of four FTEs per year.Globally,there are at least 26 major climate modeling centers(the number that participated in CMIP5 project:http://cmip-pcmdi.llnl.gov/cmip5/availability.html),of which fi ve are located in the United States(DOE–ACME,NASA–GISS,NASA–GMAO,NCAR,NOAA–GFDL).Assuming that the typical cost to support a sta ffscientist at a climate modeling center is about$300 thousand per year(including salary,fringe,and overhead expenses),we estimate that the amount of money spent annually on the human e ff ort involved in climate model tuning is roughly$6 million in the United States and$31.2 million globally.
If appropriate quantitative metrics can be developed that meaningfully capture the criteria important in a comprehensive model assessment,then algorithms could be applied to partially automate the calibration process,for instance by identifying an initial subset of model con fi gurations that produce plausible climates,subject to further manual inspection by teams of experts.Further work is needed to assess the feasibility of such an approach;but if successful,similar approaches could be valuable in the development not only of global climate models,but also of regional weather models,large eddy simulations,and other geophysical and complex computational models in which multiple aspects of fi delity must be assessed and weighed against each other.
We suggest that a closer integration of objectively computed metrics with expert understanding of their relative importance has the potential to dramatically improve the efficiency of the model calibration process.The concise variable lists and community ratings reported in this study provide a snapshot of current expert understanding of the relative importance of certain aspects of climate model behavior to their evaluation.This information will be informative to the broader climate research community,and can serve as a starting point for the development of more sophisticated evaluation and scoring criteria for global climate models,with respect to speci fi c scienti fi c objectives.
Acknowledgements. The authors would like to express their sincere gratitude to everyone who participated in the survey described in this paper.While privacy restrictions prevent us from publishing their identities,we greatly appreciate the time that many busy individuals have taken,voluntarily,to contribute to this research.We would like to thank Hui WAN,Ben KRAVITZ,Hansi SINGH,and Benjamin WAGMAN for helpful comments and discussions that helped to inform this work.This research was conducted under the Laboratory Directed Research and Development Program at PNNL,a multi-program national laboratory operated by Battelle for the U.S.Department of Energy under Contract DEAC05-76RL01830.
Open Access This article is distributed under the terms of the Creative Commons Attribution License which permits any use,distribution,and reproduction in any medium,provided the original author(s)and the source are credited.
Electronic supplementary material Supplementary material is available in the online version of this article at https://doi.org/10.1007/s00376-018-7300-x.
REFERENCES
Booth,B.B.B.,N.J.Dunstone,P.R.Halloran,T.Andrews,and N.Bellouin,2012:Aerosols implicated as a prime driver of twentieth-century North Atlantic climate variability.Nature,484,228–232,https://doi.org/10.1038/nature10946.
Braverman,A.,N.Cressie,and J.Teixeira,2011:A likelihoodbased comparison of temporal models for physical processes.Statistical Analysis and Data Mining:The ASA Data Science Journal,4,247–258,https://doi.org/10.1002/sam.10113.
Ericsson,K.,1996:The Road to Expert Performance:Empirical Evidence from the Arts and Sciences,Sports,and Games.Lawrence Erlbaum Associates,369 pp.
Gleckler,P.J.,K.E.Taylor,and C.Doutriaux,2008:Performance metrics for climate models.J.Geophys.Res.,113,D06104,https://doi.org/10.1029/2007JD008972.
Herger,N.,G.Abramowitz,R.Knutti,O.Ang´elil,K.Lehmann,and B.M.Sanderson,2017:Selecting a climate model subset to optimise key ensemble properties.Earth System Dynamics,9,135–151,https://doi.org/10.5194/esd-9-135-2018.
Hourdin,F.,and Coauthors,2017:The art and science of climate model tuning.Bull.Amer.Meteor.Soc.,98,589–602,https://doi.org/10.1175/BAMS-D-15-00135.1.
Knutti,R.,J.Sedl´aˇcek,B.M.Sanderson,R.Lorenz,E.M.Fischer,and V.Eyring,2017:A climate model projection weighting scheme accounting for performance and interdependence.Geophys.Res.Lett.,44,1909–1918,https://doi.org/10.1002/2016GL072012.
Min,S.K.,and A.Hense,2006:A Bayesian approach to climate model evaluation and multi-model averaging with an application to global mean surface temperatures from IPCC AR4 coupled climate models.Geophys.Res.Lett.,33,L08708,https://doi.org/10.1029/2006GL025779.
Nosedal-Sanchez,A.,C.S.Jackson,and G.Huerta,2016:A new test statistic for climate models that includes fi eld and spatialdependenciesusingGaussianMarkovrandom fi elds.Geoscienti fi c Model Development,9,2407–2414,https://doi.org/10.5194/gmd-9-2407-2016.
Qian,Y.,and Coauthors,2015:Parametric sensitivity analysis of precipitation at global and local scales in the Community Atmosphere Model CAM5.Journal of Advances in Modeling Earth Systems,7,382–411,https://doi.org/10.1002/2014 MS000354.
Qian,Y.,and Coauthors,2016:Uncertainty quanti fi cation in climate modeling and projection.Bull.Amer.Meteor.Soc.,97,821–824,http://dx.doi.org/10.1175/BAMS-D-15-00297.1.
Reichler,T.,and J.Kim,2008:How well do coupled models simulate today’s climate?Bull.Amer.Meteor.Soc.,89,303–311,https://doi.org/10.1175/BAMS-89-3-303.
Ri ff enburgh,R.H.,and P.A.Johnstone,2009:Measuring agreement about ranked decision choices for a single subject.The International Journal of Biostatistics,5,https://doi.org/10.2202/1557-4679.1113.
Seinfeld,J.H.,and Coauthors,2016:Improving our fundamental understanding of the role of aerosol-cloud interactions in the climate system.Proceedings of the National Academy of Sciences of the United States of America,113,5781–5790,https://doi.org/10.1073/pnas.151404311.
Stevens,B.,2013:Aerosols:Uncertain then,irrelevant now.Nature,503,47–48,https://doi.org/10.1038/503047a.
Stier,P.,2016:Limitations of passive remote sensing to constrain global cloud condensation nuclei.Atmospheric Chemistry and Physics,16,6595–6607,https://doi.org/10.5194/acp-16-6595-2016.
Stocker,T.F.,and Coauthors,2013:Climate Change 2013:The Physical Science Basis.Contribution of Working group I to the Fifth Assessment Report of the Intergovernmental Panel on Climate Change.Cambridge University Press,1535 pp,https://doi.org/10.1017/CBO9781107415324.
Suckling,E.B.,and L.A.Smith,2013:An evaluation of decadal probability forecasts from state-of-the-art climate models.J.Climate,26,9334–9347,https://doi.org/10.1175/JCLI-D-12-00485.1.
Yang,B.,and Coauthors,2013:Uncertainty quanti fi cation and parameter tuning in the CAM5 Zhang-McFarlane convection scheme and impact of improved convection on the global circulation and climate.J.Geophys.Res.,118,395–415,https://doi.org/10.1029/2012JD018213.
Zhang,T.,L.Li,Y.Lin,W.Xue,F.Xie,H.Xu,and X.Huang,2015:An automatic and e ff ective parameter optimization method for model tuning.Geoscienti fi c Model Development,8,3579–3591,https://doi.org/10.5194/gmd-8-3579-2015.
杂志排行
Advances in Atmospheric Sciences的其它文章
- Varying RossbyWave TrainsfromtheDevelopingtoDecayingPeriodof theUpper Atmospheric Heat Source over the Tibetan Plateau in Boreal Summer
- Changes in the Proportion of Precipitation Occurring as Rain in Northern Canada during Spring–Summer from 1979–2015
- Comparison of Di ff erent Generation Mechanisms of Free Convection between Two Stations on the Tibetan Plateau
- Source Contributions to PM2.5under Unfavorable Weather Conditions in Guangzhou City,China
- Atmospheric Response to Mesoscale Ocean Eddies over the South China Sea
- In fl uence of Low-frequency Solar Forcing on the East Asian Winter Monsoon Based on HadCM3 and Observations
