Order-Disorder Transition of Carboxyl Terminated Chains in Polydiacetylenes Vesicles Probed by Second Harmonic Generation and Two-Photon Fluorescence
2018-06-27ShunliChenXuefengZhuFngyunYngXuecongPnWeiGnbQunhuiYun
Shun-li Chen,Xue-feng Zhu,Fng-yun Yng,Xue-cong Pn,Wei Gnb,∗,Qun-hui Yun
a.Laboratory of Environmental Science and Technology,Xinjiang Technical Institute of Physics and Chemistry,Key Laboratory of Functional Materials and Devices for Special Environments,Chinese Academy of Sciences,Urumqi 830011,China
b.School of Sciences,Harbin Institute of Technology(Shenzhen),Shenzhen 518055,China
c.School of Materials Science and Engineering,Harbin Institute of Technology(Shenzhen),Shenzhen 518055,China
I.INTRODUCTION
Polydiacetylenes(PDAs)with π-conjugated backbone consisting of alternating ene-yne structures undergo colorimetric transitions with external stimuli.This effect has attracted much attention due to its potential applications in colorimetric sensing of chemical and biological targets[1−6].Understanding the physical mechanism of chromatic transitions is vital in the designing and controlling of the colorimetric properties of PDAs-based sensors.Researchers have probed the colorimetric properties of PDAs by UV-Vis absorption[1,2,7],FTIR[6,8],Raman[9,10],transient absorption spectroscopy[5,6],and so on.A number of studies revealed that the structural distortion in the alternating ene-yne backbone is responsible for the color change of PDAs[1,7,11−16].It was revealed that external stimuli induced changes in the conformation of the side chains attached to the polymer backbone and excited strain on the planar conjugated ene-yne backbone.This strain was then relieved by the breaking of the planarity of the polymer,which decreased its effective conjugation length and led to a blue shift in the electronic absorption maximum[10−12].It was also manifested that the blue and red phases differed in their short-and longrange structural order[17],and the phase transition was accompanied by the reorganization of the tilted side chains[18−22].
Most studies on the change of PDAs structure in chromatic transitions were based on Langmuir or Langmuir-Blodgett(LB) films,or the bulk characteristics of vesicles in solution,while direct detection of the interfacial properties of PDAs vesicles was seldom reported.In this work,we intend to explore the interfacial structures of PDAs vesicles in aqueous solution using second-order nonlinear optical method bearing exquisite surface sen-sitivity.As a specific spectroscopic tool in surface/interface studies,second-order nonlinear optical methods,including second harmonic generation(SHG)and sum frequency generation(SFG),have been widely used to retrieve rich interfacial information including molecular orientation and conformation,moleculeinterface interaction,and reaction kinetics[23−33].Second harmonic scattering(SHS)[34−44]has been proven effective for detecting interfacial molecular adsorption or transport processes at the curved surfaces of centrosymmetric particles,droplets or vesicles of nanoto micro-meter size suspended in liquids.
SHG measurements were also used to study the electronic structures[45−47]and chirality features[48]of PDA Langmuir or LB films in previous reports.It was verified that the dipole-forbidden state(Ag excitation state)of π-conjugated PDAs polymer could be observed by SHG spectra and the chirality of PDAs films was affected by the conformational change of PDAs chains due to metal ions.In this work,the variations of interfacial structures of PDAs vesicles during chromatic transitions were studied using SHS method.10,12-Pentacosadiynoic acid(PCDA)was used to prepare PDAs vesicles in aqueous solution with different forms(monomer,blue,purple and red phases)by controlling the irradiation time of UV-light.Then we measured the intrinsic second harmonic response from PDAs vesicle backbone,and detected the adsorption behaviors of charged molecules(4-(4-diethylaminostyry)-1-methylpyridinium iodide,D289)onto the surfaces of PDAs vesicles with SHS and zeta potential measurements.
II.EXPERIMENTS
A.Materials
10,12-Pentacosadiynoic acid(PCDA,97%)and 4-(4-diethylaminostyry)-1-methyl-pyridinium iodide(D289,98%)were purchased from Sigma-Aldrich.Chloroform(AR grade)was purchased from Tianjin Damao Chemical Reagent Factory,China.Deionized water(18.2 MΩ·cm)was purified with water purification system(WP-UP-UV-20)from Sichuan Water Technology Development Co.Ltd,China.The structures of PCDA and D289 molecules are given in FIG.1.
B.Vesicle preparation
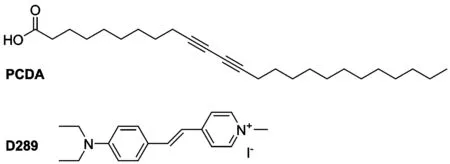
FIG.1 Structures of PCDA and D289 molecules.
PCDA monomer was dissolved in chloroform(∼400µL)and dried under vacuum for 30 min,followed by the addition of water to 0.5 mmol/L concentration.The solution was sonicated for 20 min(KQ-300DE,300 W,40 kHz,Kunshan ultrasonic instrument Co.Ltd.China)at the temperature of(80±5)◦C.The vesicle solution was cooled down to room temperature and stored in the fridge at 4◦C.The solution was filtrated three times by cellulose acetate membrane with pore size of 0.8µm to remove large aggregates before further treatment.The polymerization of vesicles was initiated using a low pressure mercury lamp(253.7 nm,Cnlight Co.Ltd,China)with power of 15 W at the distance of∼12 cm.The photo-polymerization degree of vesicles was confirmed through the absorption spectra measured with a spectrophotometer(UV-1800,Shimadzu).The pH of the solution was measured to be 5.5±0.3.
C.Electrophoretic mobility measurement and zeta potential calculation
The electrophoretic mobility and the number mean diameter of vesicles were characterized by dynamic light scattering method(Nano-ZS90,Malvern)with the temperature set as(25±1)◦C and the measuring direction as 90◦C.All presented results were averaged data from three measurements.During the experiments the size of the vesicle kept relatively stable with standard deviation of the average diameter less than 10%,and the polydispersity index(PDI)less than 0.2.Zeta potential of vesicles was determined by the mobility values according to the Smoluchowski equation,which is normally applied at cases other than very low ionic strength[40,49].
D.SHS measurement
The setup for SHS measurement has been described in our previous work[39].In brief,a commercial Ti:sapphire oscillator laser(Mira-900F,Coherent)with pulse width of∼130 fs and repetition rate of 76 MHz was used as the fundamental laser source with the central wavelength set at 810 nm.A cylindrical quartz cell with inner diameter of 13 mm was employed to hold vesicle solution with stirring at a constant speed to avoid the laser-induced heating effect.The horizontally propagating 810 nm laser through a high pass filter(>750 nm)was focused at the cell center.SHS signal centered at 405 nm from the vesicles collected at a relatively large spatial angle(∼40◦)range in the forward direction passed through a bandpass filter(BG39,300−600 nm)and focused into the slit with the width of 2 mm of a monochromator(SR-500I,Andor),and then detected with a photomultiplier tube(PMT,Hamamatsu R-1527p).The PMT output was connected to a preamplifier(SR445A,Stanford Research)with an amplification factor of 5 and analyzed by a photon counter(SR400,Stanford Research).The obtained photon counts were then recorded by a computer.The experiments were performed with the laser power at 300 mW and the PMT voltage of−900 V.The polarization of the fundamental laser was set with the direction of the electric field parallel to the horizontal plane.During the measurements,the ambient temperature was kept at(22±1)◦C.
Because part of the emitted SHG signal was absorbed by the vesicle solution,all the SHS intensity data shown in the next section were corrected based on the absorbance at the corresponding wavelength.In the experiments,the SHG signal passed through the bulk solution with a distance of 6.5 mm(d1);the cell thickness for the measurement of UV absorption(A)was 10 mm(d2),so the corrected SHG signal was calculated from the originally measured signal(I0)as:For the SHG measurement,the aqueous solution of PCDA vesicles was divided into 6-equal portions.Then,UV-irradiation with different time(0 s,20 s,1 min,5 min,15 min,30 min)was applied for each portion.The corresponding samples were named as PCDA,UV20s,UV1min,UV5min,UV15min,and UV30min,respectively.Then,these samples were used to collect the second-order scattering signal from the pure vesicles.Subsequently,D289 dye(2 mmol/L)was quickly added into these samples(3 mL)to achieve the desired concentration to probe the signal from D289.In the experiments D289 didn’t undergo UV-irradiation.The aqueous solution of D289 dye at concentrations≤100µmol/L was used.From the absorption spectra of the aqueous solution of PDAs vesicles in the presence of D289 at various concentrations,the aggregate effect of D289 dye could be ruled out in this work.
III.RESULTS AND DISCUSSION
A.UV-Vis absorption spectra,size and electrophoretic mobility analysis
With the increase of the irradiation time with UV(253.7 nm)-light,the absorbance peak of PDAs vesicle solution appeared a gradual blue shifted trend with varied distribution of intensity between the multiple peaks.The spectra change was accompanied by the color conversion from colorless to blue-to-purple-to-red(FIG.2(a)).The subtle change in scattering may have some contributions to the decrease of the absorbance at short wavelength side with the increased UV irradiation.
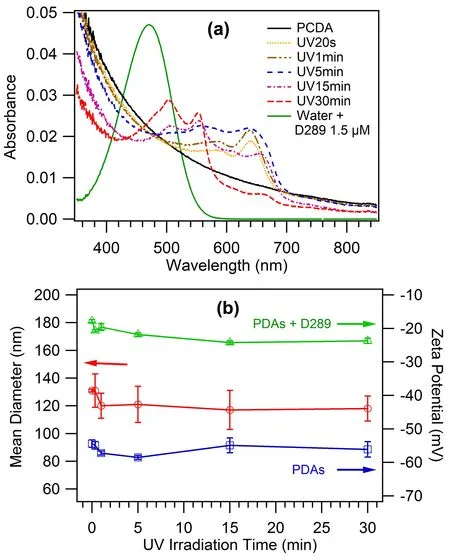
FIG.2 (a)Absorption spectra at the range of 350−850 nm of the aqueous solution of PDAs vesicles.The green line indicates the absorption spectrum of D289 aqueous solution at the concentration of 1.5µmol/L.(b)Number mean diameter of PDAs vesicles and zeta potential results for PDAs vesicles without and with saturated D289 adsorption(100µmol/L).
For the PDAs vesicles before and after UV irradiation,the number mean diameter was relatively stable(120±13)nm,red curve in FIG.2(b)).This made the SHS intensity analysis relatively easy because the angular distribution of SHS intensity from particles showed strong size dependence[35,50].After saturated adsorption of D289 molecules,the vesicle size kept unchanged within the error range.Zeta potential values obtained from electrophoretic measurements for PDAs vesicles after UV-irradiation with different time were plotted in FIG.2(b)(blue curve).It was observed that the zeta potential values kept almost unchanged with an average value of(−56.0±1.6)mV for PDAs vesicles with different forms.Zeta potential values of PDAs vesicles with saturated D289 adsorption were(−17.8±0.4),(−20.7±0.3),(−19.6±1.0),(−21.8±0.5),(−24.2±0.5),and(−23.7±0.8)mV for PCDA,UV20s,UV1min,UV5min,UV15min and UV30min,respectively(green curve in FIG.2(b)).Based on the known Gouy-Chapman theory and the Graham equation[40,51,52],the interfacial charge density(Γ or σ)is the function of the zeta potential(ς)and the total electrolyte concentration(I)as expressed by:Here e represents the elementary charge,εris the relative dielectric permittivity of the solvent,ε0is the dielectric permittivity in vacuum,kT is the thermal energy and z is the ion valence.Based on this equation,for PDAs vesicles with different forms,the estimated interfacial charge density was(0.006±0.0003)(−e/nm2)(Table I).For PDAs vesicles with saturated D289 adsorption,the corresponding interfacial charge density was listed in Table I.In this calculation the ionic strength of the vesicle solutions was estimated by comparing their conductivity with emulsions with NaCl at varied concentrations.

TABLE I Estimated interfacial charge density(−e/nm2)of PDAs vesicles with different forms.
B.Scattering spectra from vesicle backbone upon laser excitation
Upon irradiation of 810 nm fundamental laser,the πconjugated backbone of PDAs vesicles produced weak second-order optical scattering signal at 405 nm as well as relatively strong two-photon excitation induced fluorescence(TPF)signal around 561 nm(FIG.3(a)).
The intensity of the second-order scattering signal from aqueous solution of PDAs vesicles was only slightly higher than the hyper-Rayleigh scattering signal from water(inset of FIG.3(a)).This indicates that the intrinsic signal from vesicle backbone was relatively weak.So,it was directly subtracted to retrieve the much stronger resonant SHS signal(typically 1−2 orders of magnitude higher)from D289 adsorption to the vesicle surfaces as shown below.
Besides,the blue,purple and red phases of PDAs vesicles displayed significant features of TPF emission.The intensity of TPF signal at 561 nm from PDAs vesicles was linearly proportional to the UV-light irradiation time(FIG.3(b)).
C.Scattering spectra from D289 adsorbed to vesicle surface
The fluorescence emissions of D289 molecules in pure water and the aqueous solution of PDAs vesicles are displayed in FIG.4.The fluorescence emission of D289 molecules around 581 nm is enhanced by 3000−6000 counts/s after D289 molecules were mixed with the aqueous solution of PDAs vesicles.That is,D289 dye presents enhanced fluorescence when binding to the vesicle membranes.The fluorescence intensity shows a basically decreasing trend with the increased UV irradiation(FIG.4(b)).
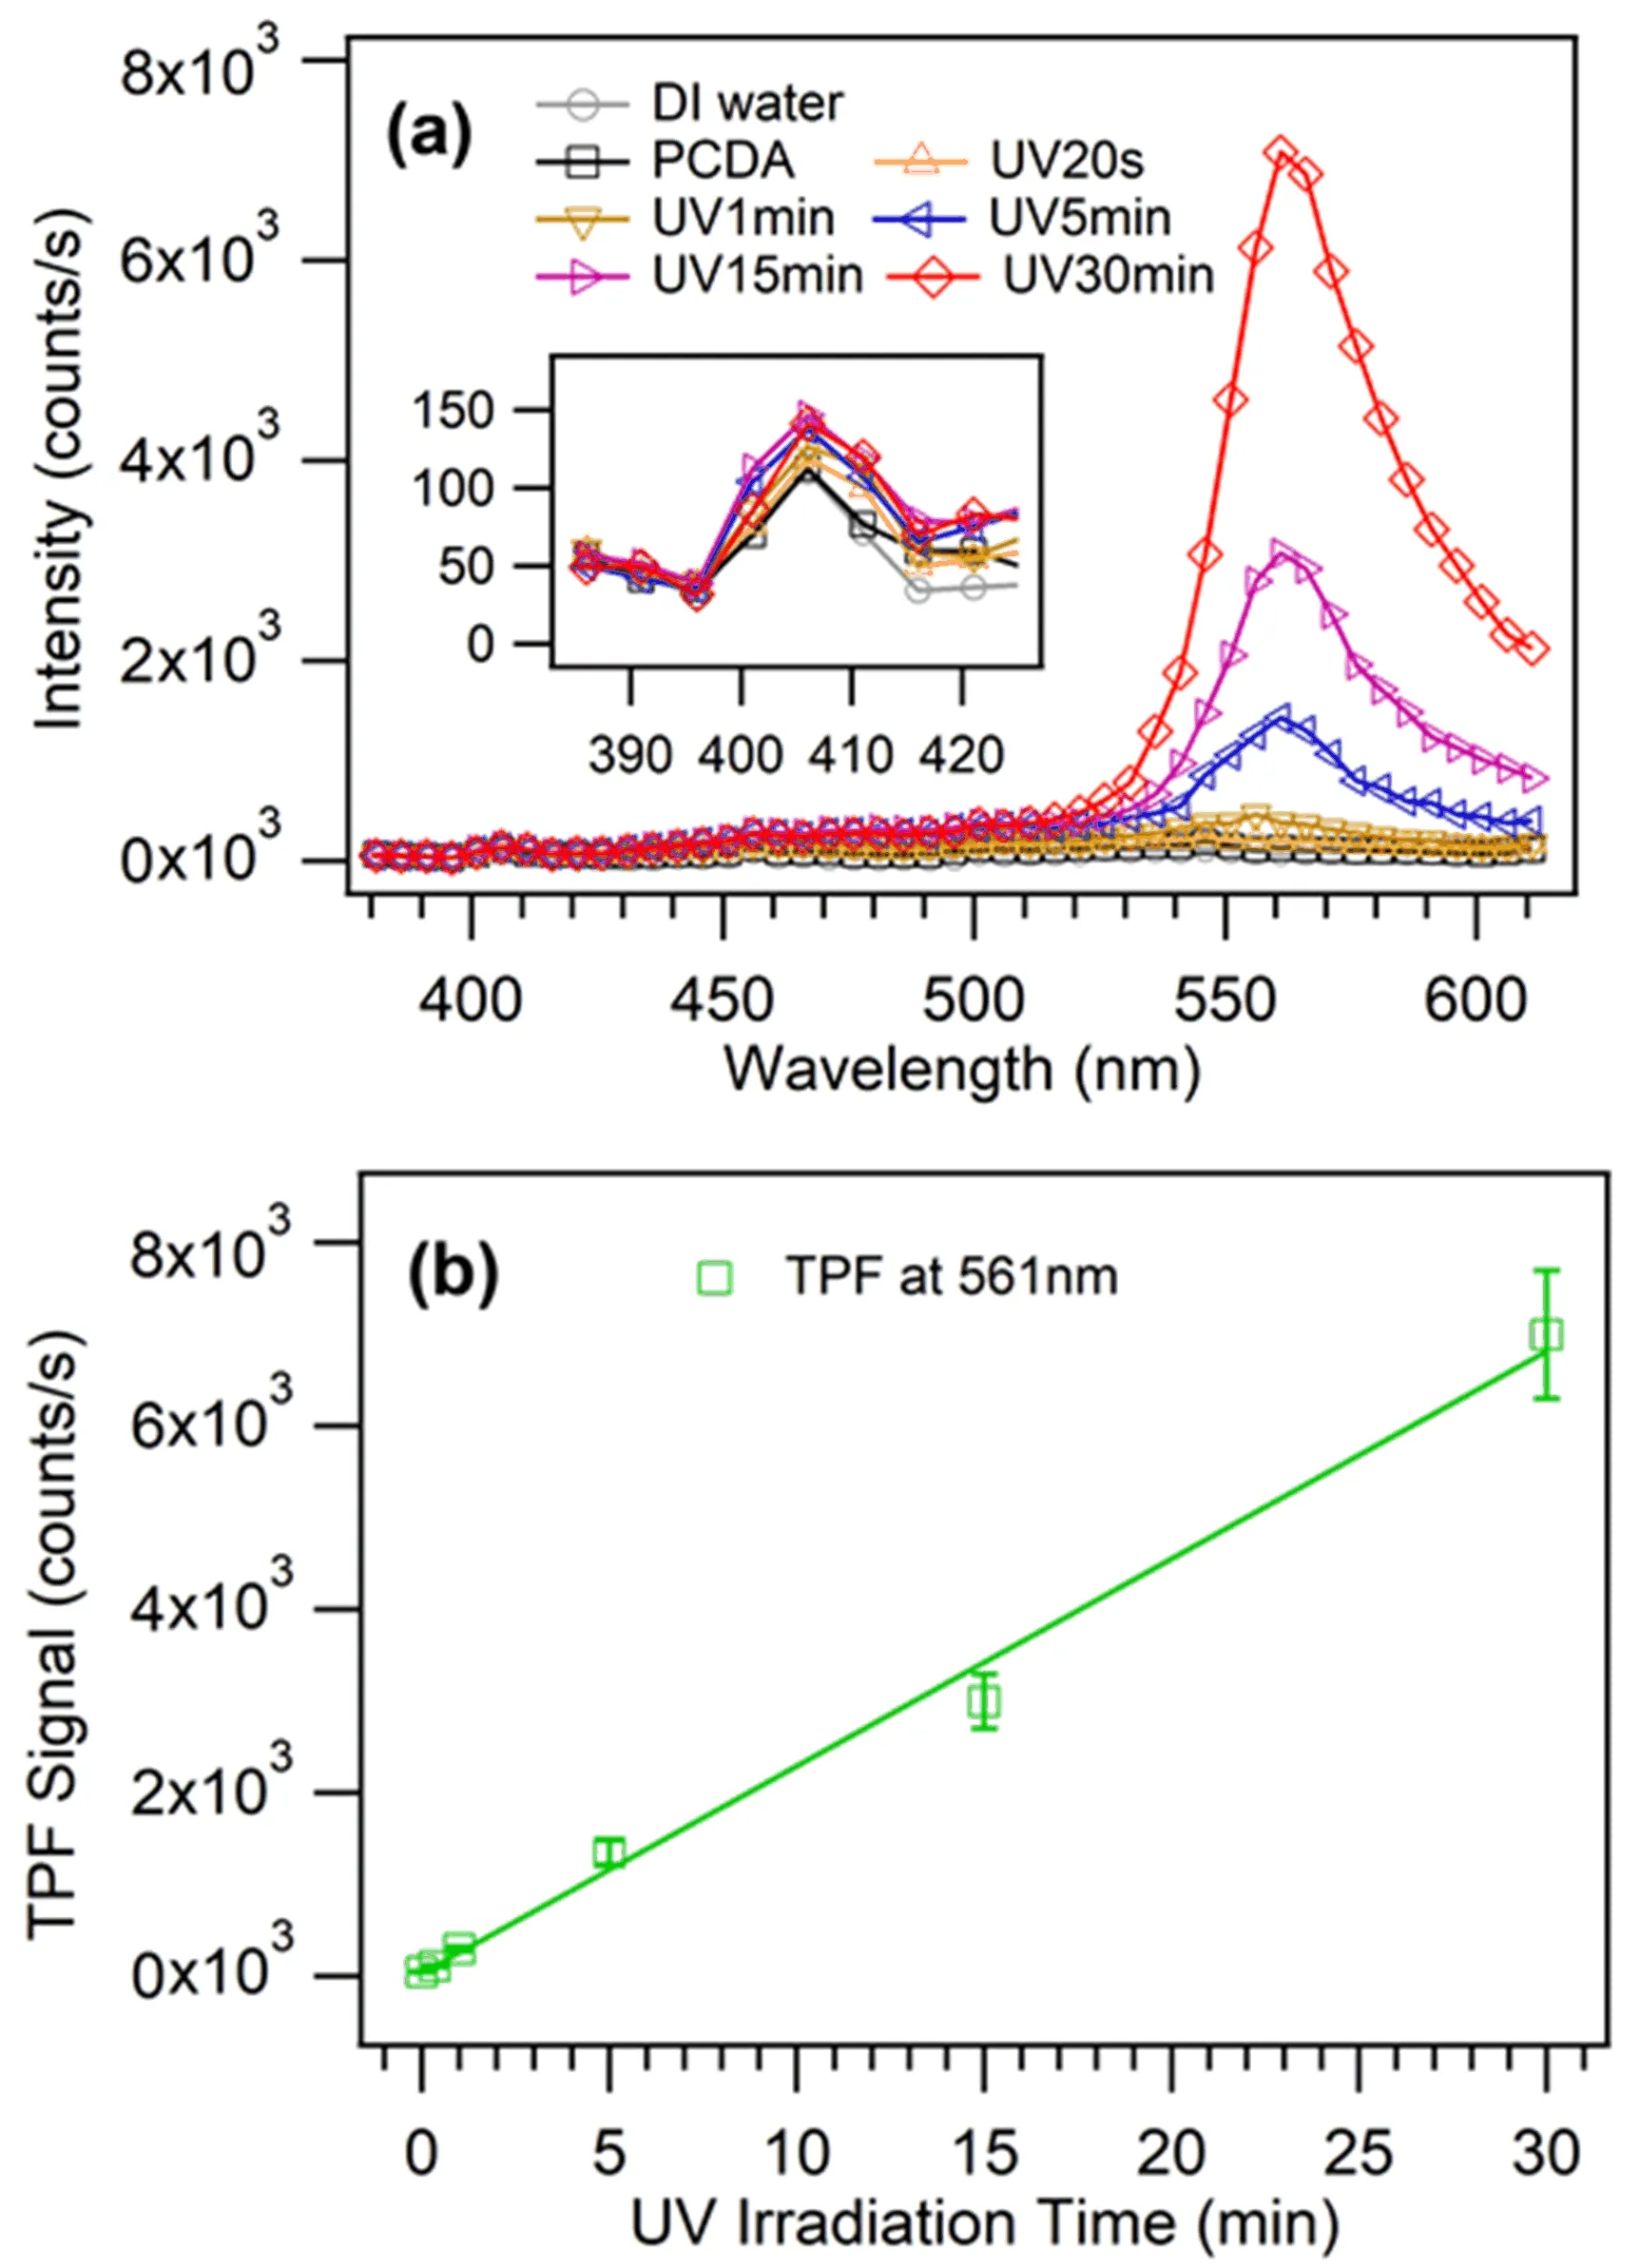
FIG.3 (a)Spectra from 386 nm to 611 nm of optical scattering signal from PDAs vesicle aqueous solution with the wavelength step of 5 nm.(b)TPF signal at 561 nm from PDAs vesicle aqueous solution.
It was observed that the SHS signal from D289 adsorbed to the surface of PDAs vesicles was much stronger than the signal from the solution of vesicles(FIG.4(a)).According to the adsorption isotherm curves as a function of D289 molecular concentration(FIG.5(a)),the adsorption free energy of D289 molecules to the vesicle interfaces can be resolved based on the Langmuir model[34,53].Although it has been demonstrated that a modified Langmuir model can be used to achieve both the adsorption free energy and the saturated adsorption density of molecules at relatively large interfaces in the colloids or emulsions[34,39,50],we failed to obtain both the two parameters in our fitting.Most possibly because of the relatively low number density of PDAs vesicles and/or low molecular density of D289 at the surface of PDAs vesicles,our fitting with the modified Langmuir model can only lead to a saturated D289 surface density close to zero.No reliable number can be deducted in the fitting.For this reason,we used the general Langmuir model in this work to retrieve the adsorption free energy of D289 molecules at the surface of PDAs vesicles.The achieved adsorption free energy firstly decreased monotonously as a function of UV irradiation time,then slowed down and leveled off after purple phase(FIG.5(b)).That is to say,the driving force to the vesicle surface for charged D289 molecules became weaker with the increase of UV irradiation dose.
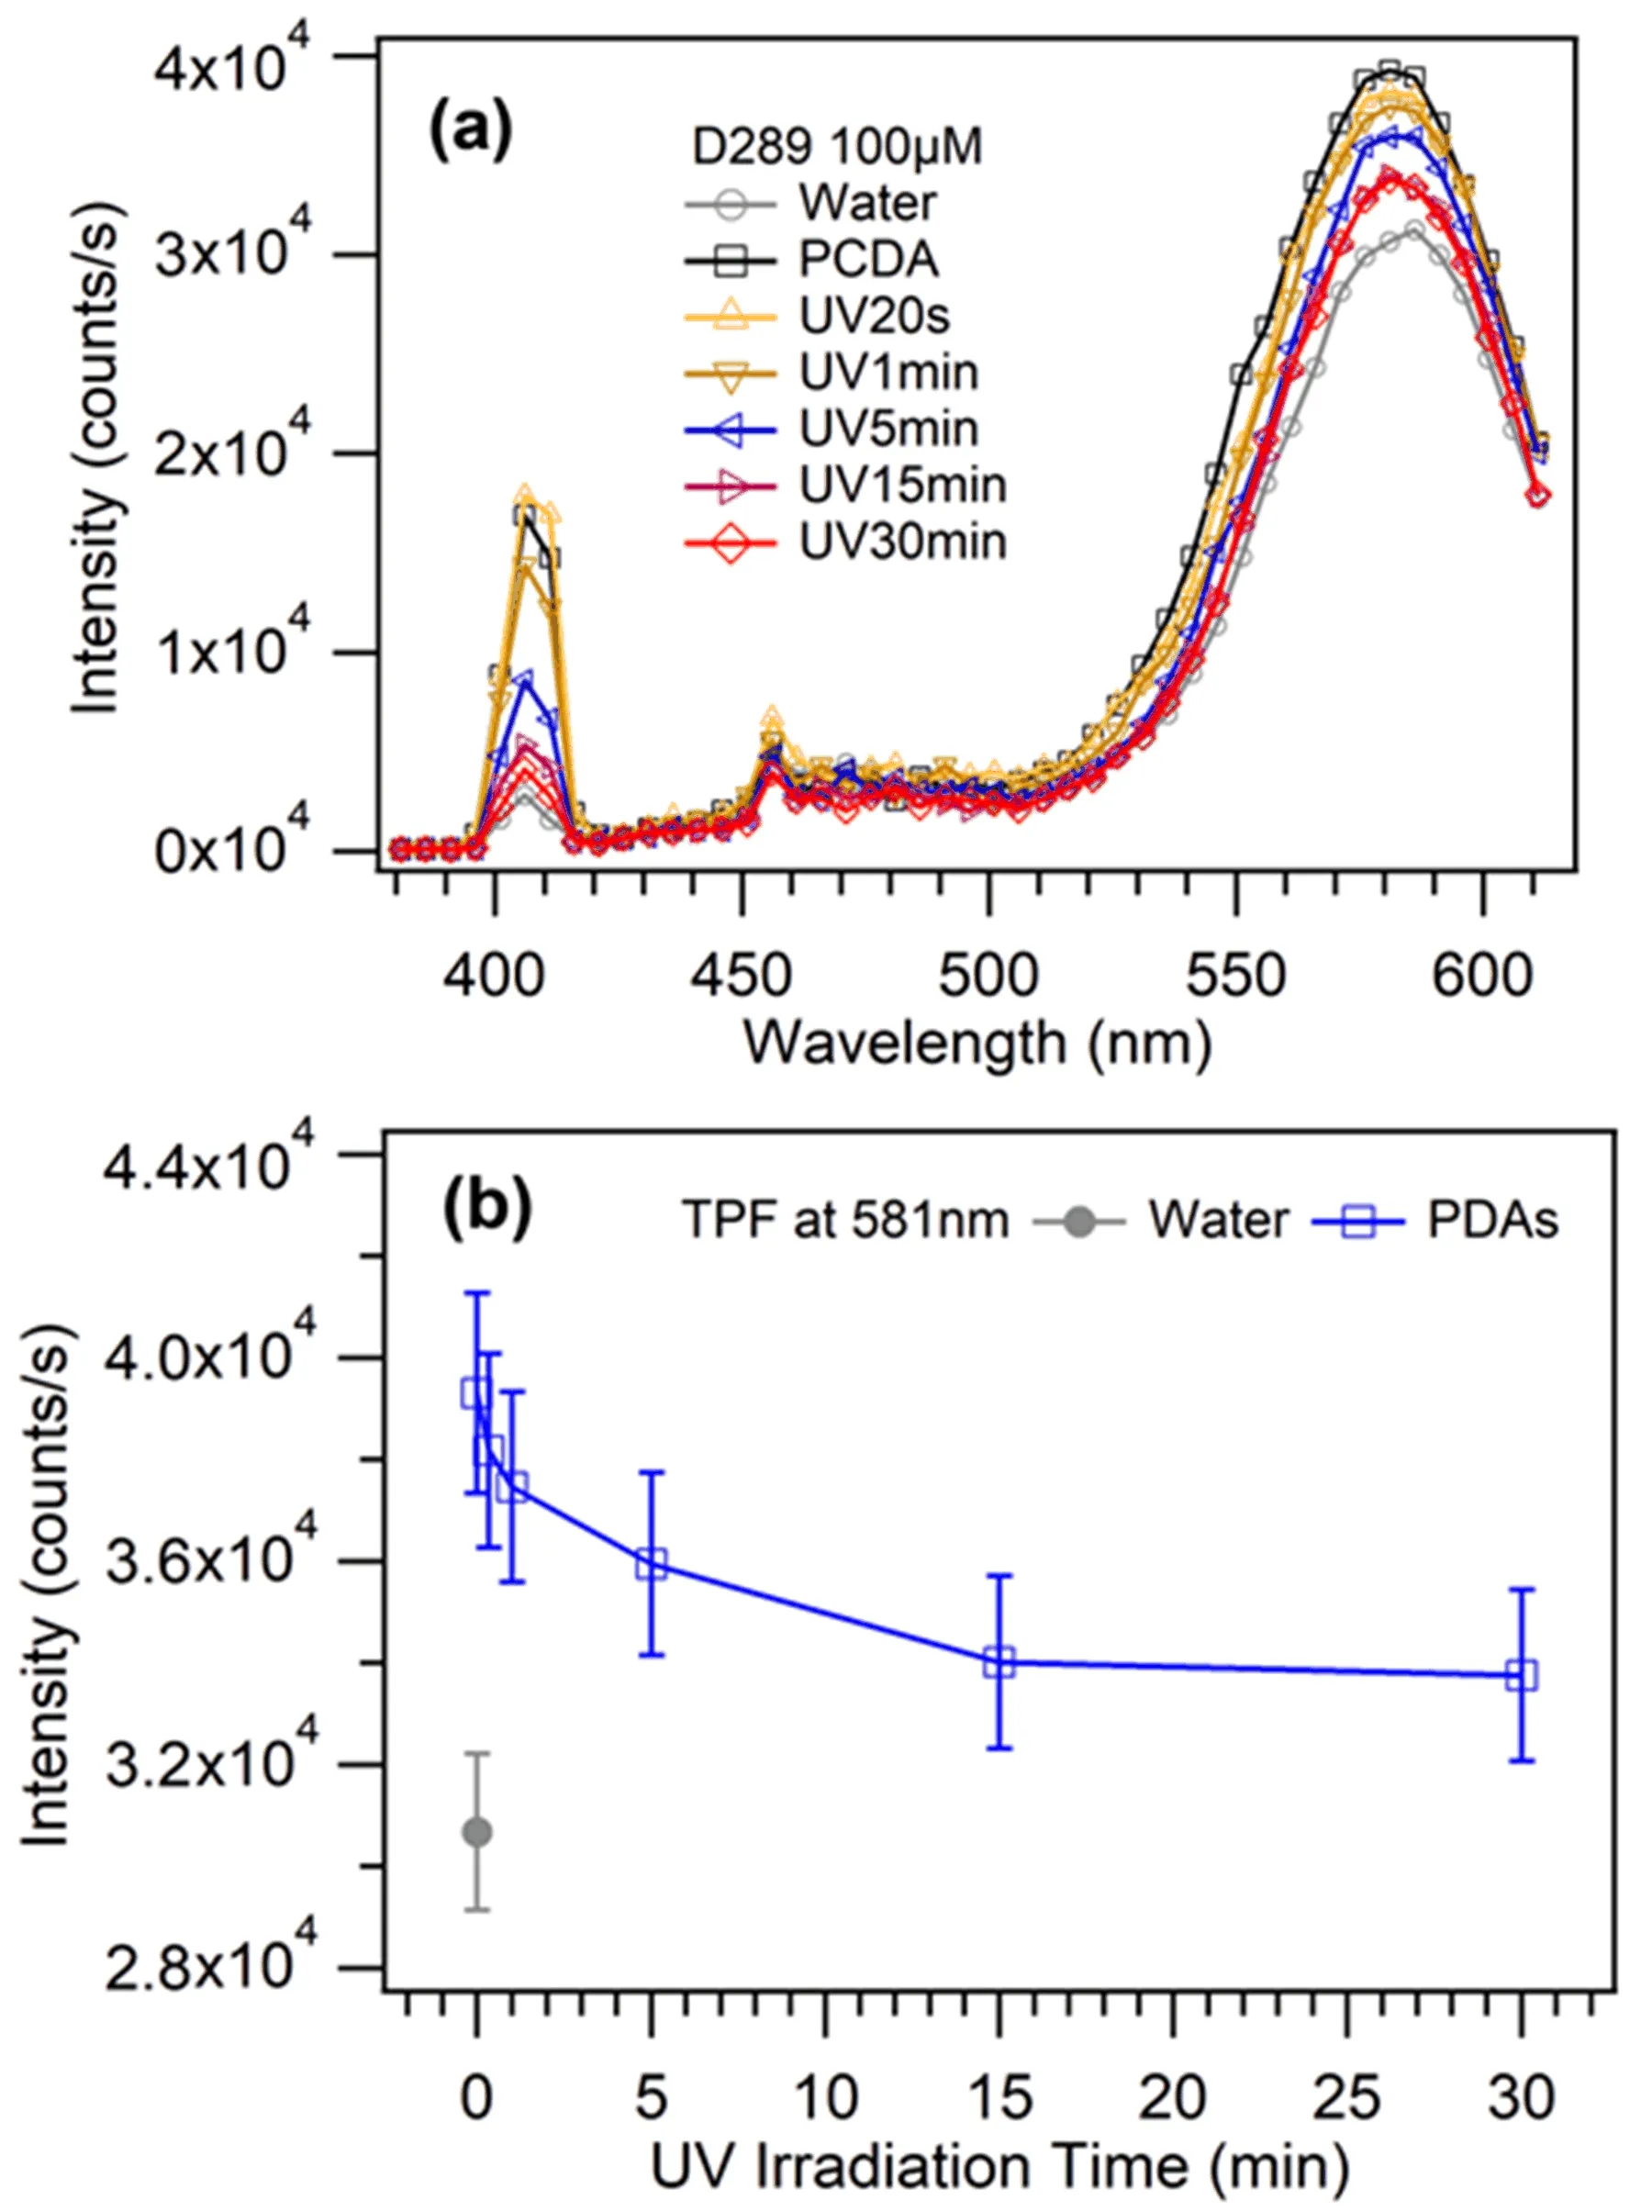
FIG.4 (a)Emission spectra of D289 mixed with the aqueous solution of PDAs vesicles upon laser excitation.The concentration of D289 molecules is 100µmol/L.The intensities are the corrected results with the background signal from vesicles subtracted.(b)TPF signal of the PDAs vesicles at 581 nm as a function of UV irradiation time.
Besides,the resonant SHS signal from D289 adsorbed at the surface of vesicles decreased sharply with the increase of UV irradiation time(FIG.6).After 5 min’s-(blue phase)and 30 min’s-(red phase)UV irradiation,the signal intensity attenuated by more than 50%and 85%,respectively,compared with the initial signal intensity of PCDA vesicles with saturated D289 adsorption.In our experiment,the resonant SHS signal kept stable during∼2 h after D289 with fixed concentration added into PDAs vesicle solution.That is to say,no permeability of D289 molecules was observed from the outer to the inner surface across the bilayer structure of PDAs vesicles.Hence,the effect of molecular transport on the attenuation of signal intensity was excluded.For the centrosymmetric system with probe molecules adsorbed on its surface,the intensity of SHS signal is proportional to the square of the product of surface coverage and microscopic hyper-polarizability with the ensemble average of all possible molecular orientations[34,54].Then,we will mainly discuss from these two aspects about what happened on vesicle surfaces under different UV irradiation dose which affected the intensity of SHS signal from D289 adsorption.
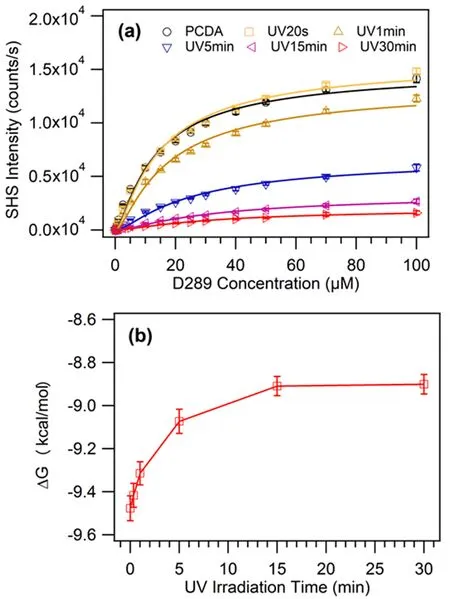
FIG.5 (a)The SHG scattering of D289 molecules at the surface of PDAs vesicles in aqueous solution with varied bulk concentration.The solid lines indicate the Langmuir fittings.(b)Gibbs free energy of adsorbed D289 molecules at the surface of PDAs vesicles as a function of UV irradiation time.The hyper-Rayleigh scattering from the D289 and the weak intrinsic scattering signals from vesicles have been subtracted from the measured SHG intensity.
IV.DISCUSSION
In literatures,it was commonly accepted that the length of the conjugated framework in conjugated PDAs polymer increases with UV irradiation until the appearance of deep blue phase(max absorbance at∼635 nm),and then it does not change much with further irradiation dose[2,55].The analysis in the following highlights a continuous change of interfacial conformation beyond the conjugated framework of PDAs vesicles with the increased UV irradiation.
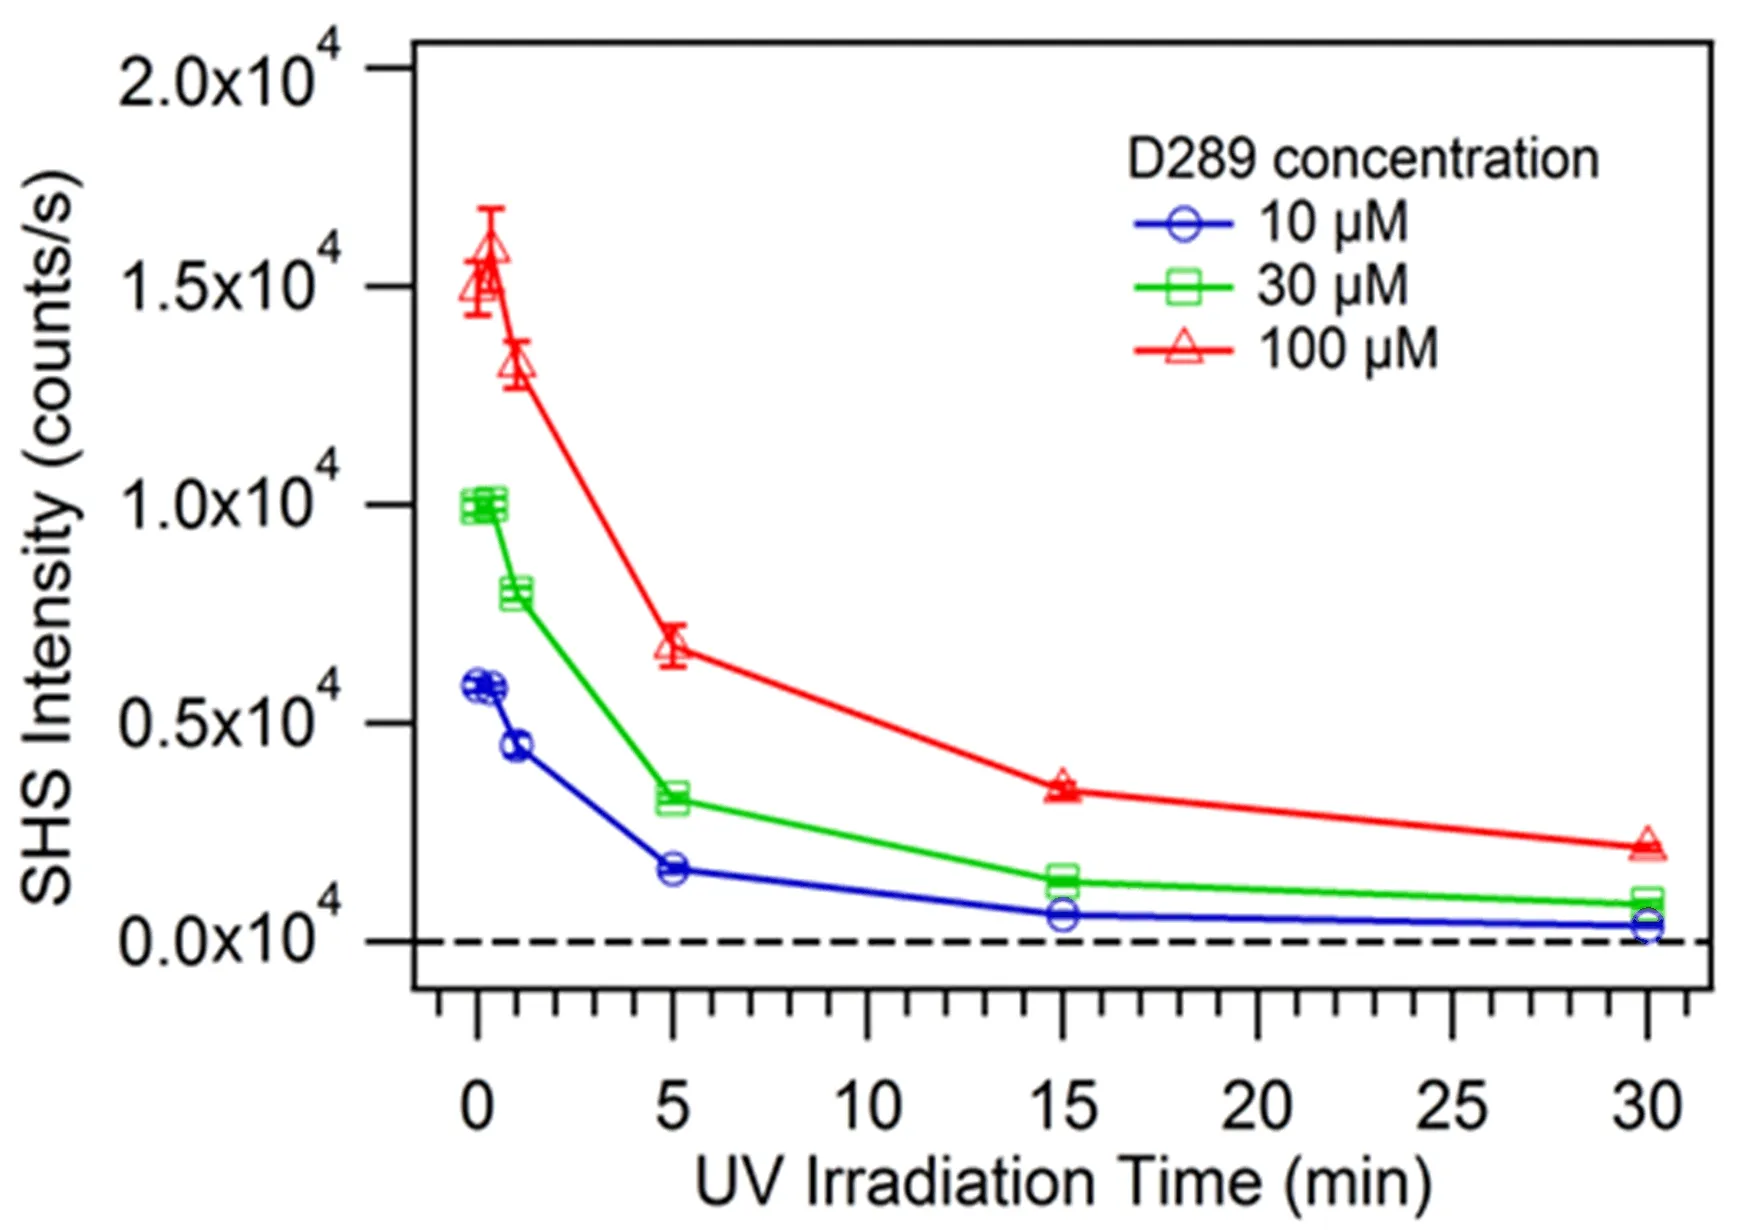
FIG.6 SHS signal from D289 molecules at the surface of PDAs vesicles in aqueous solution as a function of UV irradiation time.The data with D289 molecules at three concentrations(10,20,and 100µmol/L)are shown here.The data are the same as the data shown in FIG.5 and was only plotted differently so that we can make better comparison.
Although the ionization constant of carboxyl head group in PDAs vesicle may decrease with the increase of polymerization degree due to its enhanced hydrophobicity[56,57],the blue curve in FIG.2(b)indicates that the interfacial charge density was almost the same(with an average value of(0.0062±0.0003)−e/nm2)for PDAs vesicles with different forms.After saturated D289 adsorption,the interfacial charge density displayed a monotonous increase trend with the increase of UV irradiation time,as shown in the zeta potential plot by the green curve in FIG.2(b).Compared with bare PDAs vesicles,the interfacial charge density of vesicles with saturated D289 adsorption decreased by(0.0032±0.0001),(0.0027±0.0001),(0.0029±0.0002),(0.0024±0.0001),(0.0020±0.0001),and(0.0021±0.0002)−e/nm2for PCDA,UV20s,UV1min,UV5min,UV15min,and UV30min,respectively.Assuming this variety in the interfacial charge density of vesicles is from the adsorbed positively charged D289 molecules,a decrease in the adsorption density of D289 molecules at the surface of PDAs vesicles is expected.However,the significant decrease in the SHG scattering from the PDAs vesicles after D289 adsorption shown in FIG.6 is not able to be explained only by this effect.If one simply estimates the intensity of SHS signal with the fact that the intensity is in proportional to the square of the surface coverage of the adsorbed dye molecules[34,54],the decrease of the SHS intensity is 29%±1%,18%±1%,44%±2%,61%±3%and 57%±5%for UV20s,UV1min,UV5min,UV15min and UV30min,respectively,compared with the intensity of PCDA vesicles with no UV irradiation.There is a significant discrepancy between this estimation and the experimental observation shown in FIG.6.
This discrepancy indicates that the orientational order of the D289 molecules at the surface of PDAs vesicles also varied notably with the increased UV irradiation.Generally,the chromatic transition of PDAs from blue to red forms was attributed to the structural distortion in the alternating ene-yne backbone[1,7,11−16],which was accompanied by the reorganization of the tilted alkyl side chains and terminated chains[18−22].Because the carboxyl terminated groups of PDAs vesicles provide the interfacial adsorption sites for the D289 molecules,the reorganization process of the carboxyl chains of PDAs vesicles caused by the photo-induced backbone distortion may cause change in the orientation order of the D289 molecules.So,it is reasonable to attribute the significant decrease in the SHG scattering from the PDAs vesicles after D289 adsorption to the orientational variations of the adsorbed D289 molecules as illustrated in FIG.7.This illustration accorded with the side-chain disarray of PDAs vesicles during chromatic transitions based on the absorption spectra and Raman spectra studies on the bulk features of PDAs vesicles[7].From FIG.7 the overall order-disorder transition is accompanied by the tilt angle change of D289 molecules from closer to the surface normal to more parallel to the vesicle surface.The plot of the changed adsorption free energy of D289 molecules at the surface of PDAs vesicles shown in FIG.5(b)indicates that the driving force to the vesicle surface for charged D289 molecules became slightly weaker during chromatic transition process.This result can be understood by the weaker adsorption interaction and chain-chain interaction between the D289 molecules and the surface of PDAs vesicles with the increased UV irradiation.The geometric constrains[58−60]from the continuous order-disorder transition of the spatial conformation of the interfacial carboxyl chains sterically hinder the electrostatic attraction interaction between the positively charged D289 molecules and the negatively charged surface of PDAs vesicles due to the decrease in the adsorption density of D289 molecules at the surface of PDAs vesicles with the increased UV irradiation.Besides,the chain-chain interaction is known to significantly influence the molecular energetics at the interfaces[40,44].The interaction between the D289 molecules and the carboxyl chains of PDAs may be weakened by the ragged distortion and interleaving of the carboxyl chains in chromatic transitions from monomer to blue-to-purple-to-red forms as shown in FIG.7.
FIG.3 also shows that not only the red form,but also the blue and purple forms of PDAs vesicles have TPF emission.This result was different from the traditional view on the single-photon excitation induced fluorescence that the blue phase of PDAs chains, films and vesicles was non- fluorescent and only the red phase showed fluorescence[3,61−66].This result may be understood from several aspects:For TPF,the background signal is strongly suppressed due to the multiphoton absorption;Two-photon excitation typically uses near-infrared excitation light(810 nm for this work),which can minimize scattering in the vesicles and lead to an increased penetration depth[67,68];Besides,the relatively high peak power density(43±4 MW/cm2)of excitation source also contributes to the high emis-sion efficiency of TPF for all the forms of PDAs vesicles.In addition,the fluorescence intensity around 581 nm of D289 molecules shows a basically decreasing trend with the increase of UV irradiation(FIG.4(b)).Aminostyryl dyes are known to present enhanced fluorescence and emission shift when binding to membranes[69,70].So,this observation reveals that the interaction between D289 molecules and PDAs vesicles becomes weaker with the increase of UV irradiation,which accords with the decrease of SHG signal and Gibbs free energy of adsorbed D289 molecules and the order-disorder transitions of the PDAs chains at the surface of PDAs vesicles.
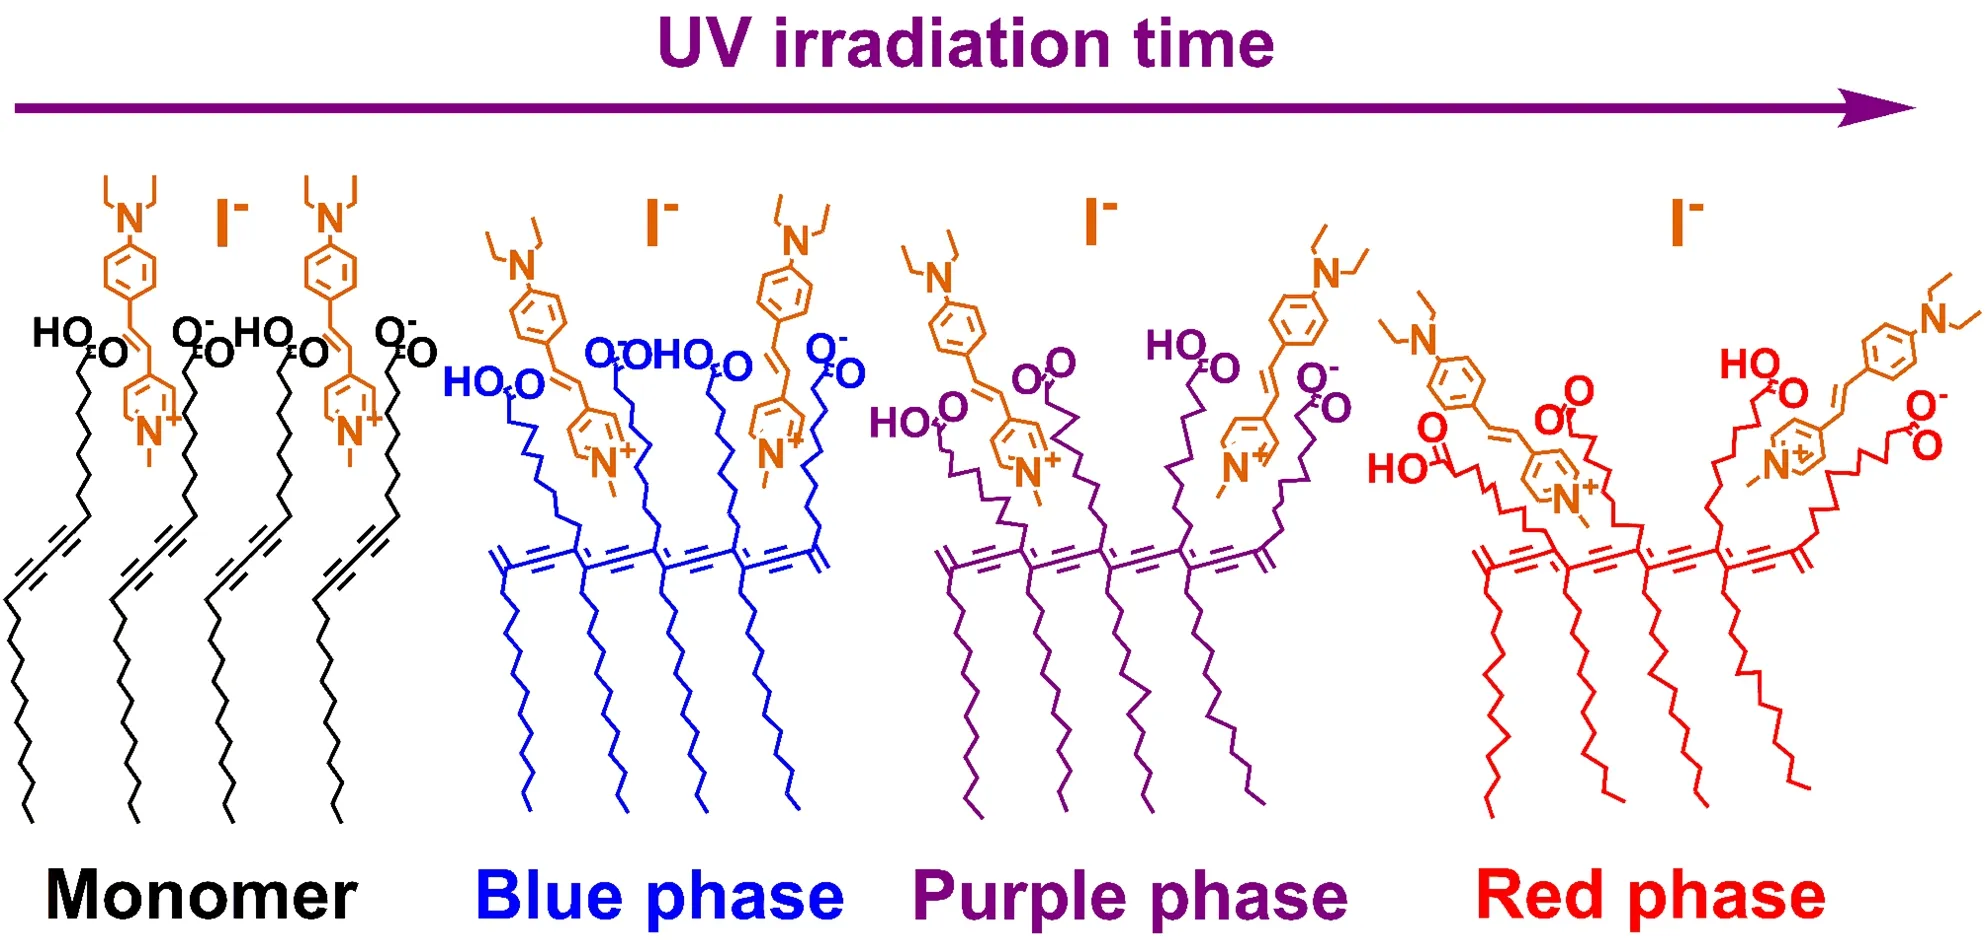
FIG.7 Simple model for the continuous movement of carboxyl terminated chain affecting the orientation of adsorbed D289 molecules on the surface of PDAs vesicles in chromatic transitions from monomer to blue-to-purple-to-red forms.Because the estimated surface density of D289 is almost 0.0025(e/nm2)which is comparable to one D289 molecule per 400 nm2,the actual average distance between D289 molecules should be much larger than that shown here.
V.CONCLUSION
In this work,we inspected the interfacial conformation of PDAs vesicles in chromatic transitions by the adsorption behaviors of charged molecules on the bilayer surface with SHG and zeta potential measurements.The results revealed that the adsorption of D289 molecules on the bilayer surface of PDA vesicle was evidently influenced by the chromatic transitions from monomer-to-blue-to-purple-to-red forms.It was observed that the adsorption free energy of D289 molecules at the surface of PDAs vesicles decreased with the increased UV irradiation.Also,the SHG scattering from the adsorbed D289 significantly decreased with the increased UV irradiation.This decrease was not able to be completely explained by the slight decrease of the adsorption density of D289 molecules.This phenomenon was then explained by the idea that the orderdisorder transition significantly affected the orientation of adsorbed D289 molecules.The relatively smaller adsorption free energy,lower adsorption density and the less ordered D289 molecules at the surface of the PDAs vesicles support the fact that the monomer-to-blue-topurple-to-red chromatic transition of PDAs vesicles was also an order-disorder transition process of carboxyl terminated chains.
VI.ACKNOWLEDGMENTS
Shun-li Chen thanks Dr.Haibao Jin at University of North Carolina at Chapel Hill for helpful discussions.This work was supported by the National Natural Science Foundation of China(No.21403292,No.21403293,No.21473249,and No.21673285),and the funding from the Shenzhen city(No.JCYJ20170307150520453).
[1]N.Mino,H.Tamura,and K.Ogawa,Langmuir 7,2336(1991).
[2]S.Okada,S.Peng,W.Spevak,and D.Charych,Acc.Chem.Res.31,229(1998).
[3]J.M.Kim,Y.B.Lee,D.H.Yang,J.S.Lee,G.S.Lee,and D.J.Ahn,J.Am.Chem.Soc.127,17580(2005).
[4]H.Peng,X.Sun,F.Cai,X.Chen,Y.Zhu,G.Liao,D.Chen,Q.Li,Y.Lu,and Y.Zhu,Nat.Nanotechnol.4,738(2009).
[5]J.Baek,J.F.Joung,S.Lee,H.Rhee,M.H.Kim,S.Park,and J.Yoon,J.Phys.Chem.Lett.7,259(2016).
[6]J.F.Joung,J.Baek,Y.Kim,S.Lee,M.H.Kim,J.Yoon,and S.Park,Phys.Chem.Chem.Phys.18,23096(2016).
[7]A.Potisatityuenyong,R.Rojanathanes,G.Tumcharern,and M.Sukwattanasinitt,Langmuir 24,4461(2008).
[8]D.J.Ahn,E.H.Chae,G.S.Lee,H.Y.Shim,T.E.Chang,K.D.Ahn,and J.M.Kim,J.Am.Chem.Soc.125,8976(2003).
[9]K.Itoh,T.Nishizawa,J.Yamagata,M.Fujii,N.Osaka,and I.Kudryashov,J.Phys.Chem.B 109,264(2005).
[10]J.J.Schaefer,C.B.Fox,and J.M.Harris,J.Raman Spectrosc.43,351(2012).
[11]D.S.Johnston,L.R.McLean,M.A.Whittam,A.D.Clark,and D.Chapman,Biochemistry 22,3194(1983).
[12]A.Singh,R.B.Thompson,and J.M.Schnur,J.Am.Chem.Soc.108,2785(1986).
[13]V.Dobrosavljevićand R.M.Stratt,Phys.Rev.B 35,2781(1987).
[14]J.S.Filhol,J.Deschamps,S.G.Dutremez,B.Boury,T.Barisien,L.Legrand,and M.Schott,J.Am.Chem.Soc 131,6976(2009).
[15]L.Yu and S.L.Hsu,Macromolecules 45,420(2011).
[16]N.Charoenthai,T.Pattanatornchai,S.Wacharasindhu,M.Sukwattanasinitt,and R.Traiphol,J.Colloid Interface Sci.360,565(2011).
[17]A.Lio,A.Reichert,D.J.Ahn,J.O.Nagy,M.Salmeron,and D.H.Charych,Langmuir 13,6524(1997).
[18]H.Tamura,N.Mino,and K.Ogawa,Thin Solid Films 179,33(1989).
[19]H.Göbel,K.Kjaer,J.Als-Nielsen,and H.Möhwald,Thin Solid Films 179,41(1989).
[20]D.Y.Sasaki,R.W.Carpick,and A.R.Burns,J.Colloid Interface Sci.229,490(2000).
[21]R.W.Carpick,D.Y.Sasaki,M.S.Marcus,M.Eriksson,and A.R.Burns,J.Phys.:Condens.Matter 16,R679(2004).
[22]Y.Lifshitz,Y.Golan,O.Konovalov,and A.Berman,Langmuir 25,4469(2009).
[23]Y.R.Shen,Nature 337,519(1989).
[24]K.B.Eisenthal,Chem.Rev.96,1343(1996).
[25]Z.Chen,Y.R.Shen,and G.A.Somorjai,Annu.Rev.Phys.Chem.53,437(2002).
[26]H.F.Wang,W.Gan,R.Lu,Y.Rao,and B.H.Wu,Int.Rev.Phys.Chem.24,191(2005).
[27]S.Nihonyanagi,J.A.Mondal,S.Yamaguchi,and T.Tahara,Annu.Rev.Phys.Chem.64,579(2013).
[28]H.F.Wang,Prog.Surf.Sci.91,155(2016).
[29]R.J.Feng,L.Lin,Y.Y.Li,M.H.Liu,Y.Guo,and Z.Zhang,Biophys.J.112,2173(2017).
[30]W.Wang and S.Ye,Phys.Chem.Chem.Phys.19,4488(2017).
[31]S.L.Chen,L.Fu,W.Gan,and H.F.Wang,J.Chem.Phys.144,(2016).
[32]S.L.Chen,L.Fu,Z.A.Chase,W.Gan,and H.F.Wang,J.Chem.Phys.C 120,25511(2016).
[33]H.M.Chase,S.Chen,L.Fu,M.A.Upshur,B.Rudshteyn,R.J.Thomson,H.F.Wang,V.S.Batista,and F.M.Geiger,Chem.Phys.Lett.683,199(2017).
[34]H.F.Wang,E.C.Y.Yan,Y.Liu,and K.B.Eisenthal,J.Phys.Chem.B 102,4446(1998).
[35]J.I.Dadap,J.Shan,K.B.Eisenthal,and T.F.Heinz,Phys.Rev.Lett.83,4045(1999).
[36]S.H.Jen,H.L.Dai,and G.Gonella,J.Chem.Phys.C 114,4302(2010).
[37]W.Gan,B.Xu,and H.L.Dai,Angew.Chem.Int.Ed.50,6622(2011).
[38]C.Lütgebaucks,C.Macias-Romero,and S.Roke,J.Chem.Phys.146,044701(2017).
[39]Y.J.Sang,F.Y.Yang,S.L.Chen,H.B.Xu,S.Zhang,Q.H.Yuan,and W.Gan,J.Chem.Phys.142,224704(2015).
[40]F.Yang,W.Wu,S.Chen,and W.Gan,Soft Matter 13,638(2017).
[41]A.Srivastava and K.B.Eisenthal,Chem.Phys.Lett.292,345(1998).
[42]Y.You,A.Bloom field,J.Liu,L.Fu,S.B.Herzon,and E.C.Yan,J.Am.Chem.Soc.134,4264(2012).
[43]H.Fang,W.Wu,Y.Sang,S.Chen,X.Zhu,L.Zhang,Y.Niu,and W.Gan,Rsc Advances 5,23578(2015).
[44]W.Wu,H.Fang,F.Yang,S.Chen,X.Zhu,Q.Yuan,and W.Gan,J.Phys.Chem.C 120,6515(2016).
[45]T.Manaka,T.Yamada,H.Hoshi,K.Ishikawa,H.Takezoe,and A.Fukuda,Jpn.J.Appl.Phys.35,L832(1996).
[46]T.Manaka,T.Yamada,H.Hoshi,K.Ishikawa,H.Takezoe,and A.Fukuda,Synth.Met.84,963(1997).
[47]T.Manaka,T.Yamada,H.Hoshi,K.Ishikawa,and H.Takezoe,Synth.Met.95,155(1998).
[48]G.Zou,T.Manaka,D.Taguchi,and M.Iwamoto,Colloids Surf.A:Physicochem.Eng.Aspects 284,424(2006).
[49]M.Antonietti and L.Vorwerg,Colloid Polym.Sci.275,883(1997).
[50]S.H.Jen,G.Gonella,and H.L.Dai,J.Phys.Chem.A 113,4758(2009).
[51]J.C.Berg,An Introduction to Interfaces&Colloids:the Bridge to Nanoscience,Singapore:World Scientific,(2010).
[52]K.Marinova,R.Alargova,N.Denkov,O.Velev,D.Petsev,I.Ivanov,and R.Borwankar,Langmuir 12,2045(1996).
[53]H.F.Wang,T.Troxler,A.G.Yeh,and H.L.Dai,Langmuir 16,2475(2000).
[54]H.M.Eckenrode,S.H.Jen,J.Han,A.G.Yeh,and H.L.Dai,J.Phys.Chem.B 109,4646(2005).
[55]D.Dini,M.R.J.Calvete,and M.Hanack,Chem.Rev.116,13043(2016).
[56]X.Zhu,P.Duan,L.Zhang,and M.Liu,Chem.A Euro.J.17,3429(2011).
[57]T.A.Villarreal,S.R.Russell,J.J.Bang,J.K.Patterson,and S.A.Claridge,J.Am.Chem.Soc.139,11973(2017).
[58]W.K.Olson and P.J.Flory,Biopolymers 11,1(1972).
[59]K.A.Melzak,C.S.Sherwood,R.F.Turner,and C.A.Haynes,J.Colloid Interface Sci.181,635(1996).
[60]J.E.DeLorbe,J.H.Clements,M.G.Teresk,A.P.Benfield,H.R.Plake,L.E.Millspaugh,and S.F.Martin,J.Am.Chem.Soc.131,16758(2009).
[61]J.Olmsted III and M.Strand,J.Phys.Chem.87,4790(1983).
[62]R.Lécuiller,J.Berréhar,C.Lapersonne-Meyer,and M.Schott,Phys.Rev.Lett.80,4068(1998).
[63]R.Carpick,T.M.Mayer,D.Y.Sasaki,and A.R.Burns,Langmuir 16,4639(2000).
[64]T.Guillet,J.Berréhar,R.Grousson,J.Kovensky,C.Lapersonne-Meyer,M.Schott,and V.Voliotis,Phys.Rev.Lett.87,087401(2001).
[65]D.J.Ahn and J.M.Kim,Acc.Chem.Res.41,805(2008).
[66]D.E.Wang,L.Zhao,M.S.Yuan,S.W.Chen,T.Li,and J.Wang,ACS Appl.Mater.Interf.8,28231(2016).
[67]W.Denk,J.H.Strickler,and W.W.Webb,Science 248,73(1990).
[68]F.Helmchen and W.Denk,Nat.Methods 2,932(2005).
[69]L.M.Loew,L.B.Cohen,J.Dix,E.N.Fluhler,V.Montana,G.Salama,and W.Jian-young,J.Membrane Biol.130,1(1992).
[70]J.E.González and R.Y.Tsien,Chem.Biol.4,269(1997).
杂志排行

CHINESE JOURNAL OF CHEMICAL PHYSICS的其它文章
- A High-Performance and Flexible Chemical Structure&Data Search Engine Built on CouchDB&ElasticSearch
- Electronic Structure and Optical Properties of K2Ti6O13Doped with Transition Metal Fe or Ag
- Maximum Thermodynamic Electrical Efficiency of Fuel Cell System and Results for Hydrogen,Methane,and Propane Fuels
- Nucleation of Boron-Nitrogen on Transition Metal Surface:A First-Principles Investigation
- Electronic Structures and Optical Properties of Ga Doped Single-Layer Indium Nitride
- A Double Network Hydrogel with High Mechanical Strength and Shape Memory Properties