Electronic Structure and Optical Properties of K2Ti6O13Doped with Transition Metal Fe or Ag
2018-06-27HengliChenHongynLuYuminQiPengJin
Heng-li Chen,Hong-yn Lu,Yu-min Qi*,Peng Jin
a.School of Material Science and Engineering,Hebei University of Technology,Tianjin 300130,China
b.School of Physics and Electronic Information,Huaibei Normal University,Huaibei 235000,China
I.INTRODUCTION
During the past decades,semiconductor-based photocatalysis has received a lot of attention[1–3],since it is a promising eco-friendly technology to solve the environmental pollution and energy shortage by utilizing solar energy.However,the photoreaction efficiency of the most reported materials is very low,and is only active in ultraviolet region[4,5].Moreover,the fast recombination of electrons and holes in the catalyst still remains a tricky problem[6].Therefore,how to effectively utilize sunlight with suppressed electron-hole recombination is the most important subject for developing these materials as a photocatalyst.To improve the photoreaction efficiency,many approaches have been designed[7–12].Among them,metal elements doping is considered as one of the most effective methods[13,14].Furthermore,transition metal doping gets more and more attention due to the unique d electronic configuration of transition metals,which can narrow the band gap or insert a new band into the band gap,and thus extends the absorption edge of photocatalysis to visible light region[15–19].
Nowadays,potassium hexatitanate(K2Ti6O13)has attracted growing attention because of its high performance[20]and low synthesis cost[21,22].In K2Ti6O13crystal,potassium ions are located in the tunnel space formed by a 3D arrangement of TiO6octahedra[23].K2Ti6O13has various applications[24,25],especially as a photocatalyst[26–29].However,K2Ti6O13has a wide band gap of 3.45 eV and shows photocatalytic activity only under UV-light irradiation[30].Therefore,it is necessary to extend the spectral response of K2Ti6O13to visible light by doping transition metals.It is noteworthy that there are many experimental and theoretical reports about 3d transition-metal doping such as iron doping[31–34]and 4d transition-metal doping such as silver doping[35–37]that can shift the optical absorption from UV light to the visible-light region.Inspired by these works,we prepared pure,Fe-doped and Ag-doped K2Ti6O13and studied their optical properties.To understand our experimental results,we designed computational models of pure,Fe-doped and Agdoped K2Ti6O13(Fe or Ag atom substitutes for the Ti atom).The band structure,density of states,the imaginary part ε2(ω)of dielectric function and the absorption spectrum of them were studied by the first-principles pseudoptential plane-wave method based on the density functional theory(DFT).The calculated optical results basically agree with our experimental research.Most importantly,the Ag-doped K2Ti6O13exhibits higher visible-light photocatalytic efficiency than the pure and Fe-doping cases.The current results are useful for designing K2Ti6O13related materials that have absorption under visible light.
II.EXPERIMENTS
Fe-doped TiO2(0.2 mol%doping)and Ag-doped TiO2(0.2 mol%doping)are prepared by sol-gel method at room temperature,and then by hydrothermal synthesis with KOH,Fe-doped and Ag-doped K2Ti6O13are prepared.In sol-gel process, firstly,concentrated nitric acid is diluted with deionized water,then the dilute nitric acid(2 wt%)and the sodium polyacrylate(5 wt%)are mixed and stirred for 30 min,the resulting solution is named as solution A.Secondly,butyl titanate,absolute ethanol and ferric nitrate or silver nitrate are also mixed and stirred for 30 min,named as solution B.Finally,the solution B is added to the solution A and stirred for 2 h.Then,the Fe-doped or Ag-doped TiO2is obtained by filtering.For the hydrothermal synthesis,Fe-doped TiO2or Ag-doped TiO2is added to KOH aqueous solution(8 mol/L),and then the mixture is heated at 150◦C in stainless steel autoclaves for 12 h.Finally,the Fe-doped or Ag-doped K2Ti6O13is obtained by filtering and the products are washed with deionized water.For comparison,pure K2Ti6O13is prepared according to the above procedure without using ferric nitrate or silver nitrate.The samples are characterized by X-ray diffraction(Smart Lab)with Cu-Kα irradiation(λ=0.15406 nm),scanning electron microscopy(S-4800)with energy dispersive spectrometer and UV-Vis spectroscopy(U-3900H).
The X-ray diffraction(XRD)patterns of pure,Fedoped,and Ag-doped K2Ti6O13are shown in FIG.1.Compared with the diffraction peak at 2θ=24.4◦indexed to(110)crystal plane of pure K2Ti6O13(JCPDS card No.40-0403),the diffraction peaks of Fe-doped K2Ti6O13are slightly shifted to the right,indicating the decreased d-spacing of(110)crystal plane.While the diffraction peaks of Ag-doped K2Ti6O13are slightly shifted to the left,indicating the increased d-spacing of(110)crystal plane.Thus,Fe and Ag atoms both enter into the lattice of K2Ti6O13.Due to the fact that the radii of Fe3+(0.64˚A)[38],Ag+(1.26˚A)[39],and Ti4+(0.68˚A)[38,39]are similar,Fe atom and Ag atom tend to replace Ti atom after doping.Previous studies showed that Fe atom is doped into the TiO2lattice and replaces Ti atom by sol-gel method[31,40]and Ag atom also replaces Ti atom[39].Considering the process of our material preparation,we believe that Fe and Ag atoms have replaced some Ti atoms in K2Ti6O13.
The morphology of synthesised samples are observed by scanning electron microscope(SEM)analysis.After Fe or Ag doping,it can be observed that the radii and lengths of potassium titanate nanowires have increased.In energy dispersive spectrometer(EDS)patterns,Ti,O,and K elements could be observed,which is consistent with the elements of K2Ti6O13.In addition,Fe element in FIG.2(b)and Ag element in FIG.2(c)could be observed,which also proved that the samples contained Fe or Ag element.
The UV-Vis spectra for the three samples are shown in FIG.3.For the pure K2Ti6O13,there is nearly no absorption in the visible light region.For the doped ones,although their absorption intensity in UV region is slightly weaker compared with the pure K2Ti6O13,they have higher absorption than pure K2Ti6O13under visible light irradiation and the edge of the optical absorption has a significant red shift.Therefore,after doping,K2Ti6O13realizes the absorption of visible light.This result also indicates that Fe and Ag ions are successfully doped into potassium titanate.To understand these experimental results,we then carried out detailed first-principles calculations as shown in the following sections.
III.COMPUTATION
A.Calculation methods
According to experimental results,that Fe or Ag atom replaces Ti atom in K2Ti6O13,one Ti atom is substituted by Fe or Ag atom in the calculation model.If the doping concentration in the calculation model is consistent with the experimental one,the model will be very large and make the calculation very timeconsuming.Therefore,we established a 1×2×1 supercell model of K2Ti6O13,which does not affect the qualitative analysis of experimental results.The 1×2×1 supercells of pure K2Ti6O13,Fe-doped K2Ti6O13,and Ag-doped K2Ti6O13used in this work are displayed in FIG.4.As shown in FIG.4(b),one Ti atom is replaced by one Fe or Ag atom for the doping cases.The properties of pure,Fe-doped,and Ag-doped K2Ti6O13are calculated by using the CASTEP code in the Materials Studio software[41].We first optimized the crystal structures using the GGA functional PW91[41].We then calculated their band structures,density of states(DOS),the imaginary parts ε2(ω)of dielectric function and the absorption spectra.In the geometry optimization,the convergence tolerance of maximum displacement,maximum force,maximum stress,and total en-ergy change are 1.0×10⁻⁴nm,0.3 eV/nm,0.05 GPa,and 1.0×10⁻⁵eV/atom,respectively.The cutoff energy for the plane wave expansion is 340 eV,and the Monkhorst-Pack k-point sampling[42]is generated with a 2×3×3 grid.In addition,the used valence electron configurations are 3s23p63d24s2for Ti,2s22p4for O,3s23p64s1for K,3s23p63d64s2for Fe,and 4s24p64d105s1for Ag.In optical properties calculations,“scissors operator”[43]is introduced due to the fact that the band gap calculated by GGA methods is generally underestimated.The optical properties of a semiconductor are mainly determined by its electronic structure,so the nature of light absorption would be found by studying the relationship between the electronic structures and the optical properties of pure,Fe-doped,and Ag-doped K2Ti6O13.
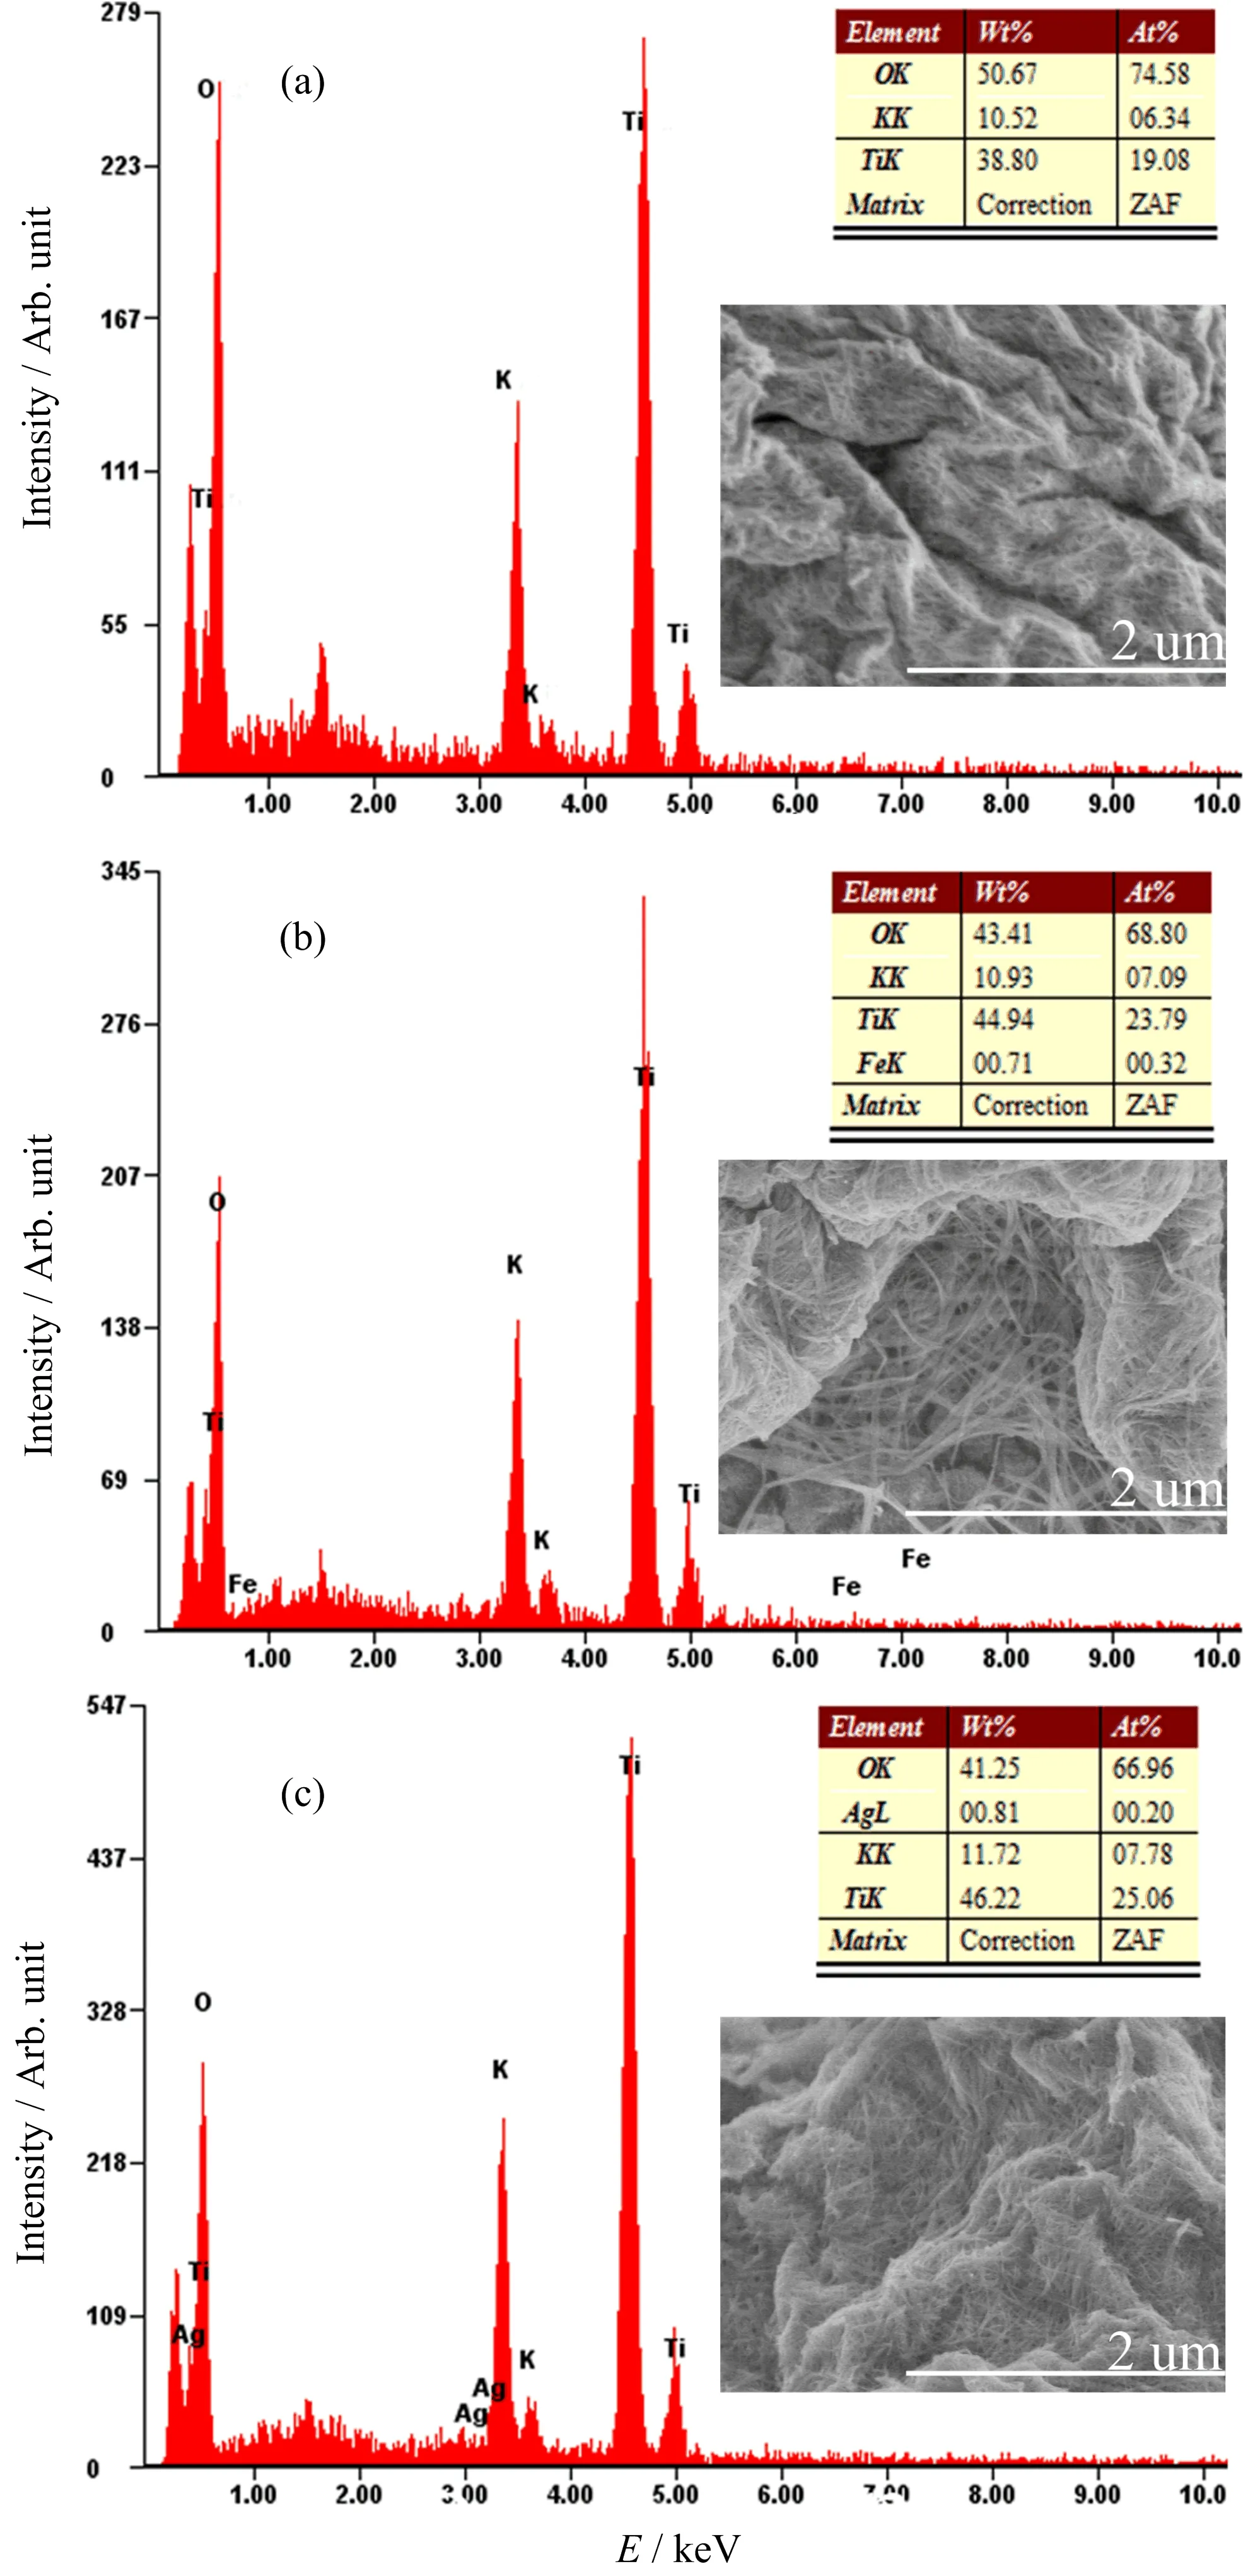
FIG.2 EDS and SEM images of(a)pure,(b)Fe-doped,and(c)Ag-doped K2Ti6O13.
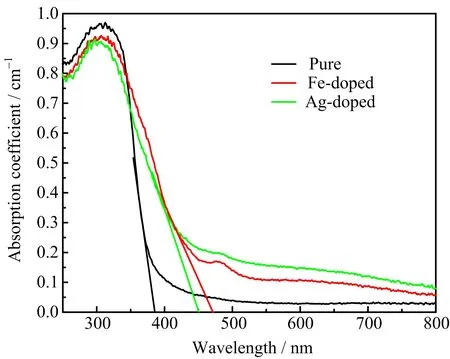
FIG.3 UV-Vis spectra of pure,Fe-doped,and Ag-doped K2Ti6O13.
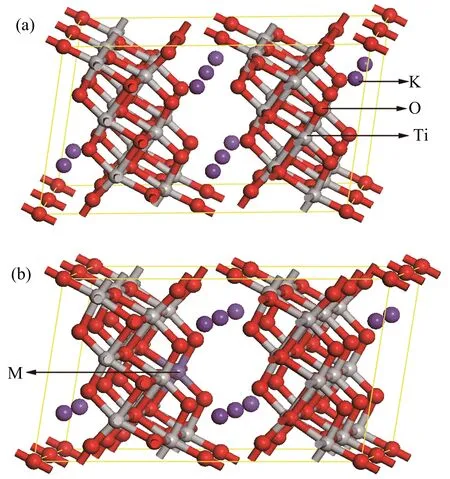
FIG.4 (a)Pure 1×2×1 supercell of K2Ti6O13,(b)supercell of M-doped K2Ti6O13(M=Fe or Ag).
B.Crystal structure
By optimizing the pure K2Ti6O13supercell,we get the lattice parameters as shown in Table I,a=15.850˚A,b=7.616˚A,c=9.243˚A,V=1098.637˚A3.The calculated results are well consistent with the experimental results[44],indicating that our methodology is reasonable.According to the calculated results,we can see that the lattice parameters and the volume of Fe-doped K2Ti6O13are smaller than the pure cases.This can be explained by the smaller radius of iron ion than that of titaniumion.In contrast,for the Ag-doped K2Ti6O13,the lattice parameters and the volume become larger due to the bigger radius of silver ion than that of titanium ion.The changes in the lattice parameters after doping are consistent with the results of our XRD analysis.
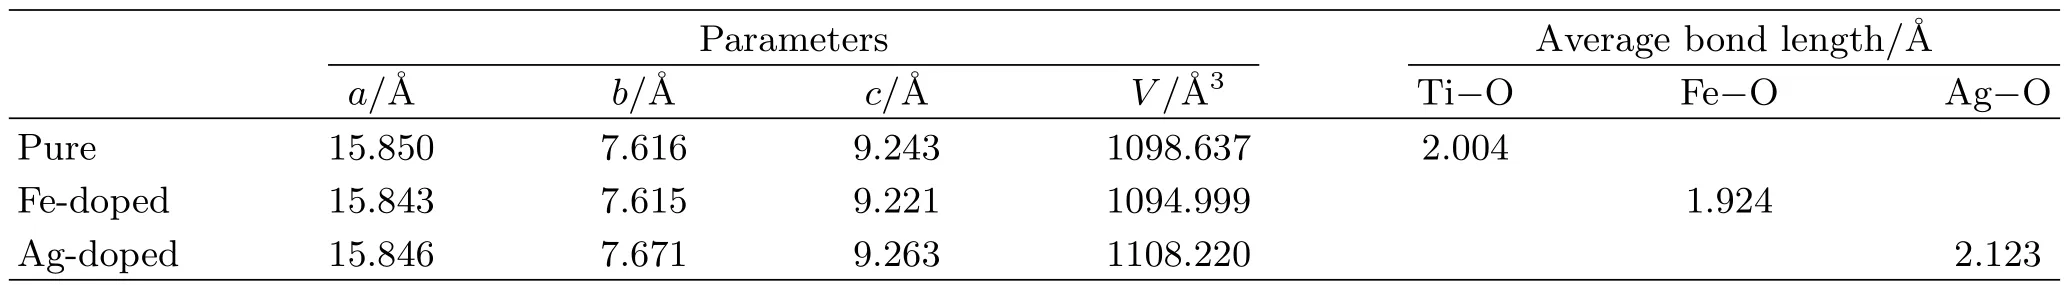
TABLE I Parameters and average bond lengths of pure,Fe-doped,and Ag-doped K2Ti6O13for optimized structure.
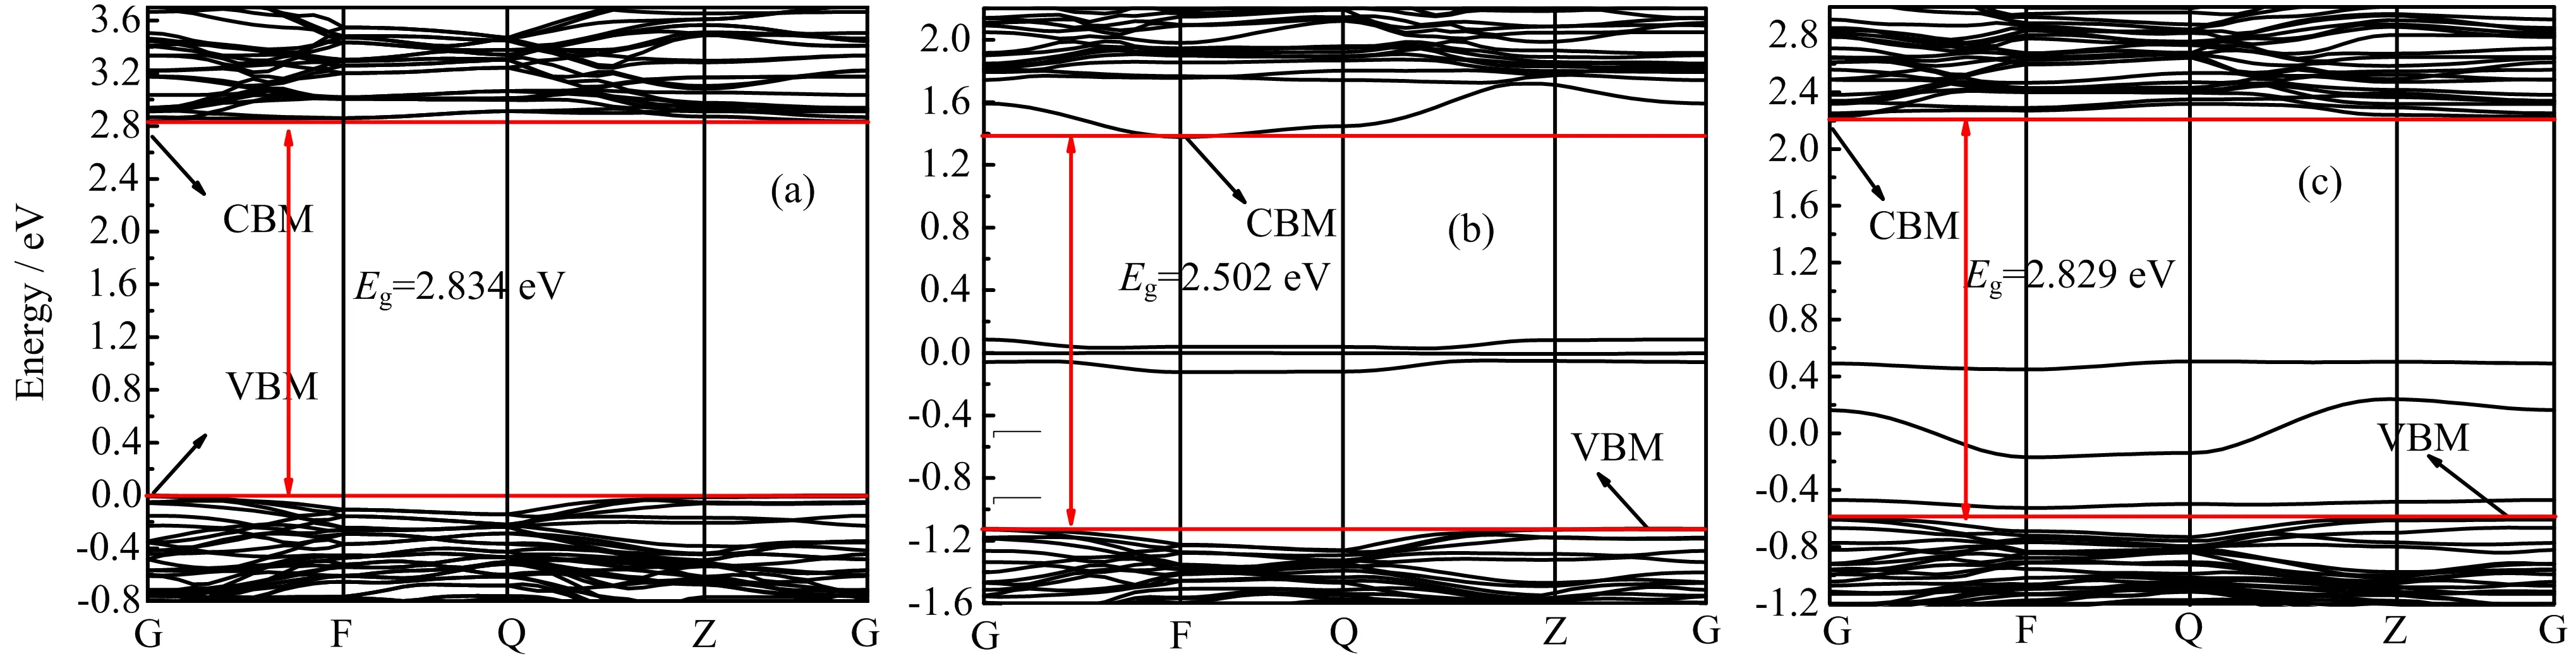
FIG.5 Calculated band structure of(a)pure,(b)Fe-doped,and(c)Ag-doped K2Ti6O13.
C.Band structure
The calculated band structures of pure,Fe-doped,and Ag-doped K2Ti6O13are depicted in FIG.5.The calculated band gap of pure K2Ti6O13is 2.834 eV,which is similar to the previous result[45].But it is underestimated compared with the experimental Eg=3.45 eV[30]due to the well-known shortcoming of DFT[46,47].As shown in FIG.5(b)and(c),the Fe-doped and Ag-doped K2Ti6O13both have three impurity bands in the forbidden band.
The calculated band gap of Fe-doped K2Ti6O13is 2.502 eV.By comparing FIG.5(a)and(b),it is seen that both the conduction band and valence band move down after Fe doping(the conduction band moves down by 1.455 eV and the valence band moves down by 1.123 eV).On one hand,the band gap is narrowed by about 0.332 eV,resulting that the photoresponse range of K2Ti6O13extends to the visible-light region.On the other hand,the width of the impurity bands is only 0.209 eV,which makes it difficult for the electrons excited from the valence band to the intermediate impurity level to return back to the valence band.Thus,the impurity bands can act as a bridge for valence band electrons transition to the conduction band.Electrons can be firstly excited by low-energy photons to impurity bands and then sequentially absorb photons to transfer to the conduction band.The photon absorption energy of Fe-doped K2Ti6O13are reduced,which appears as the absorption of visible light.The calculated band gap of Ag-doped K2Ti6O13is 2.829 eV as shown in FIG.5(c).Comparing FIG.5(a)and(c),the conduction band and valence band also both move down after Ag doping,the conduction band moves down by 0.608 eV and the valence band moves down by 0.603 eV.Thus,the gap of Ag-doped K2Ti6O13also becomes a little narrower.The impurity bands are located just above the valence band maximum(VBM)which form a shallow acceptor because the distance is very small between the impurity bands and the VBM.The impurity bands can reduce the recombination rate of electrons and holes.
D.Density of states
The DOS plots for pure,Fe-doped,and Ag-doped K2Ti6O13are shown in FIG.6.From FIG.6(a),it can be seen that the valence band is dominated by the O 2p states and the conduction band is mainly formed by the Ti 3d states.On the other hand,the Ti 3d states have a little contribution to the valence band and the O 2p states have a little contribution to the conduction band.The K 4s states nearly do not contribute to the valence band and the conduction band.It indicates that there is a strong interaction between Ti atom and O atom.From FIG.6(b)and(c),the VB and CB are mainly formed by O 2p states and Ti 3d states,and the impurity bands are formed by the hybridization of O 2p states and Ti 3d states with Fe 3d states or Ag 4d states.The positions of the CB and VB both move down after doping,agreeing with the calculated results of the band structure.From FIG.6(b),a small DOS peak appears in the forbidden band of Fe-doped K2Ti6O13,which corresponds to the impurity bands in the band structure.In order to better understand the effect of Fe doping on the energy gap,FIG.6(d)shows the enlarged DOS of Fe-doped K2Ti6O13,which reveals that the impurity bands mainly originate from the hybridization between Fe 3d,O 2p,and Ti 3d states.As shown in FIG.6(c)and(e),the impurity bands overlap with the VBM and are hybridized by O 2p states,Ag 4d states,and Ti 3d states.The reason for the overlap can be understood by its band structure,that is,the impurity bands are very close to VBM,as can be seen in FIG.5(c).
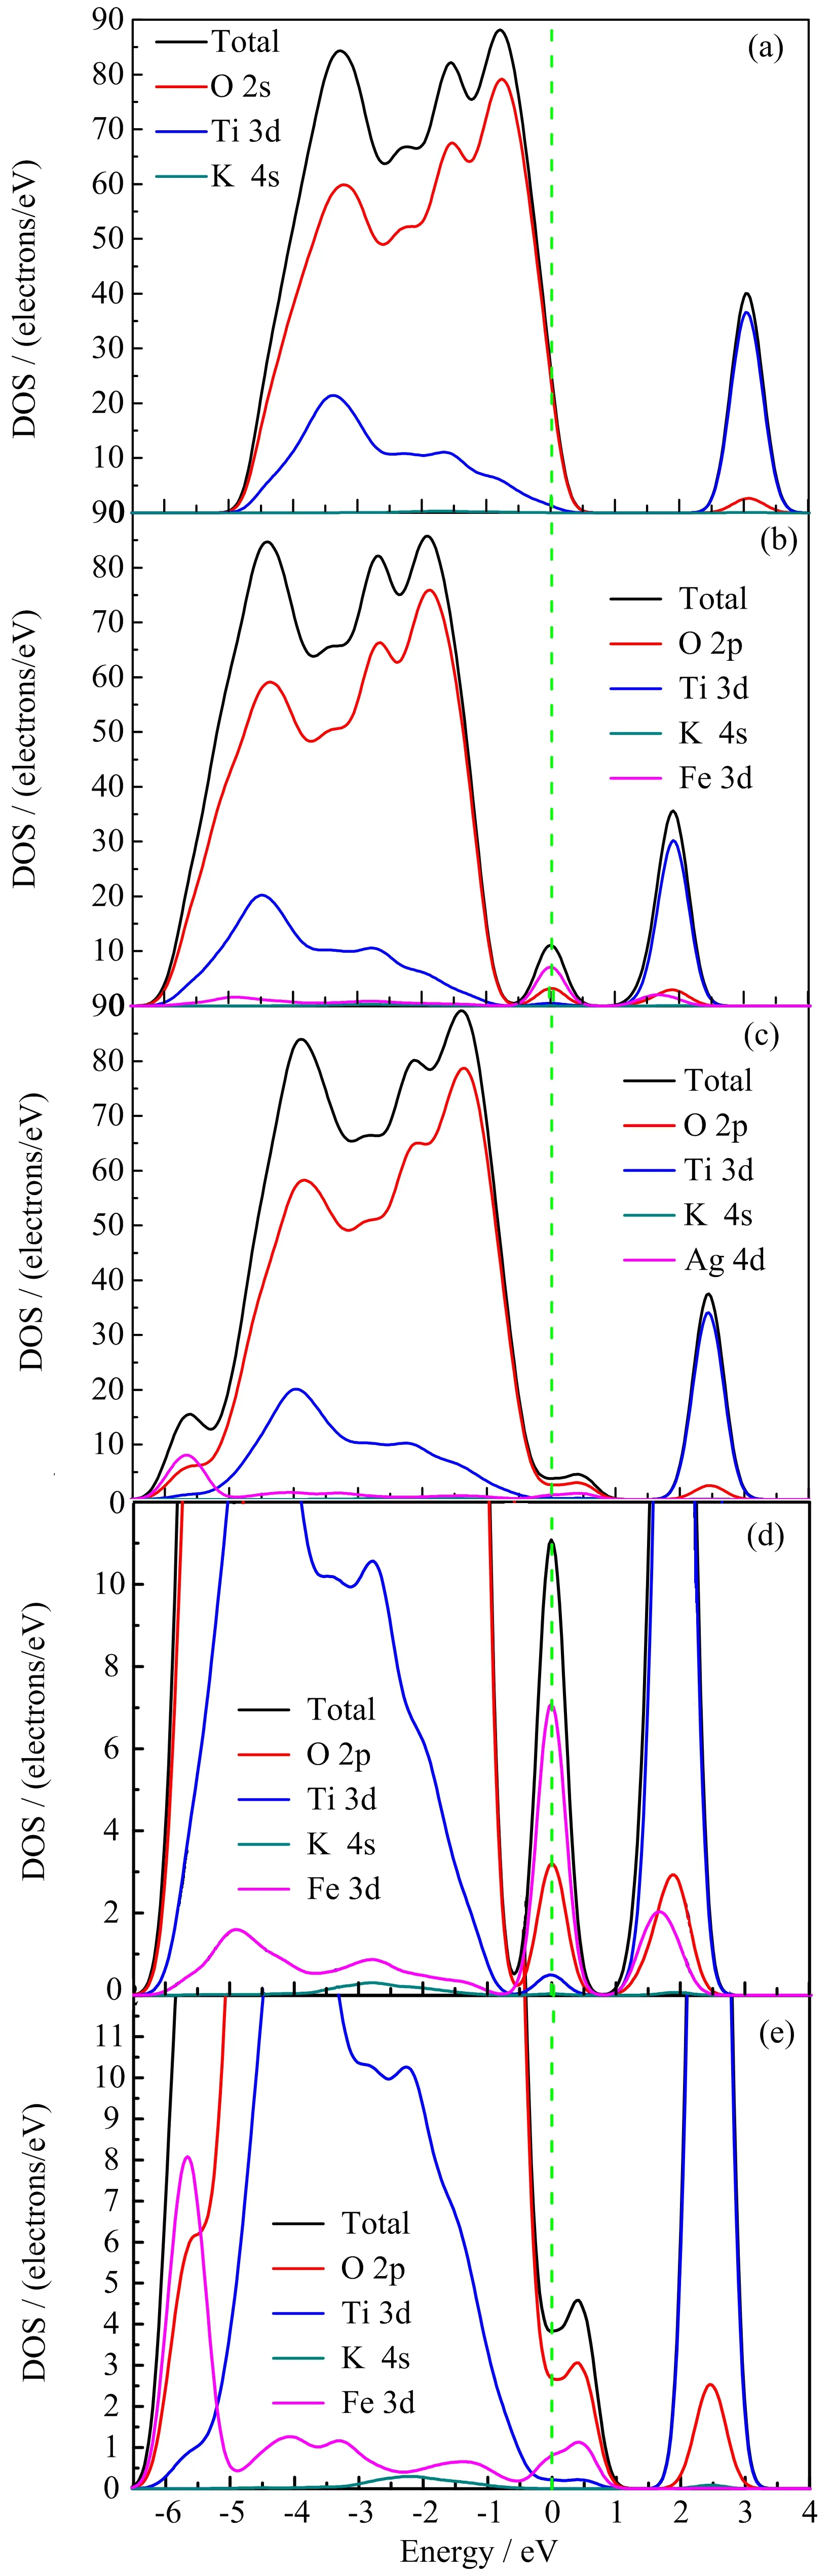
FIG.6 Calculated DOS of(a)pure K2Ti6O13,(b)Fe-doped K2Ti6O13,(c)Ag-doped K2Ti6O13,(d)enlarged DOS of Fe-doped K2Ti6O13,and(e)enlarged DOS of Ag-doped K2Ti6O13.
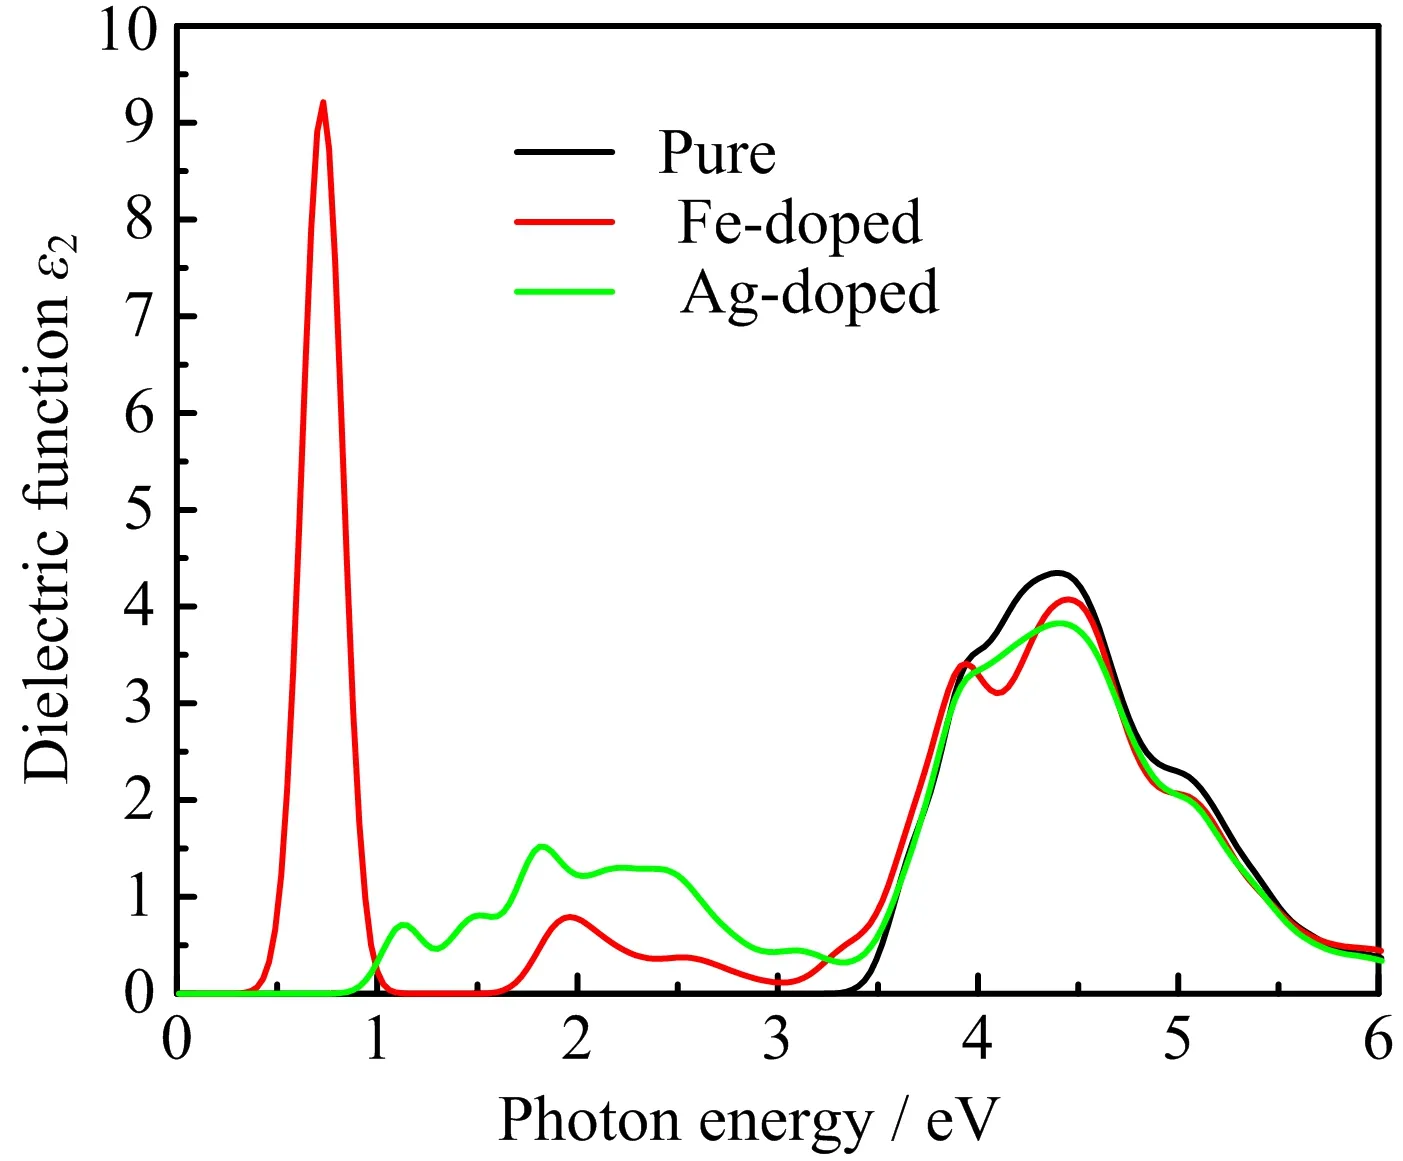
FIG.7 Imaginary part of dielectric function as a function of photon energy for pure,Fe-doped,and Ag-doped K2Ti6O13.
E.Imaginary part ε2(ω)of dielectric function
For the calculations of dielectric function,the scissors operator is set as 0.616 eV due to the differences between the calculated band gap(2.834 eV)and the experimental band gap(3.45 eV).As shown in FIG.7,for pure K2Ti6O13,the ε2(ω)is nearly zero below 3.30 eV.After Fe or Ag doping,however,there are finite values for ε2(ω)and there are also some peaks.These peaks may stem from the impurity bands,which play a bridge role in the process of the electronic transition.Compared with the DOS in FIG.6,the distances between the impurity bands and the VB or CB are small,so the electrons in these impurity bands only need small photon energy to be excited and would have finite absorption in the visible-light region.
F.Absorption spectra
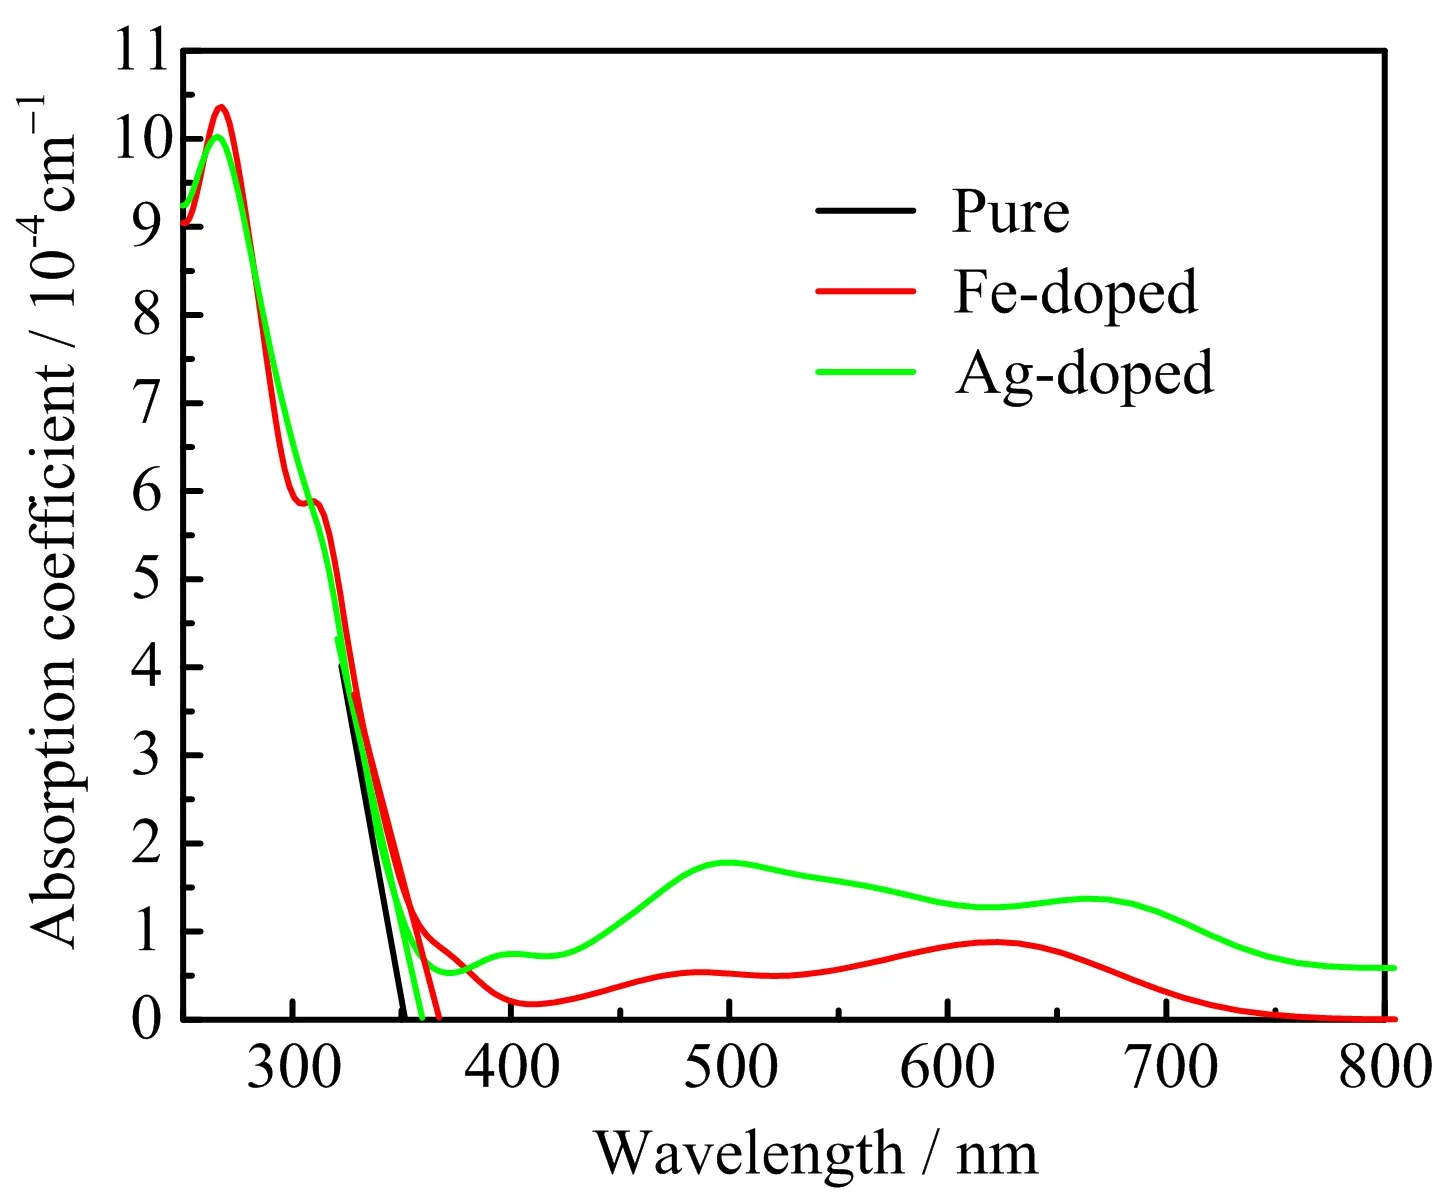
FIG.8 Absorption spectra of pure K2Ti6O13,Fe-doped,and Ag-doped K2Ti6O13.
In order to compare with the experimental result,we plot the absorption coefficient as a function of wavelength in FIG.8,which is also corrected by scissors operator.The absorption spectrum of pure K2Ti6O13is basically consistent with that of our experiment and previous reports[25,30],which also proves the rationality and correctness of our calculation method.It can be seen from FIG.8 that the absorption coefficients of Fe-doped and Ag-doped K2Ti6O13have an obvious red-shift compared with that of pure K2Ti6O13,especially for the Ag-doped case.The absorption intensity is enhanced in the visible light region and the absorption intensity in UV light is slightly weak after doping,which are in good agreement with the experimental results.For Fe doping,the absorption peak occurs in the range of 450 nm to 500 nm in both experimental and calculated research,being consistent with the peak of ε2(ω)in the range of 2.5 eV to 3.0 eV.By comparing with the electronic structure in FIG.5(b)and FIG.6(b),we think it may originate from the transition of the electron from the impurity bands to the conduction bands.However,the red-shifted values of calculated absorption edges are smaller than those of experimental results.This phenomenon may be because that only direct transition and first-order excitation between occupied and unoccupied states are considered in calculation.Besides,phonons and their optical effects have been neglected,and the nonlocal nature of the GGA exchange-correlation functionals is not taken into account when evaluating the matrix elements.Therefore,the computational result cannot perfectly reproduce the experimental results.However,the computational results can give a qualitative explanation and prediction.
IV.CONCLUSION
In summary,the electronic structure and optical properties of pure,Fe-doped,and Ag-doped K2Ti6O13were calculated by the first-principles pseudoptential plane-wave method based on the density functional theory(DFT).The doping effects on the electronic structure and optical properties of K2Ti6O13were analyzed.The calculated optical results basically agree with our experimental research.Most importantly,the Ag-doped K2Ti6O13exhibits higher visible-light photocatalytic efficiency than the pure and Fe-doping ones.Based on the results,the following conclusions have been drawn.Firstly,K2Ti6O13doped with Fe has isolated impurity states in the middle of the band gap,which can be used as a bridge for electron transition from the valence band to the conduction band.Whereas K2Ti6O13with Ag doping has shallow acceptor states above the top of the VB.These impurity bands are mainly from the hybridization by Ag 4d states with Ti 3d states and O 2p states.It is very useful to separate photoexcited electron-hole pairs and improve the photocatalytic properties.Secondly,after doping,the band gap of K2Ti6O13becomes narrower.Thus,the absorption spectra exhibit obvious red-shifted absorption band edge.The calculated results qualitatively agree with our experimental results.Our results can be used to tune the optical properties of K2Ti6O13in visible-light region.
[1]A.Fujishima and K.Honda,Nature 238,37(1972).
[2]M.R.Hoffmann,S.T.Martin,W.Choi,and D.W.Bahnemann,Chem.Rev.95,69(1995).
[3]M.D.Bhatt and J.S.Lee,J.Mater.Chem.3,10632(2015).
[4]Z.Zhao and Q.Liu,J.Phys.D:Appl.Phys.41,025105(2007).
[5]Z.Liu,J.Zhang,Y.Lv,X.Zhou,and S.Li,J.Alloys Compd.700,1(2017).
[6]G.Yang,T.Xiao,J.Sloan,G.Li,and Z.Yan,Chem.Eur.J.17,1096(2011).
[7]H.Fujii,K.Inata,M.Ohtaki,K.Eguchi,and H.Arai,J.Mater.Sci.36,527(2001).
[8]M.Anpo and M.Takeuchi,J.Catal.216,505(2003).
[9]R.Abe,J.Photochem.Photobiol.C:Photochem.Rev.11,179(2010).
[10]S.Ouyang,T.Hua,N.Umezawa,J.Cao,L.Peng,Y.Bi,Y.Zhang,and J.Ye,J.Am.Chem.Soc.134,1974(2012).
[11]Y.Zhang,A.Thomas,M.Antonietti,and X.Wang,J.Am.Chem.Soc.131,50(2009).
[12]K.Shankar,K.Chhay Tep,G.K.Mor,and C.A.Grimes,J.Phys.D:Appl.Phys.39,2361(2006).
[13]H.R.Rajabi and M.Farsi,J.Mol.Catal.A:Chem.399,53(2015).
[14]K.Yang,D.F.Li,W.Q.Huang,L.Xu,G.F.Huang,and S.Wen,Appl.Phys.A 123,96(2017).
[15]Y.Wang,R.Zhang,J.Li,L.Li,and S.Lin,Nanoscale Res.Lett.9,46(2014).
[16]G.Shao,J.Phys.Chem.C 112,18677(2008).
[17]L.K.Zhang,B.Wu,M.Wang,L.Chen,G.X.Ye,T.Chen,H.L.Liu,C.R.Huang,and J.L.Li,Adv.Mater.Res.399,1789(2012).
[18]C.D.Valentin,G.Pacchioni,H.Onishi,and A.Kudo,Chem.Phys.Lett.469,166(2009).
[19]Y.F.Zhao,C.Li,S.Lu,L.J.Yan,Y.Y.Gong,L.Y.Niu,and X.J.Liu,Chem.Phys.Lett.647,36(2016).
[20]H.K.Lee,J.P.Shim,M.J.Shim,S.W.Kim,and J.S.Lee,Mater.Chem.Phys.45,243(1996).
[21]D.Kapusuz,Y.E.Kalay,J.Park,and A.Ozturk,J.Ceram.Process.Res.16,291(2015).
[22]Y.Li,H.Yu,Y.Yang,F.Zheng,H.Ni,M.Zhang,and M.Guo,Ceram.Int.42,11294(2016).
[23]J.Xie,X.Lu,Y.Zhu,C.Liu,N.Bao,and X.Feng,J.Mater.Sci.38,3641(2003).
[24]M.A.Siddiqui,V.S.Chandel,M.Shariq,and A.Azam,J.Mater.Sci.Mater.Electron.24,4725(2013).
[25]B.L.Wang,Q.Chen,R.H.Wang,and L.M.Peng,Chem.Phys.Lett.376,726(2003).
[26]M.A.Siddiqui,V.S.Chandel,and A.Azam,Appl.Surf.Sci.258,7354(2012).
[27]X.Meng,D.Wang,J.Liu,B.Lin,and Z.Fu,Solid State Commun.137,146(2006).
[28]M.Pescatori and C.Quondamcarlo,Chem.Phys.Lett.376,726(2003).
[29]H.Yoshida,M.Takeuchi,M.Sato,L.Zhang,T.Teshima,and M.G.Chaskar,Catal.Today 232,158(2014).
[30]G.H.Du,Q.Chen,P.D.Han,Y.Yu,and L.M.Peng,Phys.Rev.B 67,106(2003).
[31]J.Zhu,F.Chen,J.Zhang,H.Chen,and M.Anpo,J.Photochem.Photobiol.,A:Chem.180,196(2006).
[32]G.Impellizzeri,V.Scuderi,L.Romano,P.M.Sberna,E.Arcadipane,R.Sanz,M.Scuderi,G.Nicotra,M.Bayle,and R.Carles,J.Appl.Phys.116,37(2014).
[33]L.Z.Qin,H.Liang,B.Liao,A.D.Liu,X.Y.Wu,and J.Sun,Nucl.Instrum.Methods Phys.Res.Sect.A 307,385(2013).
[34]J.Yu,Q.Xiang,and M.Zhou,J.Phys.Chem.B 90,595(2009).
[35]T.Murase,H.Irie,and K.Hashimoto,J.Phys.Chem.B 109,13420(2005).
[36]M.J.Nalbandian,M.Zhang,J.Sanchez,S.Kim,Y.H.Choa,D.M.Cwiertny,and N.V.Myung,J.Hazard.Mater.299,141(2015).
[37]M.Guo and J.Du,Physica B:Condens.Matter 407,1003(2012).
[38]Z.Li,W.Shen,W.He,and X.Zu,J.Hazard.Mater.155,590(2008).
[39]K.Zhang,X.Wang,X.Guo,T.He,and Y.Feng,J.Nanopart.Res.16,2246(2014).
[40]M.R.Bayati,M.Aminzare,R.Molaei,and S.K.Sadrnezhaad,Mater.Lett.65,840(2011).
[41]P.J.D.Lindan,J.Phys.:Condens.Matter 14,2717(2002).
[42]H.J.Monkhorst and J.D.Pack,Phys.Rev.B 13,5188(1976).
[43]R.W.Godby,M.Schlüter,and L.J.Sham,Phys.Rev.B 37,10159(1988).
[44]S.Andersson and A.D.Wadsley,Acta Cryst.15,194(1962).
[45]M.Hua and Y.Li,C.Long,and L.Xia,Physica B:Condens.Matter 407,2811(2012).
[46]C.Stampfl and C.G.V.D.Walle,Phys.Rev.B:Condens.Matter 59,5521(1999).
[47]J.P.Perdew and M.Levy,Phys.Rev.Lett.51,1884(1983).
杂志排行

CHINESE JOURNAL OF CHEMICAL PHYSICS的其它文章
- A High-Performance and Flexible Chemical Structure&Data Search Engine Built on CouchDB&ElasticSearch
- Electronic Structures and Optical Properties of Ga Doped Single-Layer Indium Nitride
- Maximum Thermodynamic Electrical Efficiency of Fuel Cell System and Results for Hydrogen,Methane,and Propane Fuels
- Nucleation of Boron-Nitrogen on Transition Metal Surface:A First-Principles Investigation
- Non-Adiabatic Molecular Dynamics Simulations of Non-Charge-Transfer and Charge-Transfer Scattering in H++CO2at ELab=30 eV
- A Double Network Hydrogel with High Mechanical Strength and Shape Memory Properties