Different Frequency Synchronization Theory and Its Frequency Measurement Practice Teaching Innovation Based on Lissajous Figure Method
2018-06-15XinGengSonglinLiGuangmingHuangBaoqiangDuandJianhuaChenSchoolofElectronicInformationEngineeringZhengzhouUniversityofLightIndustryZhengzhou45000ChinaScienceandTechnologyonElectronicInformationControlLaboratoryChengdu60036Ch
Xin Geng, Songlin Li, Guangming Huang, Baoqiang Du, and Jianhua Chen(.School of Electronic Information Engineering, Zhengzhou University of Light Industry, Zhengzhou 45000, China; .Science and Technology on Electronic Information Control Laboratory, Chengdu 60036, China)
So-called synchronization, from the point of view of time, is that some strict and specific relationships between the frequency standard signal and the measured signal are maintained in time or phase. In other words, the time difference or phase difference between the frequency standard signal and the measured signal stays the same for a long period in the course of phase comparison. However, from the point of view of frequency, a strict proportional relationship between the frequency standard signal and the measured signal is maintained in frequency. The synchronization precision, an important performance index that measures the level of synchronization technology, does not influence the physical realization of synchronization in practical application. The physical meaning of synchronization lies in the precise transmission of the stability and accuracy from the frequency standard signal to the measured signal. Therefore, the first of the synchronization precision depends on the stability and accuracy of the frequency standard signal, and the second depends on the phase difference measurement method used by two comparison signals. The higher the measurement resolution is, the higher synchronization precision is. For that reason, Jozef Kalisz achieves a phase difference measurement method with 100 ps resolution by using high frequency pulse to fill phase differences between two comparison signals[1]. However, Klepacki. K implements the measurement resolution better than 7.5 ps by the improvement of the method[2]. The method has the advantages of wide measurement range, high measurement linearity and low cost, but there is ±1 word counting error in the process of measurement. The measurement resolution is limited by the filling pulse frequency. Markovic B and KwangSeok Kim developed a phase difference measurement method with 1ps resolution by measuring the digital voltage signal converted by the measured phase difference signal[3-4]. The method has the advantages of wide measurement range and easy integration, but its measurement resolution is limited by conversion rate and number of digital signals. Ambrosini R. obtains a phase difference measurement method by phase coincidence detection between two comparison signals[5]. The method has the higher measurement resolution, but the used phase comparison signals must be the same frequency. For the phase comparison between different frequencies’ signals, the method must have a complex frequency conversion process, such as mixing and frequency doubling for frequency normalization, which add the cost of development, introduce the additional noise of the synthetic lines and limit its wide application. Using common frequency sources, Moreira Pedro realized a high-resolution difference measurement method by measuring zero-crossing time difference of two beat signals based on double mixing[6-7]. The method is now the best phase difference measurement method with ultra-high resolution and most commonly use internationally. However, the measurement accuracy of the method is limited by the noise of the amplifier and mixer. The noise has a great influence on the improvement of measurement precision, which put forwards the higher request to the noise index of each part of the measurement equipment.
The traditional frequency measurement method is established on the basis of pulse counting and has two main defects. It is limited by filling pulse frequency and it has ±1 word counting error[8-9]. In order to overcome these defects and improve the measurement accuracy, the more popular approach is the comprehensive use of various frequency measurement methods internationally[10-11]. For example, by combining the analog interpolation method and the time vernier method, the ±1 word counting error is reduced to about 1/1 000 and the measurement accuracy is improved to picosecond level. However, it has complex circuit design and high equipment cost, which limits its wide application.
1 Different Frequency Synchronization Technology
Lissajous figure idea was proposed by professor Lissajous, a famous mathematician from France, in 1855. It is not only a characterization of the direct phase comparison, but also a direct reflection of frequency relation between two different frequencies signals. The phase synchronization condition can be accurately judged by the change characteristics of the Lissajous figure or the frequency relation between two different frequencies signals. It can not only demonstrate frequency control between any signals, but also embody the transfer precision of frequency accuracy and stability from the standard signal to the measured signal[12-14].
Supposing there are two periodic signals with high stability, (Tx,Ty)=(mxTmaxc,myTmaxc)=Tmaxc, where both themxand themyare positive integers greater than zero, and theTmaxcis called the maximum common factor period between the signalsTxandTy. The signalsTxandTyare sent to the first channel of digital oscilloscope,Xinput, horizontal direction, and the second channel of digital oscilloscope,Yinput, vertical direction, respectively. The produced Lissajous figure is static on the oscilloscope as shown in Fig.1, where the frequencies of the signalsTxandTyare 6 MHz and 10 MHz, respectively, and the round red dots in Fig.1 represent the horizontal and vertical inflection point of the Lissajous figure.
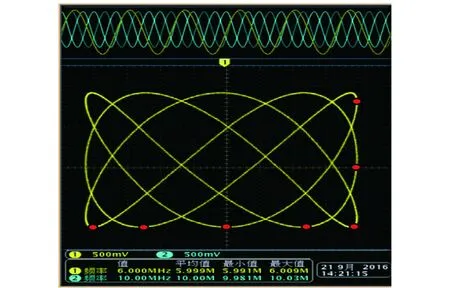
Fig.1 Lissajous figure on the oscilloscope
The static Lissajous figure on the oscilloscope from Fig.1 embodies a strict proportional relationship which is maintained between the signalsTxandTy. This is written as
(1)
myTx=mxTy
(2)
wherenis the proportion coefficient, namely rational number value. IfTxis the measured signal andTyis the reference signal,nis the ratio between the reference frequency and the nominal frequency of the measured signal. So the signalsTxandTyare strict synchronization atmyTxormxTyintervals, wheremyTxormxTyis called different frequency synchronization periodTDP, written as
TDP=mxTy=myTx|Tx=mxTmaxc,Ty=myTmaxc=
mxmyTmaxc
(3)
It can be seen from Eq.(3) that the different synchronization periodTDPis equal to the least common multiple periodTmincbetween the signalsTxandTy. That is to say,
TDP=Tminc=mxmyTmaxc
(4)
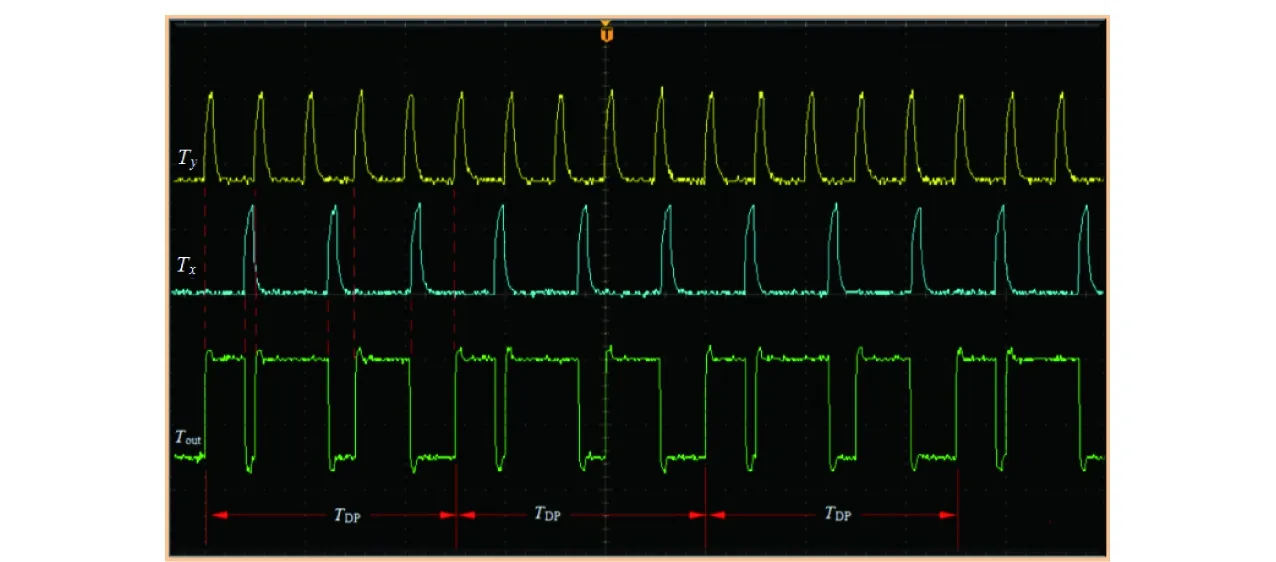
Fig.2 Different frequency synchronization with zero initial phase difference
The phase comparison and its characteristics between the signalsTxandTyare shown in Fig.2. It has a strict correspondence to the Lissajous figure in Fig.1. It can be seen from Fig.2 that a new periodic signalTDPis formed due to the synchronization between the signalsTxandTy. The period ofTDPis just the least common multiple periodTminc. Its frequencyfmaxcis
在煤矿通风监控系统中,通信协议的不统一不但会使得相关人员不能随意地对系统进行升级或是改造,而且还会导致系统配套受制于人、设备重复购置的情况发生,因此国家应统一煤矿通风监控系统的通信协议,采用统一化的SQL数据库和数据格式,从而为系统的升级和改造提供便利,同时也有利于系统的资源共享,更好地实现对通风监控系统的管理。
(5)
wherefmincis called the least common multiple frequency. By Eq.(5),
fminc=mxmyfmaxc
(6)
Thefmincreflects the change frequency of phase difference between the signalsTxandTyand the detailed degree of the quantized phase difference in the different frequency phase processing. Its reciprocal is called measurement resolution that represents the least measurement error achieved by digital phase comparison. This is written as
(7)
Tmaxcis not only the basis of digital phase processing, but also the link from analog signal processing to digital signal processing.
From Fig.1, the horizontal inflection point number of the Lissajous figure is equal tomxand the vertical inflection point number is equal tomy. Supposing thatTxis the measured signal andTyis reference signal, then the proportion coefficientncan be calculated by Eq.(1). The period and frequency of the measured signal can be obtained by
fx=1/Tx=1/(nTy)
(8)
The phase difference at the synchronization point or the different frequency synchronization periodTDPis zero due to the synchronization between the signalsTxandTy. Due to the complexity of the actual phase comparison situation or the external disturbance or the characteristics of various application fields, the measured signalTxis susceptible to noise. Therefore, it is difficult to maintain a strict proportion for the signalsTxandTy. The phase difference in the synchronization point is a function of time. The variation rate of the phase difference, the first derivative of the phase difference function, is the difference Δfbetween the actual frequency and the nominal frequency of the measured signal. It is mainly presented as a regular turn of the Lissajous figure embodied on the oscilloscope. The regular turn of the Lissajous figure can be used for frequency standard comparison and frequency measurement. Aiming at the turn-Lissajous figure, the nominal frequency of the measured signal can be accurately calculated using Eq.(8). Δfis obtained by the turning periodτof the Lissajous figure. AssumingTxis the measured signal andTyis reference signal, the maximum value of a phase change of the signalTxis equal to a turning period of the Lissajous figure. When the signalsTxandTyreach the synchronization point, the Lissajous figure changes themxtimes in full period. The change period of phase difference of the signalTxis equal to themxτ. Its reciprocal is just the Δf. This is written as
Δf=1/(mxτ)
(9)
From Eq.(9), as long as the turning period of the Lissajous figure is measured by the oscilloscope, the frequency offset between the measured signal and its nominal signal can be calculated. So the actual frequency of the measured signalf′xis
f′x=fx±Δf
(10)
where the symbol “±” that is determined by observing the movement direction of the measured signal waveform on the oscilloscope represents the phase relationship between the measured signal and the reference signal. When the waveform of the measured signal moves to the right, the advance of the phase is indicated and the symbol “+” is selected. When the waveform of the measured signal moves to the left, the hysteresis of the phase is indicated and the symbol “-” is selected.
The above frequency comparison and frequency measurement are used based on the signalsTxandTywith zero initial phase. That is to say, the two periodic signals sent to the first and second channel on the oscilloscope are from the same frequency source and have the same time base. The phase noise, time offset of zero crossing, generated by the frequency source itself has the same influence on the two comparison signals. However, the measured signal and the reference signal are often from different frequency sources in practical frequency measurement. The phase comparison often occurs between the reference signal from the same frequency source and the measured signal from a different frequency source. Using Lissajous figure method to measure frequency, the time base or initial phase difference of two comparison signals is often different. In spite of this, it does not affect the frequency measurement based on different frequency synchronization technology as shown in Fig.3.
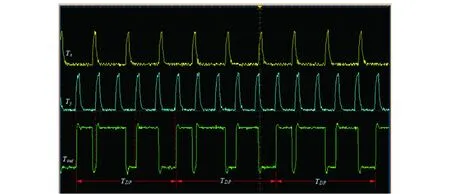
Fig.3 Different frequency synchronization with initial phase difference
The phase synchronization between different frequencies signals from different frequency source is shown in Fig.3. The initial phase difference between them is not zero and the nominal frequencies of the signalsTxandTyis 6 MHz and 10 MHz, respectively. The measured signalTxand the reference signalTyare sent to the first channel of digital oscilloscope,Xinput, horizontal direction, and the second channel of digital oscilloscope,Yinput, vertical direction, respectively. The produced outline of the Lissajous figure is the same as that of Fig.1. The difference is that the Lissajous figure is not static but has a cyclical turn. The shape of Lissajous figure and the formed mesh number is only determined by the period relationship between two comparison signals or the proportion coefficientn. These have nothing to do with the turn of the Lissajous figure.
According to the horizontal inflection point and the vertical inflection point in Fig.1, the mesh numberNof the Lissajous figure can also be calculated by
N=mxmy+(mx-1)(my-1)
(11)
TheNalso reflects the frequencies relationships between the reference signal and the measured signal.
The nominal frequencyfnxof the measured signal can be calculated by Eq.(1). The static Lissajous figure is generated by the strict synchronization between the signalsTxandTy, so the calculated frequency is not the actual frequencyf′x, but the nominal frequencyfnx. The turn of the Lissajous figure shows that there is a frequency offset Δfxbetween thef′xand thefnx. When the reference signal is used as the measured signal, but the measured signal is used as the reference signal, the frequency offset Δfybetween the actual frequency and the nominal frequency of the reference signal has a fixed proportion relation with the frequency offset Δfx. That is to say
Δfy/Δfx=mx/my=n
(12)
Therefore, the frequency offset Δfxcan be obtained from Eq.(12). That is to say
(13)
If the reference signal is used as the measured signal, but the measured signal is used as the reference signal, the Lissajous figure is static on the oscilloscope by adjusting the frequency of the reference signal. That results in the same time base or the initial phase difference between the two comparison signals and the actual frequency difference between the two signals is lost. The difference between the reference frequency and the display frequency on the reference source is just the frequency offset Δfy. So the precise measurement of the measured frequency can be achieved by
f′x=fnx+Δfx
(14)
The Lissajous figure method for frequency measurement is completely based on different frequency phase synchronization principle.Compared to the traditional frequency measurement principle based on phase processing, the principle can directly complete the phase comparison and frequency measurement between any frequency signals in radio frequency range without complex frequency normalization circuits, mixing and frequency synthesis and transformation. The following experiments can prove the superiority of the principle.
2 Experiment Results and Its Analysis
The main technical route of the frequency measurement based on different synchronizationtechnology is as follows: First, the measured signal and the reference signal are sent to the first channel,Xinput, horizontal direction, and the second channel,Yinput, vertical direction of the DPO4104B digital oscilloscope (1 GHz bandwidth, 5 GS/s sampling rate), respectively. Second, using the “acquire” button on the oscilloscope, the Lissajous figure are displayed inXYdisplay and high resolution mode respectively. Third, the horizontal and vertical inflection point is found by observing the outline of the Lissajous figure in order to calculate proportional coefficientn. Finally, the turn periodτof the Lissajous figure and the frequency offset Δfyare calculated in order to obtain the frequency and accuracy of the measured signal. The frequency measurement experiment scheme designed by the technical route is shown in Fig.4.

Fig.4 Experimental scheme of frequency measurement
2.1 Frequency measurement with the same frequency source
Both the reference signal and the measured signal are derived from the KEYSIGHT E8663D signal generator in this experiment, where the reference frequency is 10 MHz. The specific experimental results are shown in Tab.1.
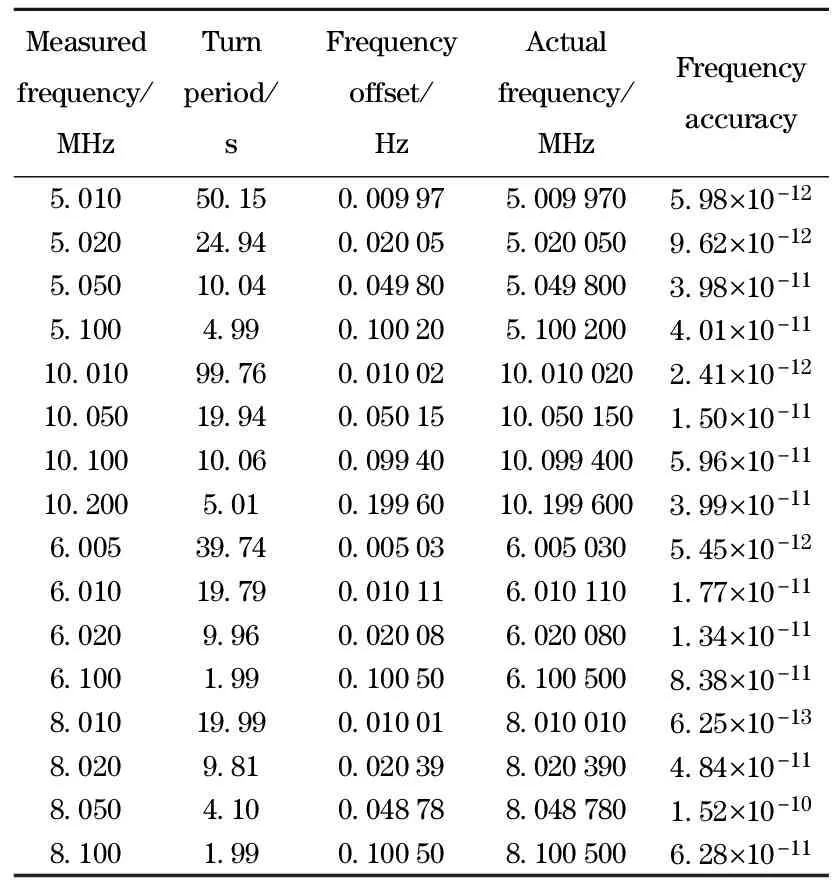
Tab.1 Experiment results with the same frequency source
From Tab.1, the analysis of the experiment is as follows. First, there is a small error between the measurement value and theory value of turn period. For example, when the frequency offset of 5 MHz is 0.01 Hz, the measurement value of the turn period is 50.15 s, but the theory calculation value by Eq.(9) is 50 s. There is a 0.15 s error between them. The main reason for this error is timing action of observation. Besides, the turning speed of the Lissajous figure is also a main factor contributing to the measurement error of turn period. Artificial timing is often difficult in keeping up with the fast turning of the Lissajous figure and this leads to measurement error. When the Lissajous figure method is used as frequency measurement, the frequency offset less than 2 Hz frequency is the most suitable. Second, when the frequency ratio between the reference signal and the measured signal is constant, the measured frequency is the same as its nominal frequency. For example, the measured nominal frequency is 5 MHz and the actual measured frequency is also 5 MHz, so the frequency offset between them is zero. However, When the measured has a small frequency offset, there is an error between the measured nominal frequency and the actual measured frequency. The obtained frequency accuracy is better than 1×10-11. However, with the gradual increase of the small deviation of the measured frequency, the turn of the Lissajous figure becomes quicker and the frequency accuracy is decreased. Therefore, although there are some limitations in accuracy requirements by using the Lissajous figure method to measure frequency, there is a great practicability for the coarse measurement of frequency.
2.2 Frequency measurement with different frequency source
In this experiment, the reference frequency is 10 MHz caused by KEYSIGHT E8663D signal generator and the frequencies of the measured signal are produced by Agilent 8664A frequency synthesizer. The specific experimental results are shown in Tab.2.
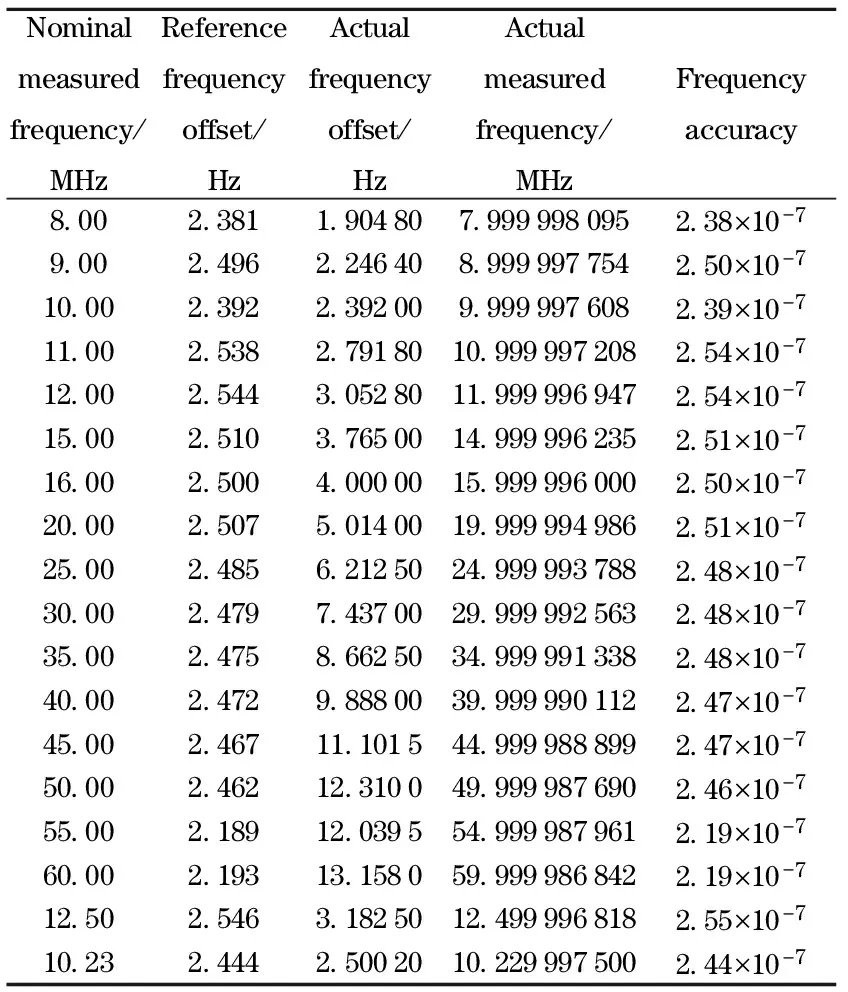
Tab.2 Experiment results with different frequency source
It is necessary to combine theoretical calculation to obtain the measured frequency and its accuracy by using the measurement method with the same frequency source in Tab.1. However, it can be seen from Tab.2 that, the operation of frequency measurement based on the Lissajous figure method is more simple and convenient, and the frequency accuracy of the measured signal can reach 10-7order of magnitude. For the measurement of integer frequency, the method is simpler, more convenient and effective than the traditional frequency measurement method, but for the measurement of the nominal measured frequency with frequency offset, such as 10.23 MHz, 12.5 MHz and so on, it is slow in measurement speed, and the effect of measurement is not good. The main reason is that the formed Lissajous figure is complex, its turning speed is quick and the adjustment of the reference frequency for the stable Lissajous figure needs some time.
3 Conclusion
By the analysis of the characteristics of the Lissajous figure on the oscilloscope, the method of frequency measurement based on Lissajous figure is studied and the technology of phase synchronization between different frequenies signals is proposed. When the Lissajous figure is static on the oscilloscope, the two compared signals are in strict synchronization for the interval of the least common multiple period. When there is a small frequency offset between the two comparison signals, the Lissajous figure has a regular turn. The turning period of the several inflection point times is the group period between two comparison signals[15-18]. The two compared signals are in strict phase coincidence for the interval of the group period. It is the frequency measurement and comparison for the time gate of group period that effectively solves the ±1 word count error in the traditional frequency measurement and frequency standard comparison method. Therefore, it has a wide range of applications in electronic information, communication, metrology, astronomy, radar, timing, location, time and frequency transmission, precise measurement physics and other high-tech fields.
[1] Kalisz J, Szplet R, Pelka R, et al. Single-chip interpolating time counter with 200-ps resolution and 43-s range[J]. IEEE Transactions on Instrument and Measurement, 1997,49(4): 851-856.
[2] Klepacki K, Szplet R, Pelka R. A 7.5ps single-shot precision integrated time counter with segmented delay line[J]. Review of Scientific Instruments, 2014,85(3): 0347031-0347039.
[3] Markovic B, Tisa S. A high-linearity, 17ps precision time-to-digital converter based on a single-stage vernier delay loop fine interpolation[J]. IEEE Transactions on Circuits and Systems I: Regular Papers, 2013,60(3):557-569.
[4] Kim KwangSeok, Yu Wonsik, Cho SeongHwan. A 9 bit, 1.12 ps resolution 2.5 b/stage pipelined time-to-digital converter in 65 nm CMOS using time-register[J]. IEEE Journal of Solid-State Circuits, 2014,49(4): 1007-1016.
[5] Yang Jong-Ryul. Measurement of amplitude and phase differences between two RF signals by using signal power detection[J]. IEEE Microwave and Wireless Components Letters, 2014, 24(3):206-208.
[6] Dong Shaofeng, Du Baoqiang, Zhou Wei. New design of high-precision oven controlled crystal oscillator[J]. Journal of Beijing Institute of Technology, 2012, 21(3):362-369.
[7] Yanagimachi S, Takamizawa A. Dual-mixer time-difference measurement system using discrete Fourier transformation[C]∥European Frequency and Time Forum & International Frequency Control Symposium, Prague,2013.
[8] Maria Salome Perez, Enrique Carrera. Time synchronization in arduino-based wireless sensor networks[J]. IEEE Latin America Transactions, 2015, 23(2):455-461.
[9] Wang Heng, Zeng Haiyong. Linear estimation of clock frequency offset for time synchronization based on overhearing in wireless sensor networks[J]. IEEE Communications Letters, 2016, 20(2):288-291.
[10] Guo Yi, Liu Guang. A new time and frequency synchronization scheme for OFDM-based cooperative systems[C]∥IEEE Long Island Systems, Applications and Technology Conference, Farmingdale, 2014.
[11] Xu Kui, Xu Youyun. Time and frequency synchronization for multicarrier transmission on hexagonal time-frequency lattice[J]. IEEE Transactions on Signal Processing, 2013, 61(24):6204-6219.
[12] Du Baoqiang, Zuo Dongyao, Feng Dazheng, et al. Precise frequency linking method based on phase group synchronization, measurememt, 2015, 62(2):222-229.
[13] Du Baoqiang, Dong Shaofeng, Wang Yanfeng, et al. High resolution frequency measurement method with a wide-frequency range based on quantized phase step law[J]. IEEE Transactions on Ultrasonics, Ferroelectrics and Frequency Control, 2013, 60(11):2237-2243.
[14] Du Baoqiang, Shi Linlin, Yang Zhigang, et al. Phase group synchronization between any signals and its physical characteristics[J]. Science China Physics, Mechanics & Astronomy,2014, 57(4): 674-679.
[15] Du Baoqiang, Wang Yanfeng, Guo Shuting, et al. Ultra resolution phase comparison method combining phase synchronous detection and common frequency source[J]. Measurement, 2014,46(1):374-377.
[16] Du Baoqiang, Dong Shaofeng, Wang Yanfeng, et al. Quantized phase step law based different frequency signals and its characteristics[J]. Chinese Journal of Electronics, 2013, 22(3):621-626.
[17] Du Baoqiang, Wang Yanfeng, Cui Guangzhao, et al. High precision time and frequency measurement method combining time-space conversion and different frequency phase detection[J]. Science China Physics, Mechanics & Astronomy, 2013, 56(11):2110-2115.
[18] Du Baoqiang, Feng Dazheng, Tang Yaohua, et al.High-resolution group quantization phase processing method in radio frequency measurement range[J]. Scientific Reports, 2016(6):1-14.
猜你喜欢
杂志排行

Journal of Beijing Institute of Technology的其它文章
- Dynamic Mechanical Characteristics and Damage Evolution Model of Granite
- Combustion Properties of Metal Particles as Components of Modified Double-Base Propellants
- Optimization of Crosswalk Width Based on Bi-Directional Pedestrian Crossing Time at Signalized Intersections
- Efficient Activation Method of Hardware Trojan Based on Greedy Algorithm
- Estimation of Thermal Imaging System Operating Range Based on Background Radiation
- Network Sorting Algorithm of Multi-Frequency Signal with Adaptive SNR