Optimization of Crosswalk Width Based on Bi-Directional Pedestrian Crossing Time at Signalized Intersections
2018-06-15NingboCaoYonghengChenZhaoweiQuLiyingZhaoYanfeiLiandQiujieYangCollegeofTransportationJilinUniversityChangchun300ChinaTianjinTransportationResearchInstituteTianjin300074China
Ningbo Cao, Yongheng Chen,, Zhaowei Qu, Liying Zhao, Yanfei Li and Qiujie Yang(.College of Transportation, Jilin University, Changchun 300, China; .Tianjin Transportation Research Institute, Tianjin 300074, China)
A reasonable crosswalk width can guarantee the safety of pedestrians and improve the crossing efficiency of pedestrians. Crosswalk width depends primarily on the pedestrian volume and given pedestrian green time. However, existing manuals have not provided accurate methods to estimate required crosswalk width according to different pedestrian volumes, given pedestrian green time and level of service. So, many unreasonable crosswalk designs are applied around the world. Too wide or too narrow crosswalks exist at many intersections in China. So, it is necessary to develop an accurate method to direct planners and designers with required crosswalk widths under different traffic conditions.
Manuals on Road traffic signs and markings in China suggest a minimum crosswalk width of 3 m. The crosswalk width can be widened 1 m every time according to pedestrian volumes[1]. However, the effectiveness and rationality of these rough recommendations for crosswalk widths at different pedestrian volumes have not been verified. To establish a model to estimate the required crosswalk width indifferent situations, the influence of bi-directional pedestrians should be taken into consideration. The effects of interactions between bi-direction pedestrians on the crossing time and crosswalk width are seldom considered. Most existing estimation models of crosswalk width and crossing time are only based on pedestrian volume and assumed start-up delay. As described in the Pedestrian chapter of Highway Capacity Manual (HCM)[2], the total crossing time is independent from the pedestrian volume and crosswalk width. Furthermore, a total crossing time model of unidirectional pedestrians at crosswalk is presented in the Pedestrian and Bicycle Concepts chapter of the HCM[2]. And, the effects of bi-directional pedestrians on the total crossing time are still ignored. Based on the model of HCM[2], Golani et al.[3]proposed a modified total crossing time model which has considered start-up lost time, average walking speed and the influence of bi-directional pedestrian. The developed model was validated, but the interaction of bi-directional pedestrians was not modeled effectivity. Lam et al.[4]pointed out that the average speed and capacity of a pedestrian flow are significantly influenced by bi-directional ratios. However, the effects of crosswalk width on the pedestrian average speed and capacity were ignored. Alhajyaseen et al.[5]investigated the effects of bi-directional flow ratios on the maximum pedestrian flow of crosswalks. In the study of Marisamynathan et al.[6],the total crossing delay was divided into a waiting and a crossing delay according to the crossing process, and finally the total crossing delay and total crossing time were modeled. Zhang et al.[7]analyzed the impacts of crosswalk width and signal time on the crossing speed, and developed a crossing time model. Zhao et al.[8]proposed a crossing time model that contains the time model for pedestrian crossing waiting area and the time model for pedestrian crossing crosswalk. Alhajyaseen et al.[9]divided the total crossing time into a discharge time and a crossing time. They modeled discharge time by using the traffic wave theory. Then, drag force theory was applied to establish the crossing time model. The proposed models were proved to be effective. However, the interaction between bi-directional pedestrians keeps the same from the moment when they meet each other to the end of pedestrian crossing, and so the decelerations of bi-directional pedestrians were assumed as fixed value. In reality, both interactions between bi-directional pedestrians and decelerations change with time.
In summary, these models cannot explain the complex interactions between bi-directional pedestrians and built relationship among required crosswalk width, pedestrian volumes, green time and level of service. The paper aims to propose a crossing time model by solving these problems. Based on the proposed model, we proposed a designing crosswalk width criterion for different pedestrian volumes, given pedestrian green time and level of service.
1 Data Collection
Series of traffic data were collected by using video processing technology at seven crosswalks with different geometric characteristics, pedestrian volumes and traffic environments. The software based on video image processing system was applied to extract pedestrian spatial-temporal data. Based on pedestrian spatial-temporal data, the pedestrian interaction distances and time were acquired.In order to study the influences of different factors on pedestrians interaction distances and time, seven crosswalks of four signalized intersections were chosen as the study sites in Changchun in China.The geometric characteristics and sample size of pedestrians at seven surveyed crosswalks are shown in Tab.1. There were sufficient pedestrian crossing data to enable a thorough analysis of pedestrians crossing motion.
2 Development of Crossing Time Model
Inspired by the crossing model proposed by Alhajyaseen model[9], here we introduce it briefly. Discharge timeTdand crossing timeTcmake up the crossing time.Tdrepresents the time from the first waiting pedestrian stepping into the crosswalk to the last waiting pedestrian stepping into the crosswalk.Tcis the necessary time to cross the crosswalk.

Tab.1 Geometric characteristic of study sites
2.1 Discharge time model
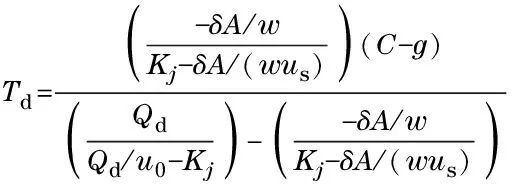
Pedestrian arriving and discharging mechanism is shown in Fig.1.Tdis determined by pedestrian arrival rate, red interval, waiting position distribution and crosswalk width. Shockwave theory is adopted to model waiting pedestrian queue discharge time. Start-up lost timeIis included inTd. Pedestrians are assumed to arrive in a unit of “pedestrian row” per second. Longitudinal distanceDbetween waiting pedestrians is assumed to be constant. By utilizing shockwave theory, the discharge time needed for the pedestrians in the longest queue to step into crosswalk can be expressed as

Fig.1 Pedestrian arriving and discharging mechanism
(1)
where,Arepresents pedestrian arrival rate (ped/s), and it is assumed to be uniform;δrepresents lateral distance (m) of pedestrian space;Crepresents cycle length (s);grepresents pedestrian green interval (s);Qdrepresents pedestrian discharge rate (ped/s);Kjrepresents jam density (ped/m2);usrepresents average speed of arriving pedestrians (m/s);u0represents average speed of discharge pedestrians (m/s);wrepresents the crosswalk width (m).
2.2 Modeling crossing time
In the crossing time model of Alhajyaseen[9], pedestrians are assumed to be a spherical object moving into a fluid (object pedestrians). We focus on developing a crossing time model in this paper. A discharge time model are kept the same with the model shown in Eq.(1). The resistance acting on the subject pedestrian is called drag force. When the subject and object pedestrians meet each other, resistance from the object pedestrian flow will arise. Drag force theory was proposed by Pugh[11-12]in which the drag force was expressed as
(2)
whereDis the drag force (kg·m/s2),Cdis the drag coefficient, andApis cross-sectional area (m2),ρis the density of the fluid (kg/m3),uis the speed of the subject relative to the fluid (m/s).
A drag force contains a form drag and a skin friction related to the shape of the moving object. The drag force fields of moving objects with different shapes are shown in Fig.2.

Fig.2 Drag forces of moving objects of different shapes
The subject pedestrians are assumed to be spherical by Alhajyaseen[10], and the drag force acting upon them is shown in Fig.2b. This assumption has one shortcoming. The drag force will stay the same because it is determined by the cross-sectional areaAp.Apis calculated by
Ap≈βn
(3)
whereApis the cross-sectional area of one subject pedestrian flow (m2),βrepresents the average width of one pedestrian,nis the number of subject pedestrians.
Alhajyaseen assumed that subject pedestrians move in the object pedestrian flow (fluid) alone without considering the group characteristics of pedestrians. In fact, a bi-directional pedestrian flow will form “lanes” when they meet each other, and pedestrians will follow the front pedestrians in the same “lane”, which means that pedestrians cross each other like a team. Thus, the shape of the subject pedestrians looks more like a cylindrical, and the drag force is as shown in Fig.2a. For cylindrical shapes, the drag force equals the skin friction, and the skin friction increases progressively as the contact areaApincreases. The drag force acting upon the subject pedestrians changes over time rather than stay the same. So, the decelerations of subject pedestrians change over time rather than staying the same. Thus, the crossing time model needs to be modified so as to mimic the reality.To use the drag force theory to model the interactions between bi-directional pedestrians, three assumptions are made as follows.
① Before the bi-directional pedestrians meet each other, the speeds of pedestrians are assumed to be the free-flow speedv0, and the relative speed becomes
u=v1-(-v2)=v0+v0=2v0
(4)
wherev1is speed of subject pedestrians (m/s);v2is speed of opposite pedestrians (m/s).
②Apin Eq.(3) represents contact area, and it is proportional to the interaction lengthl. SoApcan be replaced withl.
③ Object and subject pedestrians are regarded as fluid and moving bodies respectively. The density of fluid can be calculated by
(5)
wherewis the crosswalk width (m),N2is the number of object pedestrians, andliis the maximum interaction length (m), as shown in Fig.3c.
After substituting Eqs.(4)(5) into Eq.(3), the drag force formula becomes
(6)
whereCadjis the adjusted drag coefficient, expressed as
Cadj=4Cd
(7)
Fig.3 illustrates the process for bi-directional pedestrians crossing a crosswalk. Our proposed model focus on calculate the time from momentbto momentdshown in Fig.3.
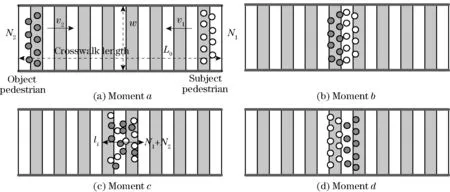
Fig.3 Process for bi-directional pedestrians crossing
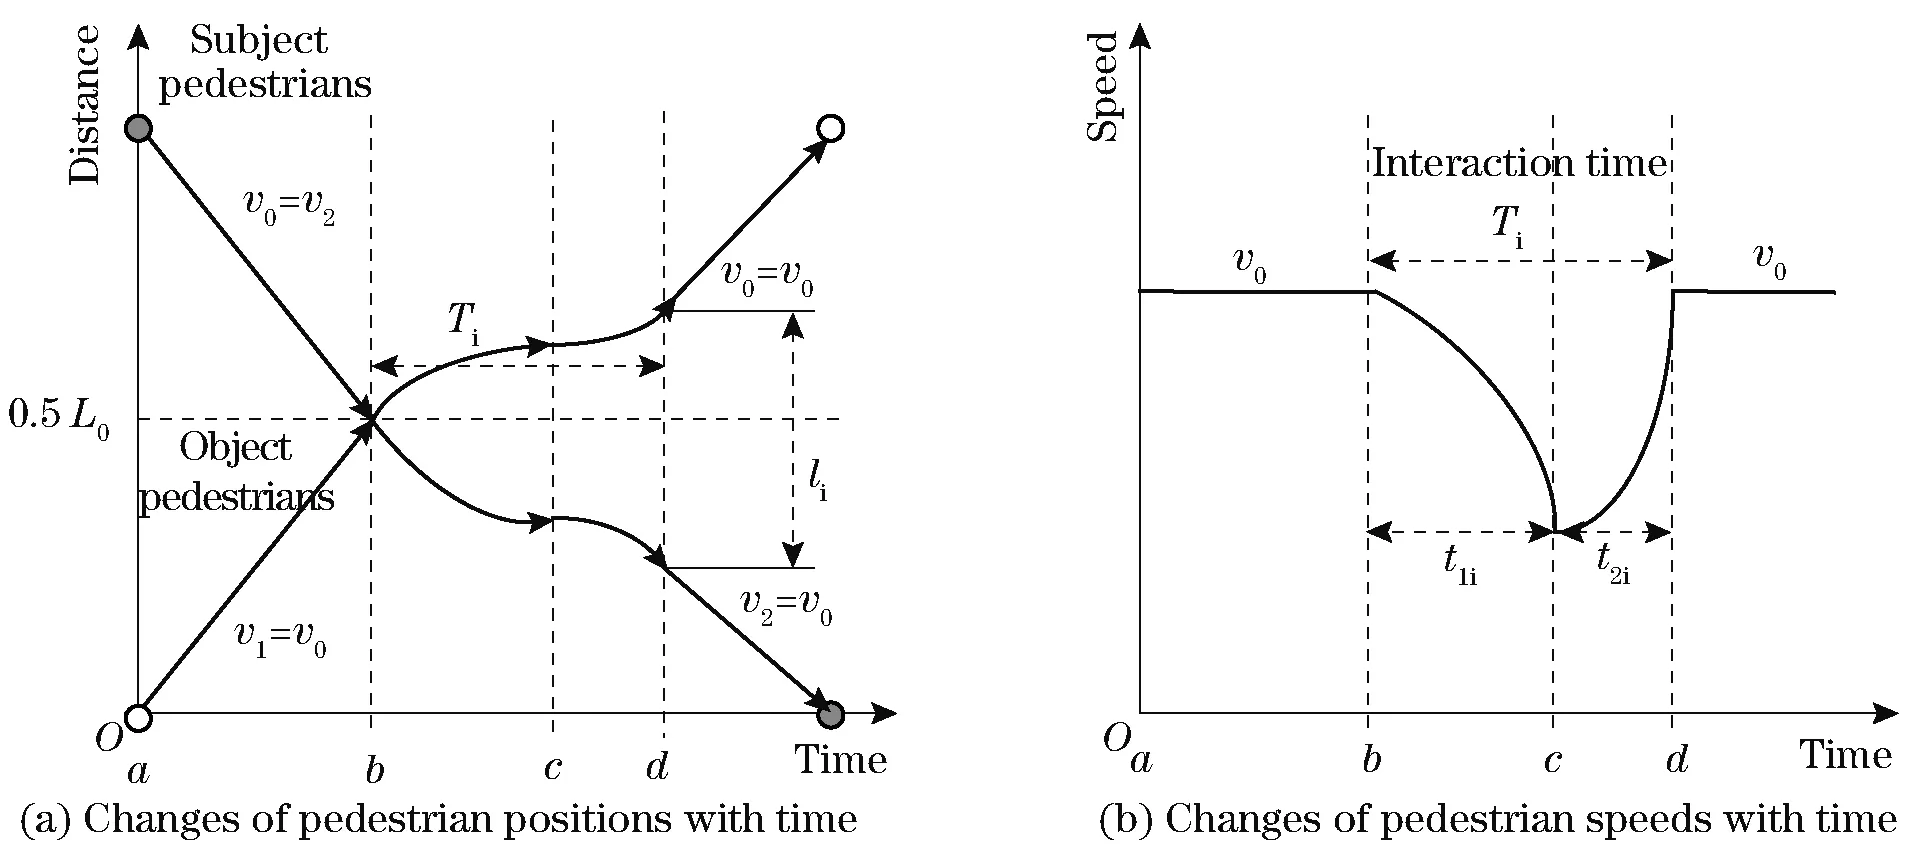
Fig.4 Time-space diagram for crossing process
From momentatob, pedestrians’speeds are supposed tobev0. The time from momentbtodis named an interaction time (ti), as shown in Fig.3. From momentbtoc, the deceleration in interaction timet1iincreases. From momentctod, the deceleration in interaction timet2idecreases.Tiequals the sum oft1iandt2i. After momentd, the speeds of the pedestrians are back tov0. Fig.4 shows the time-space diagram of the bi-directional pedestrians from both sides.
Because the movement of subject pedestrians from momentbtodis variable deceleration motion, and the theorem of momentum and the kinetic energy theorem are an appropriate method to solve this kind problem. From momentbtoc, equations of momentum theorem and kinetic energy theorem are shown in
(8)
(9)
wheremis replaced by the number of subject pedestrians,v1iis subject pedestrian speed at momentc(m/s).
By solving Eqs.(8)(9) can be obtained as
(10)
(11)
Similarly, from momentctod, the equations of momentum theorem and kinetic energy theorem are shown as
(12)
(13)
From Eqs.(12)(13) can be obtained as
(14)
(15)
Pedestrians are assumed to move with a constant speedv0before momentcand after momentd. So, crossing timeTcis expressed as

(16)
(17)
Cadjandliare two parameters which should be calibrated. But, because these two parameters are influenced by many factors, they are not of fixed values. So, we put forward their fitting formulas according to the observed data from seven survey sites. The value ofv0takes 1.45 m/s[10]. Firstly,N1,N1,lit1it2iandTcshould be acquired by observing. The database contains 187 signal cycles. Then,Cadjwas calculated with Eq.(17). Alhajyaseen[9-10]drew the conclusion thatCadjwas proportional tor. Through the fitting analysis,Cadjandlican be expressed by
(18)
(19)
respectively. Their coefficients of correlation (adjustedR2) is 0.78 and 0.84, respectively.
2.3 Model validation
The discharge times and crossing times of 187 cycles were collected at seven crosswalks to validate the proposed crossing time model. The comparison results are shown in Fig.5.

Fig.5 Comparison of estimated results and observed results
The standard deviations of the calculated results of the proposed model, Alhajyaseen model and HCM model are 9.38%, 15.26% and 12.42% respectively, from the observed crossing times. This indicates that the proposed model is accurate and reliable. Calculated crossing time of the proposed model is less than the observed results, because the discharge time model and the movement from momentatobare too idealistic. Because pedestrians can’t arrive and leave the waiting area in a unit of “pedestrian row” per second. In reality, pedestrians arriving and leaving the waiting are randomly, and the speeds of pedestrians change with time from momentatob. So, it is also a challenge to develop a model to calculate the discharge time and moving time (from momentatoband momentdto end). The calculated crossing time by HCM model is also less than the observed crossing time. One possible reason might be that the interactions between bi-directional pedestrians were ignored. Because the interactions between bi-directional pedestrians were overestimated, the estimated time from the Alhajyseen’s model are longer than other estimated values. The only difference among these three models is the time model from momentbtod. Because pedestrians is all assumed to move with a constant free-flow speedv0from momentatoband after momentd. So, the comparison result can be used to explain the difference of these three models.
3 Crosswalk Width Estimation
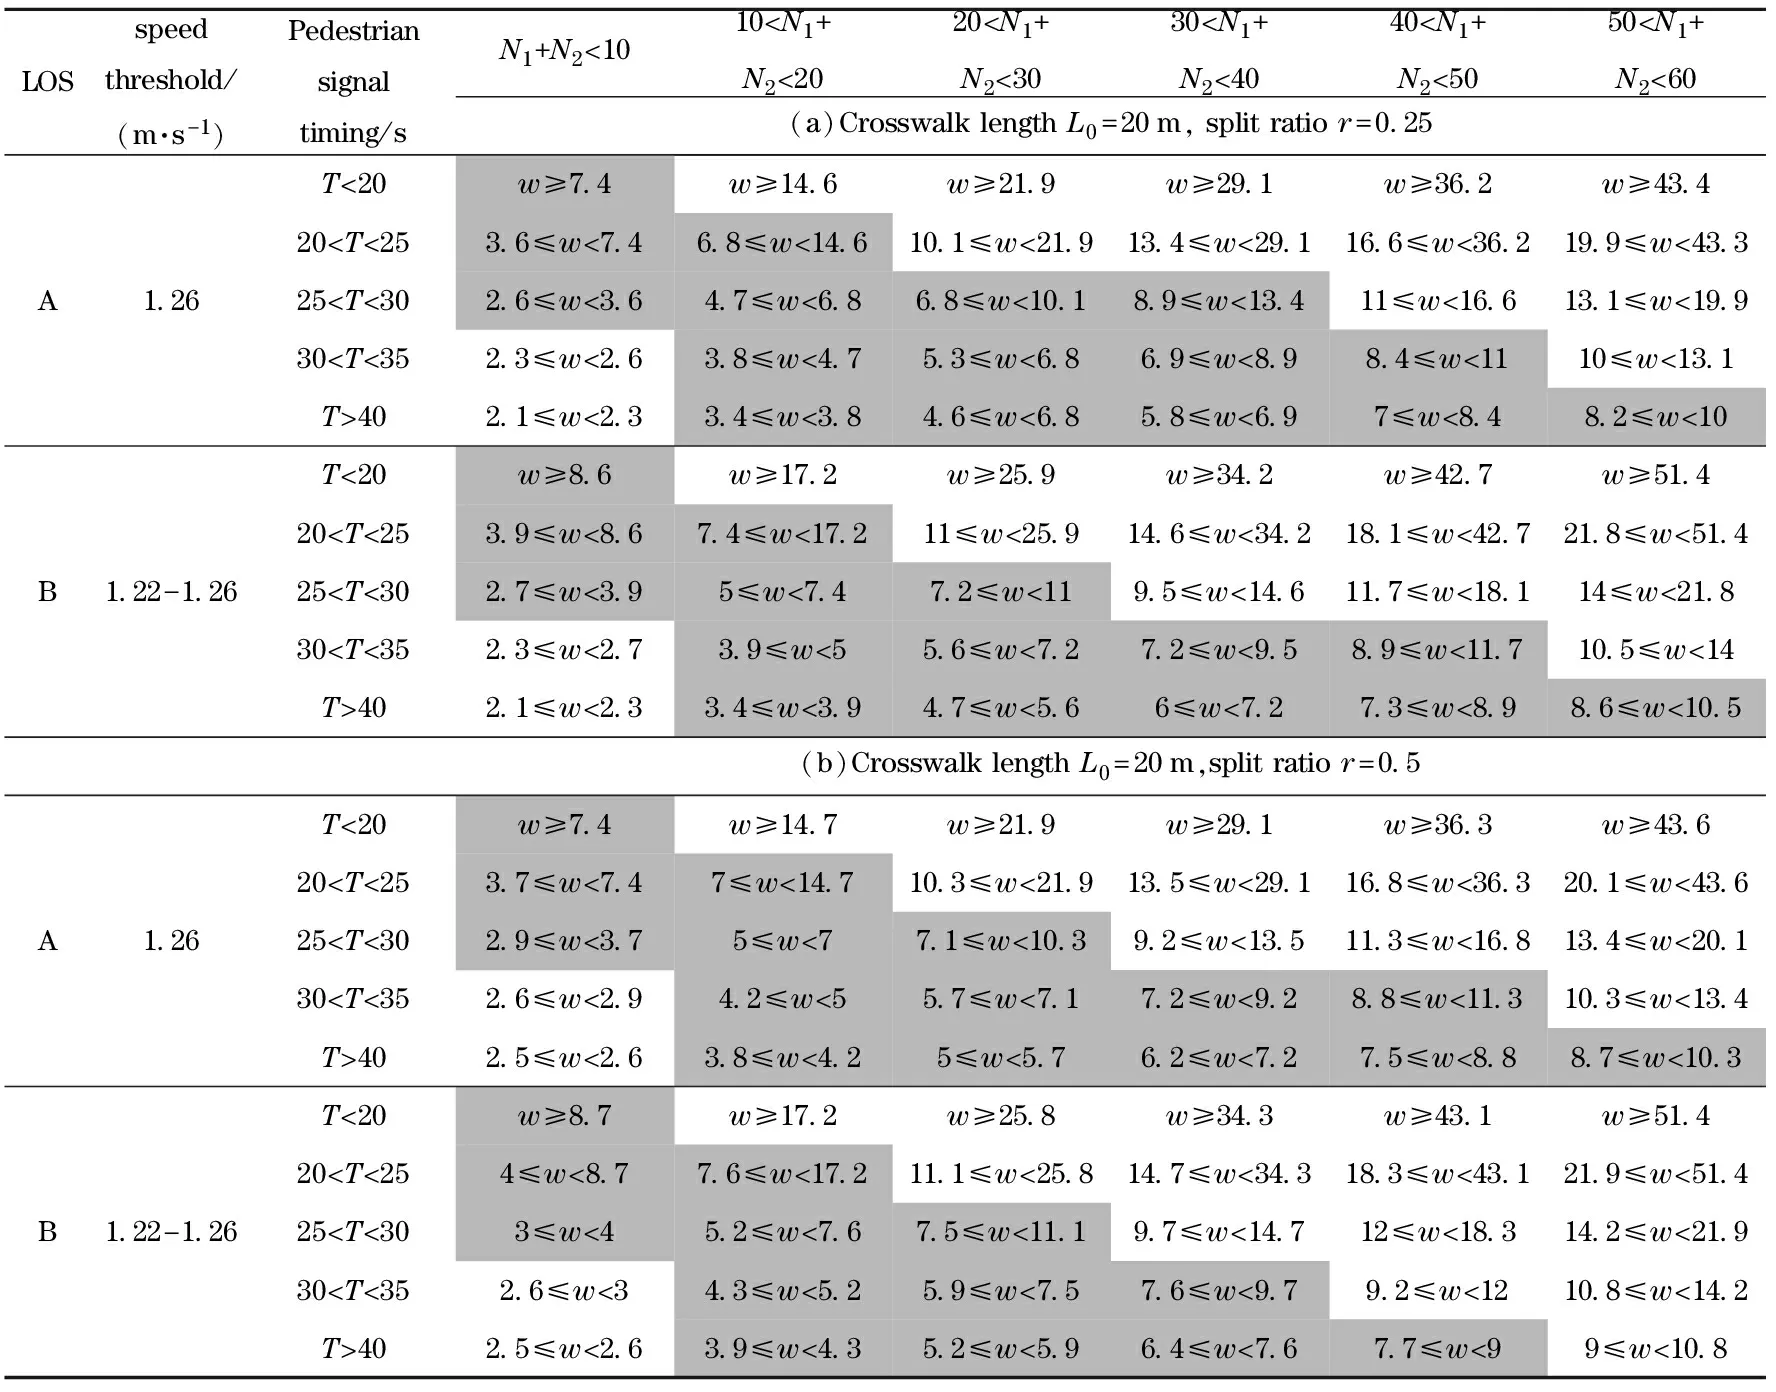
Depending on inverse of the proposed crossing time model, the required crosswalk width ranges are estimated for different crosswalk widths, pedestrian volumes, signal timing and level of service. In other words, signal time and level of service also affect the required crosswalk width. However, the relationship between signal timing and crosswalk width should be paid with special attentions. The estimated crosswalk width may be too large or too small because the signal timing is too long or too short. So, when we design the crosswalk width, the signal time also should be taken into consideration.
By using these level of service (LOS) standards and the proposed crossing time model, the estimated results in Tab.2 are obtained with different pedestrian volumes, signal timing and LOS. The LOS threshold proposed by Lee et al.[13]is defined by a specific speed. As described in the road traffic signs and markings, the maximum crosswalk width is 9 m, and the minimum crosswalk width is 3 m[1]. Because the estimated crosswalk width has a wide range, so we can choose the estimated results in the required range. We take the situation in Tab.2(a) as an example to explain the estimated results in LOS A and B. The estimated crosswalk widths in the required range are highlighted in Tab.2(a). The results below the highlights in Tab.2(a) indicate that the pedestrians have less space requirement because they have enough crossing time, so the estimated crosswalk width is smaller than the value in the Installation Specification for Road Traffic Management Facilities. When this happens, the proposed crosswalk width takes 3m to meet a required standard. On the contrary, the results above the highlights in Tab.2(a) indicate that the pedestrians have more space requirement because they have no enough crossing time, so the estimated crosswalk width is larger than the value in the road traffic signs and markings. When this happens, the proposed crosswalk width takes 9 m to meet a required standard.
Tab.2 Estimated crosswalk width (w) in LOS A and B
4 Conclusion
In this paper, we optimized the crossing time model developed by Alhajyseen. Considering the variation of interactions between a bi-directional pedestrian flow, the modified crossing time model is developed. Crossing timeTcis a relational expression of a crosswalk width, a bi-directional pedestrian volume, a maximum interaction length and a speed. So, we can estimate the required crosswalk width for different pedestrian volume, signal timing and LOS according to the inverse operation of the proposed crossing time model.The estimated requirement on crosswalk widths is more detailed and rational than the suggested values in the Manual on Road traffic signs and markings in China. If the designers want to improve the LOS of pedestrians at signaled intersections, they can take measures from two aspects: changing the crossing width or signal timing. However, the model has some shortcomings. Because the discharge time model is based on an assumption that pedestrians arrive and leave the waiting area in a unit of “pedestrian row” per second. In reality, the discharge timeTdrelies primarily on the maximum queue length which is also by the distribution of pedestrians waiting positions. The longest queue is located in the position with the biggest waiting probability. In other words, the existing discharge time model cannot reflect this mechanism, and this will be our future study.
[1] Research Institute of Highway Ministry of Transport. GB 5768.3—2009 Road traffic signs and markings [S]. Beijing: Standards Press of China, 2009. (in Chinese)
[2] Transportalion Research Board. Highway capacity manual[M]. Washington, DC, USA: National Renearrh Council, 2010: 678-679.
[3] Golani A, Damti H. Model for estimating crossing times at high-occupancy crosswalks[J]. Transportation Research Record, 2007(2002): 125-130.
[4] Lam W H K, Lee J Y S, Chan K S, et al. A generalised function for modeling bi-directional flow effects on indoor walkways in Hong Kong[J]. Transportation Research Part A: Policy and Practice, 2003, 37(9): 789-810.
[5] Alhajyaseen W K M, Nakamura H, Asano M. Effects of bi-directional pedestrian flow characteristics upon the capacity of signalized crosswalks[J]. Procedia-Social and Behavioral Sciences, 2011, 16: 526-535.
[6] Marisamynathan S, Vedagiri P. Modeling pedestrian delay at signalized intersection crosswalks under mixed traffic condition[J]. Procedia-Social and Behavioral Sciences, 2013, 104: 708-717.
[7] Zhang X, Chen P, Nakamura H, et al. Modeling pedestrian walking speed at signalized crosswalks considering crosswalk length and signal timing[C]∥Proceedings of the 10th International Conference of the Eastern Asia Society for Transportation Studies, Taipei, Taiwan, China, 2013.
[8] Zhao Hantao, Guo Dong. Model of pedestrians crossing time at signalized intersection with exclusive pedestrian phase[J]. Journal of Harbin Institute of Technology University,2012,44( 8): 57-61.(in Chinese)
[9] Alhajyaseen W K M, Nakamura H. A methodology for modeling pedestrian platoon discharge and crossing times at signalized crosswalks[C]∥Proceedings of the 88th Transportation Research Board Annual Meeting, Washington, DC, USA. 2009.
[10] Alhajyaseen W K M, Nakamura H. Estimating the minimum required width of signalized crosswalks considering bi-directional pedestrian flow and different age groups[J]. Asian Transport Studies, 2010, 1(2): 181-198.
[11] Pugh L G C E. The influence of wind resistance in running and walking and the mechanical efficiency of work against horizontal or vertical forces[J]. The Journal of Physiology, 1971, 213(2): 255-276.
[12] Pugh L G C E. The relation of oxygen intake and speed in competition cycling and comparative observations on the bicycle ergometer[J]. The Journal of Physiology, 1974, 241(3): 795-808.
[13] Lee J Y, Goh P K, Lam W H. New level-of-service standard for signalized crosswalks with bi-directional pedestrian flows[J]. Journal of Transportation Engineering, 2005, 131(12): 957-960.
杂志排行
Journal of Beijing Institute of Technology的其它文章
- Dynamic Mechanical Characteristics and Damage Evolution Model of Granite
- Combustion Properties of Metal Particles as Components of Modified Double-Base Propellants
- Efficient Activation Method of Hardware Trojan Based on Greedy Algorithm
- Estimation of Thermal Imaging System Operating Range Based on Background Radiation
- Network Sorting Algorithm of Multi-Frequency Signal with Adaptive SNR
- Log Likelihood Ratio-Based Relaying for Distributed Turbo Codes
