3-D Lagrangian-based investigations of the time-dependent cloud cavitating flows around a Clark-Y hydrofoil with special emphasis on shedding process analysis *
2018-04-13HuaiyuCheng程怀玉XinpingLong龙新平BinJi季斌QiLiu刘琦XiaoruiBai白晓蕊
Huai-yu Cheng(程怀玉), Xin-ping Long(龙新平),Bin Ji(季斌) ,Qi Liu(刘琦) ,Xiao-rui Bai(白晓蕊)
3-D Lagrangian-based investigations of the time-dependent cloud cavitating flows around a Clark-Y hydrofoil with special emphasis on shedding process analysis*
Huai-yu Cheng1, 2(程怀玉), Xin-ping Long1, 2(龙新平),Bin Ji1(季斌) ,Qi Liu3(刘琦) ,Xiao-rui Bai1, 2(白晓蕊)
1.2.3.
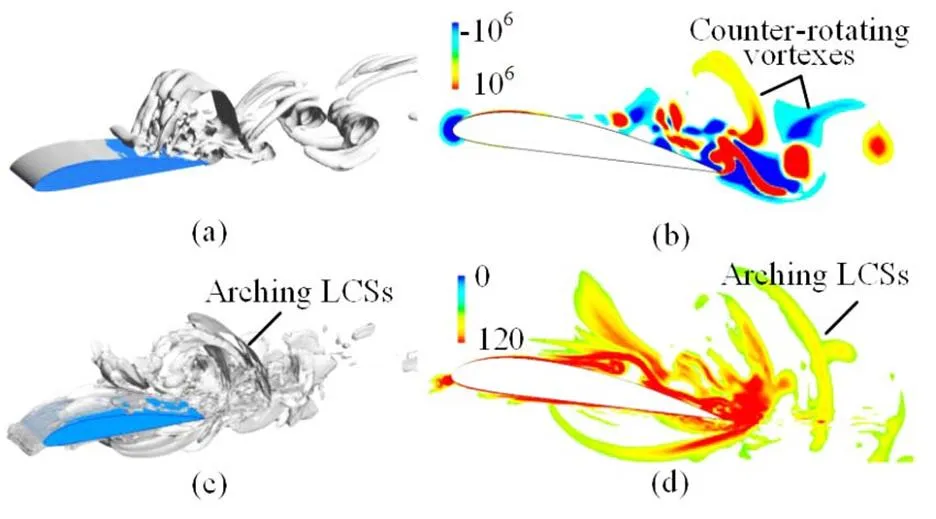
In the present paper, the unsteady cavitating flow around a 3-D Clark-Y hydrofoil is numerically investigated with the filter-based density correction model (FBDCM), a turbulence model and the Zwart-Gerber-Belamri (ZGB) cavitation model. A reasonable agreement is obtained between the numerical and experimental results. To study the complex flow structures more straightforwardly, a 3-D Lagrangian technology is developed, which can provide the particle tracks and the 3-D Lagrangian coherent structures (LCSs). Combined with the traditional methods based on the Eulerian viewpoint, this technology is used to analyze the attached cavity evolution and the re-entrant jet behavior in detail. At stageI, the collapse of the previous shedding cavity and the growth of a new attached cavity, the significant influence of the collapse both on the suction and pressure sides are captured quite well by the 3-D LCSs, which is underestimated by the traditional methods like the iso-surface of Q-criteria. As a kind of special LCSs, the arching LCSs are observed in the wake, induced by the counter-rotating vortexes. At stage II, with the development of the re-entrant jet, the influence of the cavitation on the pressure side is still not negligible. And with this 3-D Lagrangian technology, the tracks of the re-entrant jet are visualized clearly, moving from the trailing edge to the leading edge. Finally, at stage Ⅲ, the re-entrant jet collides with the mainstream and finally induces the shedding. The cavitation evolution and the re-entrant jet movement in the whole cycle are well visualized with the 3-D Lagrangian technology. Moreover, the comparison between the LCSs obtained with 2-D and 3-D Lagrangian technologies indicates the advantages of the latter. It is demonstrated that the 3-D Lagrangian technology is a promising tool in the investigation of complex cavitating flows.
Cavitation, CFD, Lagrangian coherent structures (LCSs), Clark-Y hydrofoil, vortical flow
Introduction
The cavitation is a special physical phenomenon in hydrodynamics[1-3], often associated with some un- desired consequences, such as vibration, erosion and performance reduction. Many studies were devoted to this complex flow in the past decades, which have significantly improved our understanding of the cavitation[4].
The cavitation occurs when the local pressure drops below the saturation vapor pressure[5]. The intense phase change processes between the liquid and the vapor involving the evaporation and the conden- sation significantly influence the local flow patterns[6]. Quite a number of investigations were conducted to reveal the cavitation-turbulence interaction[7, 8]. Accor- ding to the studies of Iyer and Ceccio[9], the growth and the collapse of cavitation bubbles will modify the shear layer downstream if the void fractions of the cavitating shear layers are up to 1.5%. Gopalan and Katz[10]suggested that the cavitation promotes the Reynolds shear stresses, whose magnitudes could reach up to 40% of the normal stresses. Their experi- mental data indicated that the turbulence level and the momentum deficit in the boundary layer downstream are strongly impacted even with a slight decrease of the cavitation number. Aeschlimann et al.[11]conduc- ted a detailed measurement on the velocity field in a cavitating shear layer flow with the PIV-LIF, and they pointed out that the successive vaporization and collapsing of bubbles induce noticeable fluctuations. The mass transfer during the phase change processes can also induce a substantial vorticity production and much more complex vortex structures[12]. A conside- rable increase of the baroclinic torque was captured in the regions where frequent collapses occur[13], which should be zero in non-cavitating flows due to the alignment of density and pressure gradients. Dittakavi et al.[14]suggested that the collapse of vapor structures plays an important role in the formation of hair-pin vortices. Moreover, the inherent unsteadiness of the cavitation will cause significant oscillations and flu- ctuations in the whole flow field[15, 16], which means that the flow pattern of the cavitating flow is very unsteady and complex. The situation becomes worse when the compressibility of the cavitating flow is taken into account[17].

Therefore, a 3-D Lagrangian technology was developed based on the original 2-D one[29]. Compared with a 2-D cavitation simulation, the node number in a 3-D numerical study increases signifi- cantly. It means a much higher requirement for the computational resource to obtain the 3-D LCSs, which generally makes it unaffordable. In this paper much effort is made to significantly enhance the efficiency, making it possible to obtain the LCSs in a three dimensional cavitating flow with an acceptable computational resource. With this improved 3-D Lagrangian technology, the complex flow patterns and the typical particle behaviors around a 3-D Clark-Y hydrofoil are discussed in detail. The LCSs obtained with the 2-D and 3-D Lagrangian technologies are compared.
1.Approach for 3-D Lagrangian coherent struc- tures


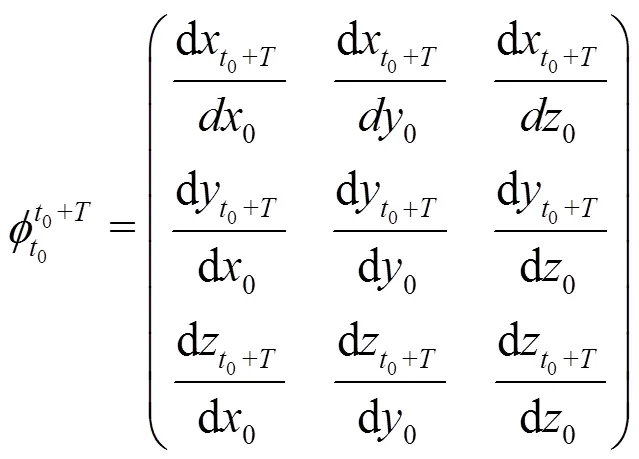


The finite-time Lyapunov exponent (FTLE) is defined as[30]

2.Mathematical formulations and numerical method
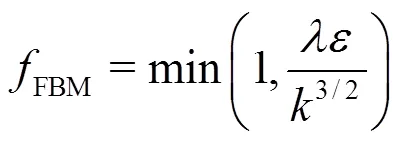
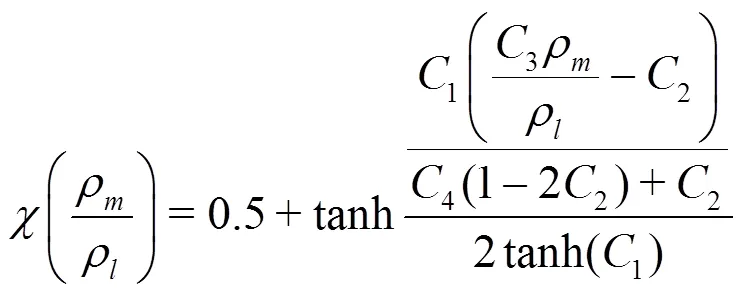
2.1 Turbulence model
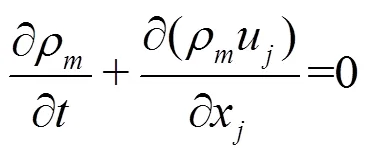
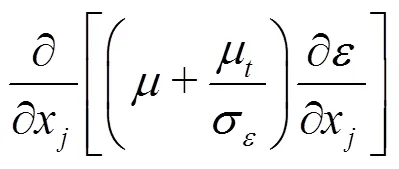
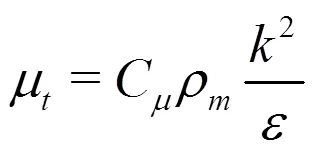
The homogeneous model is adopted, in which the slip velocity between the liquid and vapor phases is not considered. Then, the governing equations for the mixture flow can be written as:





2.2 Cavitation model
The default mass transfer model in the CFX, ZGB cavitation models[32]is adopted, in which the mass transfer rates per unit volume during the evapo- ration and condensation processes are defined as:


2.3 Simulation strategy

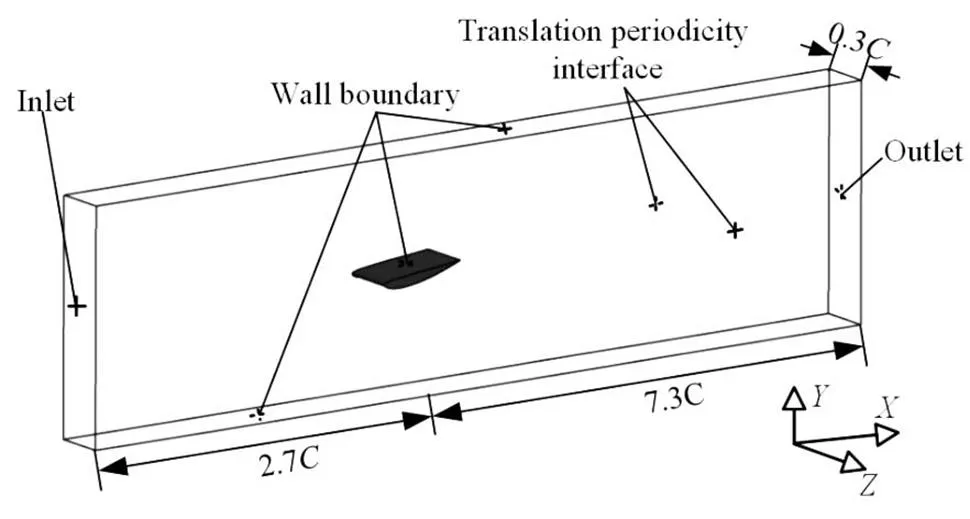
Fig. 1Computational domain and boundary conditions
Fig. 2Three meshes around the 3-D hydrofoil surface

Table1Results of the mesh independence study
2.4 Experimental validation
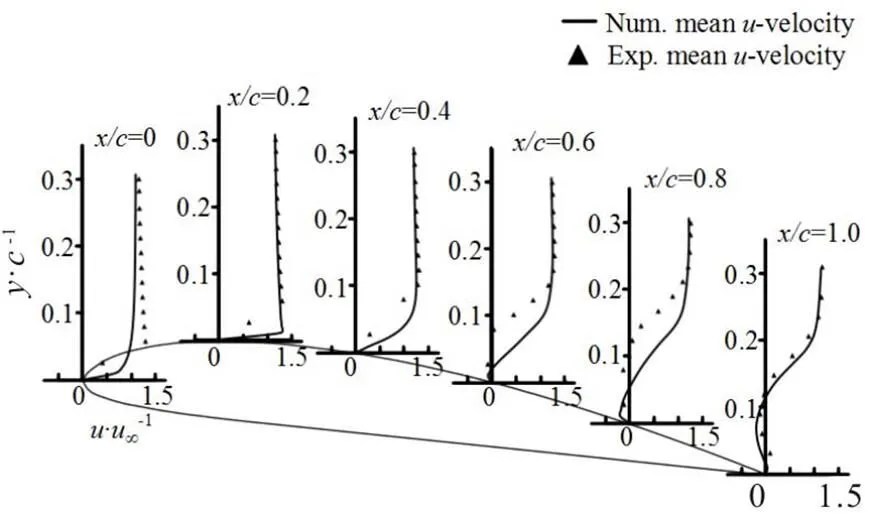
To validate the numerical results used in the present paper, we compare the time-averaged norma- lizedvelocity profiles at the mid-span of the foil obtained by the numerical results and the experimental data[31]as shown in Fig. 3. A good agreement is shown between the predicted and measured results. Figure 4 compares the predicted and measured dimen- sionless total vapor volume in two typical cycles. It is noted that the overall evolution of the cavity volume agrees well with the experimental data, except for some difference in the area of the minimum cavity volume. The evolution of the cavitation is also well reproduced in the numerical simulation, which will be discussed later in detail. Satisfactory agreements between the numerical and experimental data suggest that the simulation is sufficiently accurate. It should be noted that the comparisons between the numerical and experimental data only provide a qualitative analysis of the mesh resolution. Recently, for a quantitative analysis, Long et al.[33]conducted a series of investigations focusing on the verification and the validation of the unsteady cavitating flow and indicates that a mesh of about 2´106nodes is sufficient for the cavitating flow around a Clark-Y hydrofoil. In the current paper, the same topology is used and the node number is over 2´106with Meshes 2 and 3. It is further indicated that the mesh resolution of Mesh 2 is sufficient for our simulation.

3. Results and discussions
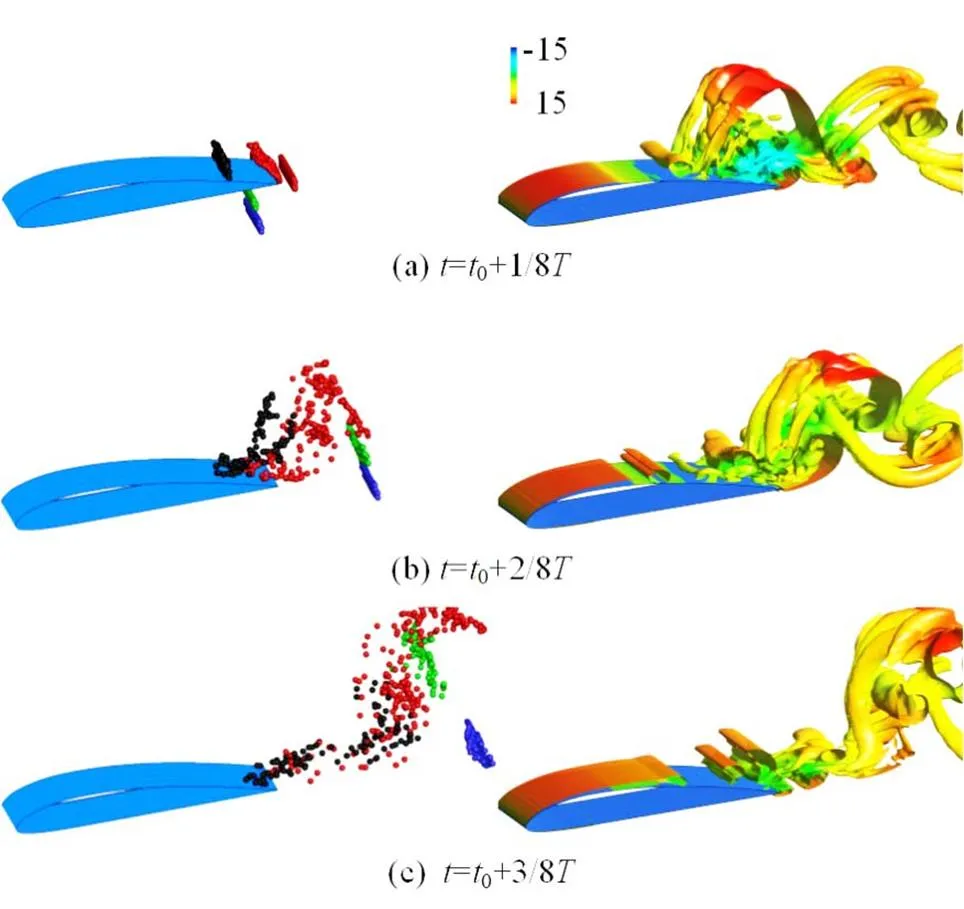
It is well known that the attached cavitating flow behaviors see a distinct quasi-periodicity, including the attached cavity growth, the re-entrant jet develop- ment, the shedding of the attached cavity and the collapse of the shedding cavity. It should be noted that the growth of a new attached cavity and the collapse of the shedding cavity induced in the previous cycle generally occur simultaneously. For the convenience of the following discussion, a typical evolution cycle of the cavitating flow around the Clark-Y hydrofoil is divided into three stages: (1) the collapse of the previous shedding cavity and the growth of a new cavity, (2) the development of the re-entrant jet and (3) the shedding of the attached cavity.
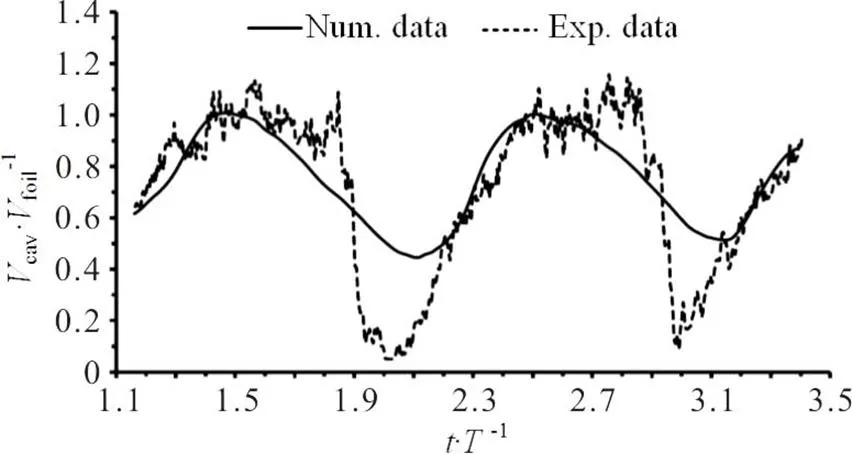
Fig.4The time-depended experimental[31]and numerical di- mensionless total vapor volumes

3.1 The collapse of the previous shedding cavity and the growth of a new cavity




3.2 The development of the re-entrant jet
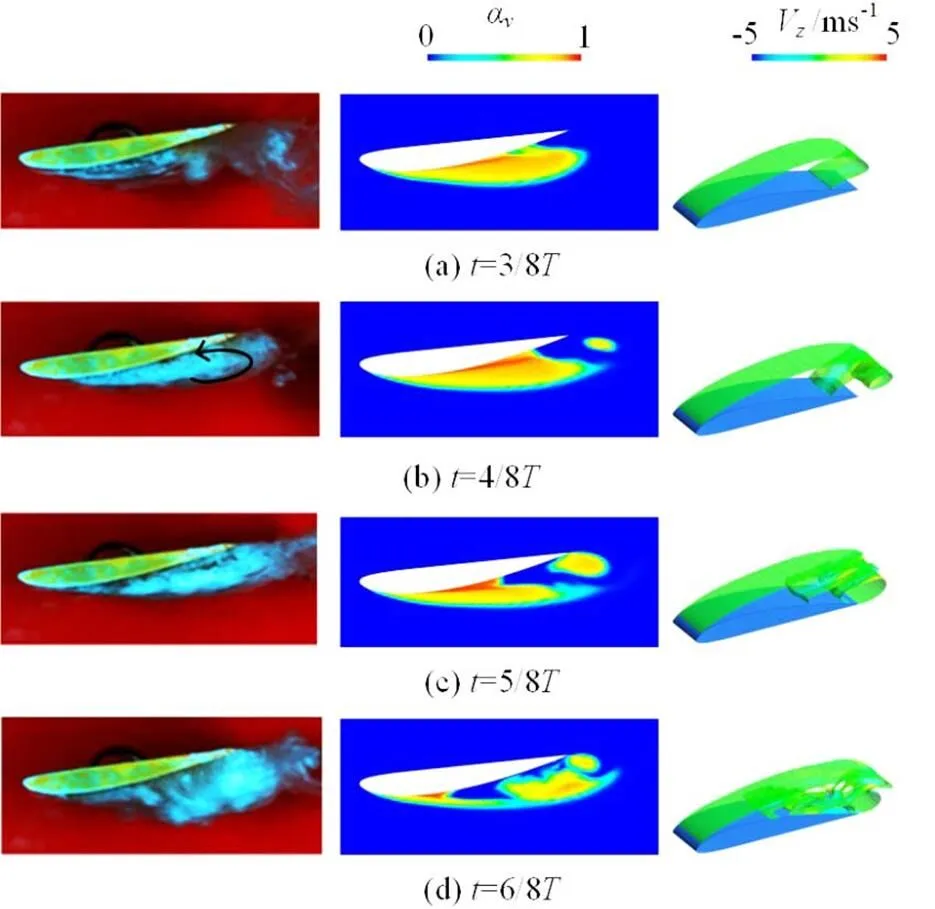
Fig.9(Color online) Comparison of experimental and numeri- cal data at Stage II (Left: Pictures by high speed photo- graphy[31], Middle: Contours of with , Right:Iso-surfacesof coloredby velocity)
3.3 The shedding of attached cavity



3.4Comparisons between LCSs obtained with 2-D and 3-D Lagrangian technologies
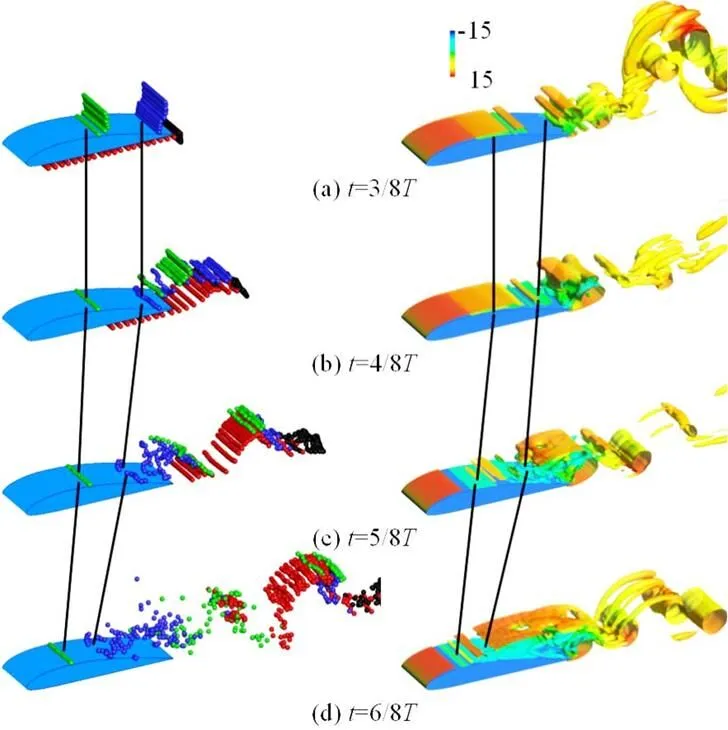
According to the above discussions, a conclusion can be drawn that the 3-D Lagrangian technology is a very useful tool for the analysis of the cavitating flow. The 3-D LCSs and the particle tracks obtained with this technology provide us a more visualized approach to study the flow patterns and the behaviors of the particles. To further demonstrate the superiorities of the 3-D Lagrangian technology over the original 2-D one, the LCSs obtained with these two technologies are compared. As shown in Fig. 15, much more details of the LCSs are captured with the 3-D Lagrangian technology. As mentioned above, the collapse of the shedding cavity at Stage Ⅰ modifies the flow patterns on the pressure side significantly, which leads to complex LCSs locally. But almost no LCSs are obtained on the pressure side with the original 2-D technology as shown in Fig. 15(a). The 3-D Lagrangian technology also enjoys a better perfor- mance in reflecting the vortex structures in the wake. The arching LCSs induced by counter-rotating vortexes with the 2-D technology are not very distinct. Even the flow separation on the suction side is underestimated with the 2-D Lagrangian technology. The main reason for the unsatisfactory performance of the original technology is the high 3-D nature of the cavitating flow. A 2-D Lagrangian analysis cannot capture the 3-D evolutions of the cavitating flow, as the 3-D Lagrangian technology developed in the present paper.
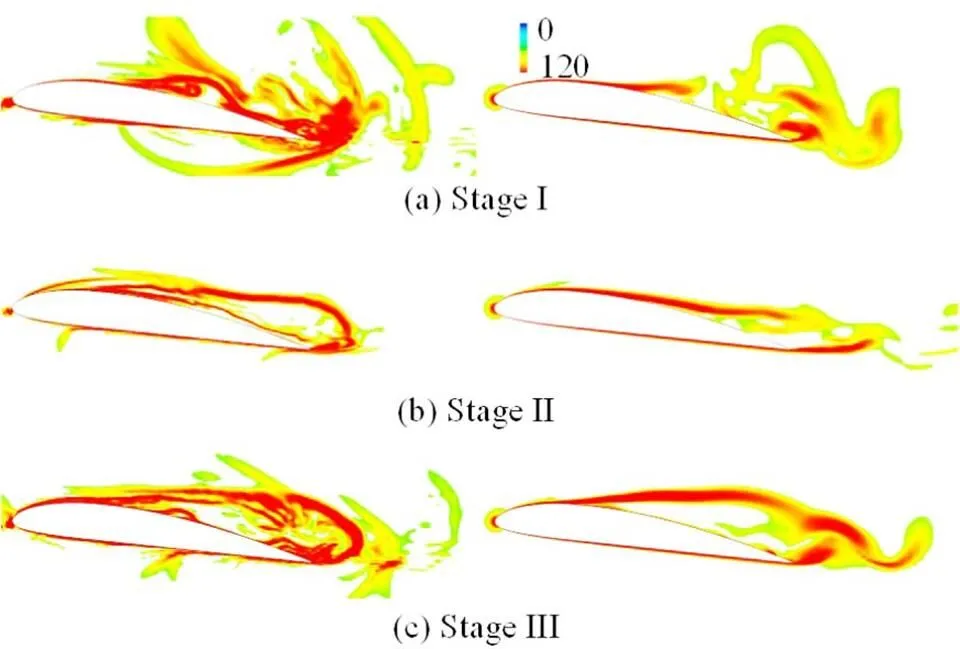
Fig.15(Color online) LCSs on middle plane obtained with 3-D (left) and 2-D (right) Lagrangian technologies at diffe- rent stages
4. Conclusions
In the present paper, the unsteady cavitating flow around a Clark-Y hydrofoil is simulated using the FBDCM turbulence model combined with the ZGB cavitation model. A reasonable agreement between the numerical and experimental data is obtained. To study the features of the cavitating flow, a 3-D Lagrangian technology is developed, to obtain 3-D LCSs and particle tracks in the flow field and to make it possible to analyze the flow patterns from the Lagrangian viewpoint. Combined with the traditional analysis method based on the Eulerian viewpoint, the 3-D Lagrangian technology is used to investigate the flow characteristicsofthecavitationatdifferentstagesin detail, such as the collapse of the previous shedding cavity and the growth of a new cavity, the develop- ment of the re-entrant jet and the shedding of the attached cavity. And at last, the LCSs obtained with the 3-D Lagrangian technology and the original 2-D one are compared. The main conclusions are drawn as follows:
(1)The simulations conducted in the present paper with the FBDCM turbulence model and the ZGB cavitation model show a good agreement with the experimental data. Moreover, the numerical results reproduce the evolution of the cavitating flow around a Clark-Y hydrofoil well.
(2)At Stage I,the collapse of the previous shedding cavity and the growth of a new cavity are captured numerically. Compared with the traditional methods based on the Eulerian viewpoint, the 3-D LCSs provided by the 3-D Lagrangian technology give a better picture of the flow patterns on the pressure side. It indicates that the movement of the particles on the pressure side may be completely different even from that at the neighboring initial locations due to the influence of the collapse on the suction side. Very complex LCSs, such as the arching LCSs, are induced in the wake, which can be attributed to the vortexes caused by the collapse of the previous shedding cavity. The evolution of the vortexes also has an important impact on the particle tracks.
(3)At Stage II, with the particle tracks provided by the 3-D Lagrangian technology, the development of the re-entrant jet can be visualized clearly. The particles near the trailing edge are trapped due to the anti-clockwise cavitation vortex and then are advected upstream along the foil surface, forming a re-entrant jet. During the development of the re-entrant jet, the shape of the cavity is significantly disturbed. It clearly demonstrates the value of the 3-D Lagrangian tech- nology for the analysis of the cavitating flow.
(4)At Stage Ⅲ, the attached cavity is cut off by the re-entrant jet finally, which is well captured by the numerical results. With the help of the tracks obtained with the 3-D Lagrangian technology, the whole evolution of the re-entrant jet is visualized clearly. The particles near the foil surface move upstream due to the influence of the re-entrant jet and collide with the mainstream, leading to the shedding of the attached cavity. And then the flow direction of these particles is reversed and advected downstream.
(5)The comparison of the LCSs obtained with the newly developed 3-D Lagrangian technology and the original 2-D one indicates that much more LCSs can be provided with the 3-D Lagrangian technology. The 2-D Lagrangian analysis suppresses the 3-D characteristics of the cavitating flow and fails to describe the evolution of the cavitation.
[1] Wang Y., Wu X., Huang C. et al. Unsteady characteristics of cloud cavitating flow near the free surface around an axisymmetric projectile [J]., 2016, 85: 48-56.
[2] Arndt R. E. A. Cavitation in vortical flows [J]., 2002, 34: 143-175.
[3] Arndt R. E. A., Arakeri V. H., Higuchi H. Some observa- tions of tip-vortex cavitation [J]., 1991, 229: 269-289.
[4] Wang Y., Xu C., Wu X. et al. Ventilated cloud cavitating flow around a blunt body close to the free surface [J]., 2017, 2(8): 084303.
[5] Arndt R. E. A. Cavitation in fluid machinery and hydrau- lic structures [J]., 1981, 13: 273-328.
[6] Stutz B., Reboud J. L. Experiments on unsteady cavitation [J]., 1997, 22(3): 191-198.
[7] Coutier-Delgosha O., Devillers J. F., Pichon T. et al. Internal structure and dynamics of sheet cavitation [J]., 2006, 18(1): 017103.
[8] Makiharju S. A., Gabillet C., Paik B. G. et al. Time- resolved two-dimensional X-ray densitometry of a two- phase flow downstream of a ventilated cavity [J]., 2013, 54(7): 1561.
[9] Iyer C. O., Ceccio S. L. The influence of developed cavitation on the flow of a turbulent shear layer [J]., 2002, 14(10): 3414-3431.
[10] Gopalan S., Katz J. Flow structure and modeling issues in the closure region of attached cavitation [J]., 2000, 12(4): 895-911.
[11]Aeschlimann V., Barre S., Djeridi H. Velocity field analysis in an experimental cavitating mixing layer [J]., 2011, 23(5): 055105.
[12] Ji B., Luo X., Arndt R. E. A. et al. Numerical simulation of three dimensional cavitation shedding dynamics with special emphasis on cavitation-vortex interaction [J]., 2014, 87: 64-77.
[13] Long X., Cheng H., Ji B. et al. Numerical investigation of attached cavitation shedding dynamics around the Clark-Y hydrofoil with the FBDCM and an integral method [J]., 2017, 137: 247-261.
[14] Dittakavi N., Chunekar A., Frankel S. Large eddy simu- lation of turbulent-cavitation interactions in a venturi nozzle [J]., 2010, 132(12): 121301.
[15] Callenaere M., Franc J. P., Michel J. M. et al. The cavita- tion instability induced by the development of a re-entrant jet [J]., 2001, 444: 223-256.
[16] Peng X. X., Ji B., Cao Y. T. et al. Combined experimental observation and numerical simulation of the cloud cavitation with U-type flow structures on hydrofoils [J]., 2016, 79: 10-22.
[17] Akhatov I., Lindau O., Topolnikov A. et al. Collapse and rebound of a laser-induced cavitation bubble [J]., 2001, 13(10): 2805-2819.
[18]Kolář V. Vortex identification: New requirements and limitations [J]., 2007, 28(4): 638-652.
[19] Huang B., Zhao Y., Wang G. Large eddy simulation of turbulent vortex-cavitation interactions in transient sheet/ cloud cavitating flows [J]., 2014, 92: 113-124.
[20] Ji B., Luo X., Wu Y. et al. Numerical analysis of unsteady cavitating turbulent flow and shedding horseshoe vortex structure around a twisted hydrofoil [J]., 2013, 51(5): 33-43.
[21] Kubota A., Kato H., Yamaguchi H. A new modeling of cavitating flows-a numerical study of unsteady cavitation on a hydrofoil section [J]., 1992, 240: 59-96.
[22]Haller G. Lagrangian coherent structures [J]., 2015, 47: 137-162.
[23]Green M. A., Rowley C. W., Haller G. Detection of Lagrangian coherent structures in three-dimensional turbulence [J]., 2007, 572: 111-120.
[24] Hu C., Wang G., Chen G. et al. Three-dimensional unsteady cavitating flows around an axisymmetric body with a blunt headform [J]., 2015, 29(3): 1093-1101.
[25] Tseng C. C., Liu P. B. Dynamic behaviors of the turbulent cavitating flows based on the Eulerian and Lagtangian viewpoints [J]., 2016, 102: 479-500.
[26] Cheng H. Y., Long X. P., Ji B. et al. Numerical investiga- tion of unsteady cavitating turbulent flows around twisted hydrofoil from the Lagrangian viewpoint [J]., 2016, 28(4): 709-712.
[27]Tang W., Chan P. W., Haller G. Lagrangian coherent structure analysis of terminal winds detected by lidar. Part I: Turbulence structures [J]., 2011, 50(2): 325-338.
[28] Dular M., Bachert R., Schaad C. Investigation of a re- entrant jet reflection at an inclined cavity closure line [J]., 2007, 26(5): 688-705.
[29] Zhao Y., Wang G., Huang B. et al. Lagrangian inves- tigations of vortex dynamics in time-dependent cloud cavitating flows [J]., 2016, 93: 167-174.
[30] Haller G. Lagrangian structures and the rate of strain in a partition of two-dimensional turbulence [J]., 2001, 13(11): 3365-3385.
[31]Huang B., Wang G. Y., Zhao Y. Numerical simulation unsteady cloud cavitating flow with a filter-based density correction model [J]., 2014, 26(1): 26-36.
[32] Zwart P. J., Gerber A. G., Belamri T. A two phase flow model for predicting cavitation dynamics [C]., Yokohama, Japan, 2004.
[33] Long Y., Long X. P., Ji B. et al. Verification and valida- tion of URANS simulations of the turbulent cavitating flow around the hydrofoil [J]., 2017, 29(4): 610-620.
(October 10, 2017, Accepted November 30, 2017)
©China Ship Scientific Research Center 2018
* Project supported by the National Natural Science Foundation of China (Project Nos. 11772239, 51576143 and 91752105), the Outstanding Youth Foundation of Natural Scie- nce Foundation ofHubei Province (Grant No. 2017CFA048).
Huai-yu Cheng (1993-), Male, Ph. D. Candidate,
E-mail: chengiu@whu.edu.cn
Bin Ji,
E-mail:jibin@whu.edu.cn
猜你喜欢
杂志排行
水动力学研究与进展 B辑的其它文章
- Spectral/hp elementmethods:Recent developments,applications, and perspectives *
- Modeling of single film bubble and numerical study of the plateau structure in foam system *
- Influence of upstream disturbance on the draft-tube flow of Francis turbine under part-load conditions *
- Numerical study of the wave-induced slamming force on the elastic plate based on MPS-FEM coupled method *
- Gas-liquid flow splitting in T-junction with inclined lateral arm *
- The experimental study of hydrodynamic characteristics of the overland flow on a slope with three-dimensional Geomat *
