Novel Biological Based Method for Robot Navigation and Localization
2018-04-08EndriRamaGenciCapiYusukeFujimuraNorifumiTanakaShigenoriKawaharaandMitsuruJindai
Endri Rama, Genci Capi, Yusuke Fujimura, Norifumi Tanaka, Shigenori Kawahara, and Mitsuru Jindai
1.Introduction
Navigation and localization are two closely linked processes with great importance in everyday life. Navigation is a field of study that deals with moving objects from one place to another. In a broader sense, it can refer to any skill or study that involves the trajectory determination and direction. One of the most important cognitive processes during navigation is decision-making, which requires integrating many neural activities across different brain regions[1]. On the other hand,localization involves always the question: Where is the object now? Try to find out the position relative to some landmark,usually the point of origin or destination[2].
These two processes are of particular importance in robotics, and especially for mobile robots. The current location of a robot and the navigation strategies can be determined by using different sensors, depending on the characteristics of the mobile robot and the environment. Many researchers use different methods, such as laser range finder and vision based navigation, joysticks and haptic devices, odometers, and global positioning system (GPS), for robot navigation[3]-[6].
However, one method that works well for one robot in one environment may not work well or at all in another environment.For example, localization which works well in an outdoor environment may be useless indoors. In order to enhance these problems, scientists started to involve brain machine interface(BMI) for robot navigation and localization[7],[8].
BMI technologies are a class of neuro-technologies originally developed for medical assistive applications[9]. They have been largely focused on improving the quality of life for particular clinical populations and include, for example,applications for advanced communications with paralyzed patients as well as the direct control of prostheses and wheelchairs[10]-[12]. A common problem of all BMI applications is the acquired signal quality. The signal quality depends on the electrode quality, electrode location, signal power, etc., but generally the recorded signal is noisy. Nevertheless, the tremendous growth of researches in the field of neuroscience over the past decades offers an approach to address these limitations. Invasive-BMI technology is a method where the electrodes are implanted intracranially, directly to the desired brain location, in the animal’s brain. This methodology provides neural signals of the best quality[13].
Furthermore, it is well known that animals can accurately and rapidly navigate in complex spaces. This ability to be organized in time and space stands on determining a heading direction[14]and localizing themselves in reference to the surrounding environmental cues. Therefore, animals utilize internal and external cues in navigating and constructing spatial representation[15]-[17]. However, few studies simultaneously integrate real rat’s neuroscience data with robot navigation.
In this paper we are focused on the investigation of the rat’s navigation and localization strategies, especially on the decision-making process, during a procedural maze task.Based on the previous behavior results we suggest that rats might use two different navigation strategies to solve the complex Y-maze task[18],[19]. Our theories are consistent with many other studies so far, which have demonstrated that hippocampus and striatum play an important role in navigation and decision-making. In order to verify our hypothesis, we record local field potentials (LFPs) with bipolar electrodes implanted in these brain regions (two electrodes in hippocampus (left and right sides) and one in dorsolateral striatum). The recorded LFPs are then analyzed and processed by using different Matlab based toolboxes, in order to extract different features. These features are used as the input in the artificial neural network which is trained and used to control the robot. The results indicate that the robot learns to integrate the internal states as well as external sensors in order to localize and navigate in the complex environment.
2.Materials and Methods
All procedures were approved by the University of Toyama Committee on the Animal Care and were in accordance with the National Institutes of Health Guidelines for the Care and Use of Laboratory Animals.
2.1 Subjects
Two adult male Wistar/ST rats, purchased from Japan SLC, Inc. (Hamamatsu, Japan), were served as subjects.Rats weighed between 290 g and 310 g at the time of arrival and were maintained individually in a controlled conditions room: Room temperature (23±2) °C with a 12 hours lightdark cycle (lights on from 8:00 AM). Water was available ad libitum in the home cage. Food was restricted to motivate food seeking behavior and to maintain the rats at 85% of their free-feeding weights. A different cage was utilized to transport each rat from the housing room to the experiment area. In order to avoid the rats’ confusion, the transportation cage was covered with a black curtain.
2.2 Apparatus
Animals were trained in a multiple Y-maze (170 cm×210 cm) and elevated 35 cm above the floor, and consisted of one starting spot and five goal locations, as shown in Fig. 1 and Fig. 2. The goal arms (routes) were numbered 1 to 5,clockwise. The maze was built of 10 cm width light blue polystyrene materials and covered with a transparent PVC sheet. All the routes were surrounded by 2 cm bands in order to protect the animals from sliding and falling down.
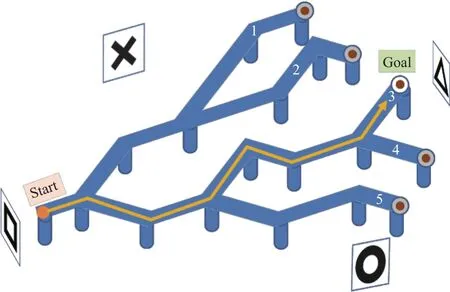
Fig. 1. Schematic representation of the experiment apparatus.

Fig. 2. Real experiment environment.
In the end of each route was installed a metallic cup of 2 cm depth, which contained food (cereal pellets). The food odor was equal for each goal location. Four of them were covered with a metallic net, covered food, and one was left uncovered,the reward location. The experiment room is aspirated and kept at the constant temperature of (24±1) °C. The environment was surrounded by heavy black curtains to visually isolate the Y-maze area and to avoid any light leaking from the outer environment as shown in Fig. 2. Illumination was provided by two fluorescent bulbs. In each side of the experiment area were hanged four different visually distinct cues:Square—at home side, triangle—at the goal location side,X—in the left, and circle—in the right side of the maze.
As shown in Fig. 2, cues were printed in black, in 42 cm×42 cm white cardboards. The same maze was used to perform the experiments with the mobile robot.
2.3 Training Procedure
Firstly, the animals were trained to find the uncovered food location (the reward), to learn and memorize the correct route.During training, each rat was placed on the starting position and allowed to navigate freely on the maze environment until it reached the reward location, which was fixed throughout the experiments. The training sessions took place between 6:00 PM to 8:00 PM for all rats. They received 1 session (20 trials) of training per day. For each training session, a correct trial was recorded only when the animal reached the reward with the first attempt, without making any turns in incorrect routes in the Y-junctions. A trial was terminated once the rat reached the reward location. After the animal ate the food, the experimenter relocated the rat to the bucket and cleaned the maze. The rats were trained to learn the maze in a lighted environment, until they reached an asymptotic level of learning and a criterion of at least 85% correct.
2.4 Data Acquisition
Training and other experiments sessions performed under different changes of the environment settings were followed by the surgery and electrode implantation process.
Fig. 3 shows the data acquisition system used in this work.We recorded LFPs from hippocampus (left and right sides) and dorsolateral striatum (left side), simultaneously. Three bipolar electrodes were implanted in the rat brain. The electrode positions are shown in Table 1. After performing the perfusion and Nissl stain process, we verified the real electrodes locations, as shown in Fig. 4. There presented a 30 μm coronal section around each electrode location, taken from Rat 1 brain.Electrodes pins on the animal head were connected with a preamplifier in order to eliminate the effect of noise on the recorded brain signals. LFPs were recorded by using a Nihon Kohden multichannel amplifier. The recording frequency was at 1 kHz and then LFPs were sub-sampled at 1 kHz for further analysis. All the data was stored as .csv file, in a personal computer.

Fig. 3. Data acquisition system.

Table 1: Electrode positions
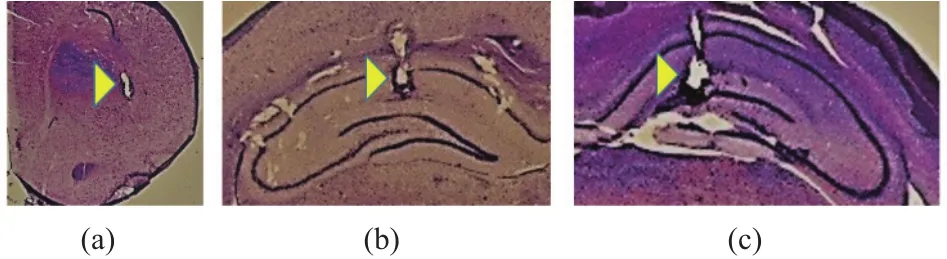
Fig. 4. Electrodes locations in: (a) dorsolateral striatum (left side),(b) hippocampus (right side), and (c) hippocampus (left side).
In each Y-junction of the maze we installed a distance sensor (GP2Y0A21YK0F). Signals from these sensors were recorded together with LFPs in one channel, and were used to mark the rat position on the LFPs data.
Also, we used a video recording system (movement tracker) composed by a low cost camera (KBRC-M05VU) and a Panasonic CF-N10 i5 notebook. Camera, fixed in the center of the experimental area and 170 cm above the maze, had the following properties: 30 frames per second, infrared camera with self-adjustment of exposure and image adjustment functions. We built an easy Matlab based graphical user interface in order to track the rat movement, to collect the camera data, and to calculate the time spent by the animal to reach the reward location. Fig. 5 shows the Rat 2 movements tracked in three different sessions.
2.5 Feature Extraction
LFPs are generated by neuronal ensembles and contain information about the underlying cellular activity. They have extensively been used to investigate central circuit functions.The recorded data was processed offline by using Matlab signal processing toolbox and Chronux toolbox, in order to extract different features. Fig. 6 represents raw hippocampal and striatal LFPs traces recorded simultaneously during a single representative trial (Rat 1, Session 3, Trial 5).
The recorded data was represented by matrixwhere C is the number of channels and N is the number of sample time points. Channel 1 recorded the signal from the sensors S1, S2, and S3, which were used as markers of the rat position on the recorded LFPs. Channels 2 and 3 recorded the LFPs from hippocampus left and right sides, respectively.Channel 4 recorded the LFPs from the left side of striatum.
In these LFPs traces we focused on the decision-making events, represented by sensors S1, S2, and S3. These markers represent the moments in which the animal started turning left or right in each Y-junction, so the animal has already decided which route to follow. We analyzed the one second time epoch in the Y-junction, 0.5 s before and after the event, as shown in Fig. 7. Every epoch was then divided into N time windows for each LFPs trace, and performed the fast Fourier transformation(FFT) by using

We obtained the frequency representation and the power spectra of the processed LFPs. For every window and channel,the sample data mean values were calculated aswhere. The data was stored in a feature vector, where(fiare all the features extracted from the hippocampal and striatal LFPs). These features were used to train a feed forward neural network (FFNN).

Fig. 5. Rat 2 movements tracked from the camera in three different sessions: (a) initial phase of training, (b) rat almost learned the task, and (c) rat passed the 85% correct learning criteria.

Fig. 6. One trial representation of raw LFPs traces.

Fig. 7. Time window around decision-making events.
3.Robot and Artificial Neural Network
In this section we define the architecture of the neural network used to control the robot and the robot characteristics.Based on the input data, the e-puck robot motion was determined and sent by a Bluetooth connection with a Matlab based personal computer.
3.1 E-Puck Robot
In all the conducted experiments in this work, we utilized an e-puck robot, as shown in Fig. 8. We used this robot because it has a simple mechanical structure and fine electronics design, offering many possibilities with its sensors,processing power, and extensions. E-puck is small, flexible,and user friendly, and has good robustness. It does not need any cables, providing optimal working comfort[20],[21].
E-puck robot has several sensors, such as sound sensors,encoders, odometry sensors, camera, and proximity sensors. In our experiments, the robot utilized the data from proximity sensors to perceive the decision-making moment in the Y-junctions, as shown in Fig. 9. We set a threshold value (around 2.3 cm) for the sensors IR 2 and IR 5, so when this threshold was passed then the robot stop moving.
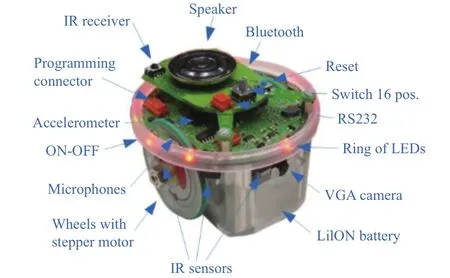
Fig. 8. E-puck robot.
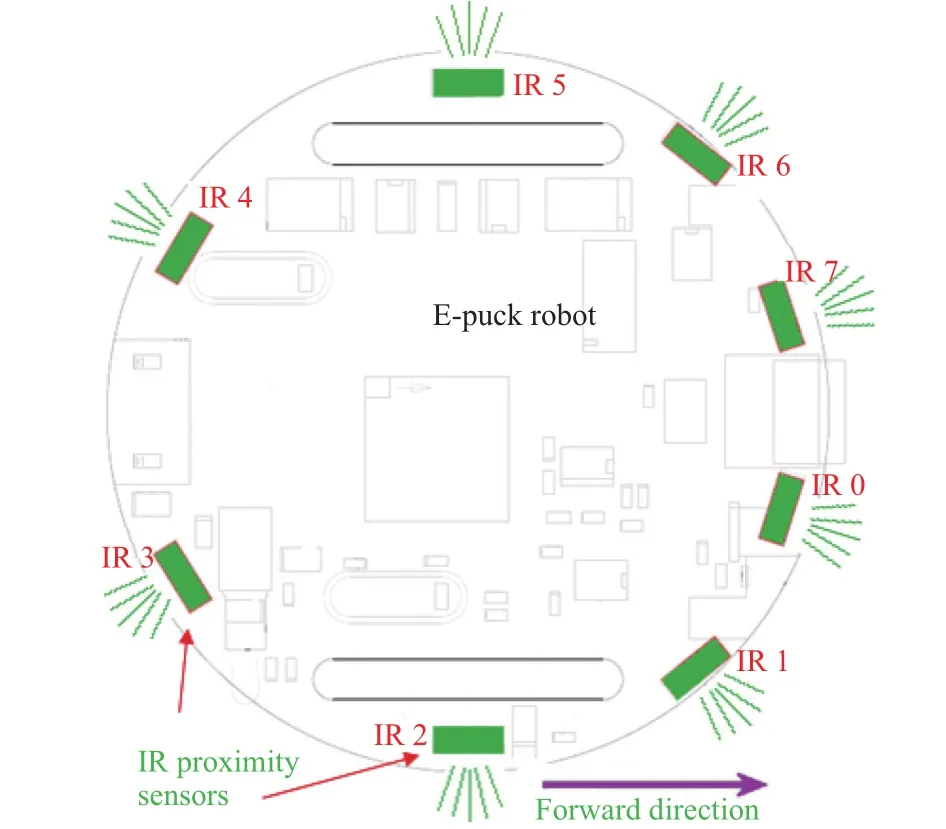
Fig. 9. E-puck robot proximity sensors.
Moreover, encoder sensors were used by the robot during the navigation in other parts of the maze, especially to define the moment when the robot reached the reward location.
3.2 Neural Network
The decision-making process, based on the animal’s LFPs, was done by applying a FFNN, as shown in Fig. 10.We employed three neural networks, one per each Y-junction,with 6 input, 8 hidden, and 2 output units. Six features, two from each LFP, were used as the input to the neural network.
In the implemented neural network, the sigmoid function was used as an activation function for the hidden and output units, as shown in (2):

Activation aiof a neuron i is the sum of all weighted inputs from neuron j of previous layer:

where wi,jare weights connections between nodes of different layers.

Fig. 10. Artificial neural network architecture, where NN W_i_h means neural network weights connections between the input and hidden layers and NN W_h_o means neural network weights connections between the hidden and output layers.
Two output units of the neural controllers are the decision-making values “0” or “1”, which represents
i) Output [0 1]: Robot will turn right;
ii) Output [1 0]: Robot will turn left.
The value of the output neurons is not exactly “0” or“1”, but varies in the range [0, 1]. In our implementation,the output is 1 if the value is above the threshold 0.5, and 0 for other values. In order to generate the best solution for the decision-making task, we used a floating point genetic algorithm (GA).
4.Results
4.1 Selected Features from Hippocampal and Striatal LFPs
Firstly, we pre-processed all the recorded LFPs data and removed the bad data. As described above, we focused on the decision-making process and analyzed the one second time window LFPs data in each Y-junction, 0.5 s before and after the event. In this paper, we considered the cases when the rat made a correct and/or a wrong choice. The average value of each feature for all sessions and then for all animals was calculated.
As shown in Figs. 11, 12, and 13, we found a dominant theta (7 Hz to 11 Hz) and beta (15 Hz to 20 Hz) ranges oscillation in hippocampal LFPs, in all Y-junctions, and for correct and wrong choices. In the other hand, in dorsolateral striatum we did not find any dominance of theta or beta oscillation, except for the case when the animal performed a wrong choice, we found a boost in the theta oscillation.
There were marked contrasts between the left and right hippocampal LFPs power in all the Y-junctions, for correct and wrong choices. Along with this, during the decision-making epoch in the 1st and 2nd Y-junctions of the maze, the peak frequency of the hippocampal beta oscillation significantly changed from 17.58 Hz to 18.55 Hz for the correct and wrong choices. In all the experiment sessions, animals performed always a correct choice on the 3rd Y-junction, as shown in Fig. 13.
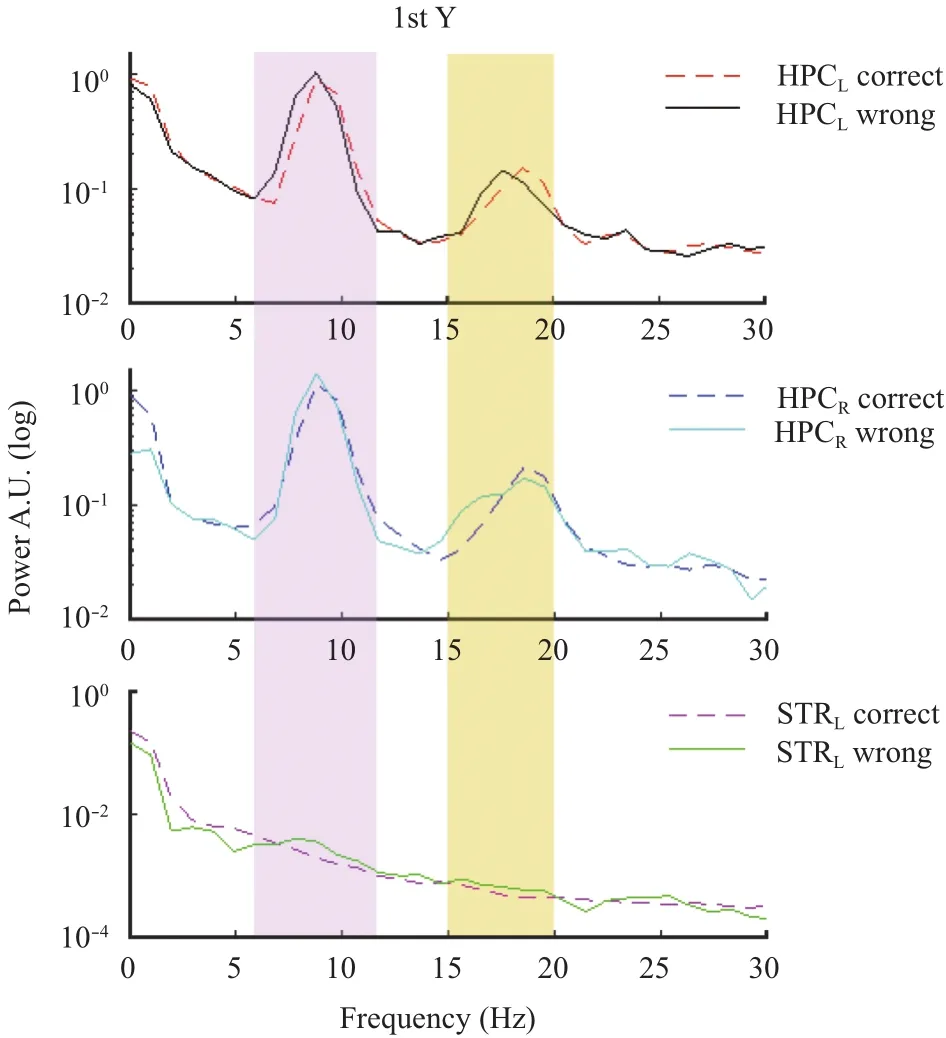
Fig. 11. Hippocampal and striatal power representations for correct and wrong choices in the 1st Y-junction.

Fig. 12. Hippocampal and striatal power representations for correct and wrong choices in the 2nd Y-junction.
All the dorsolateral striatum power spectra are shown as logarithmic representations because of the very small amplitude of the LFP oscillation founded in striatum. In our implementation, for each recording site (HPCL—hippocampus left side, HPCR—hippocampus right side, and STRL—striatum left side), we selected the peak frequency values and the mean power values of the theta oscillation for correct choices, as the input for the neural network.

Fig. 13. Hippocampal and striatal power representations for correct choices in the 3rd Y-junction.
4.2 Robot Navigation
The offline trained FFNN with the extracted LFPs features was used to control the robot during the decision-making process.
Fig. 14 shows the robot motion during an experiment trial where the robot reached the reward location after three accurate decisions made by the neural controller in the Y-junctions.Fig. 14 (a) shows the robot in start position, ready to move forward. The robot detects the 1st Y-junction by its sensors and stops moving, as shown in Fig. 14 (b). Neural network 1 takes the decision to turn right, the robot turns right and moves forward. In Fig. 14 (c) is shown the robot position in the maze,navigating toward the reward location. The robot detects the 2nd Y-junction by its proximity sensors and stops moving forward, as shown in Fig. 14 (d). Neural network 2 takes the decision to turn left. The robot turns left and moves forward toward the next Y-junction, as in Figs. 14 (e) and (f). When the robot reaches the 3rd Y-junction, neural network 3 takes the decision to turn left. It turns left and moves toward the reward location, as in Fig. 14 (g). Fig. 14 (h) shows the completed task by the robot. It reaches the reward location by using the animal LFPs features and its own external sensors.
5.Conclusions
In this paper, we introduced a novel method for robot navigation based on the animal’s brain activity. Our method is based on the distinctive features of the hippocampal and striatal LFPs, noticed during the animal’s decision-making process. In addition, we showed how these features can be used to control the robot in order to perform the same decisions as animals do.

Fig. 14. Robot decision-making and motion during one experiment trial: (a) in start position, (b) detecting the 1st Y-junction, (c) in the maze, (d) detecting the 2nd Y-junction, (e) turning left, (f) moving forward, (g) reaching the 3rd Y-junction, and (h) completing task.
The presented method used the real neural network, animal brain, and artificial intelligence. In addition, the robot learned to integrate the internal states with the external sensors, in order to perform reliable navigation in the multiple Y-maze. In the future, we plan to develop an algorithm that can be easily modified for different types of robots and environments.
[1]B. Hofmann-Wellenhof, K. Legat, and M. Wieser,Navigation: Principles of Positioning and Guidance, New York: Springer-Verlag Wien, 2003, pp. 5-6.
[2]Wikibooks contributors,Robotics/Navigation/Localization,The Free Textbook Project, 2016.
[3]G. Capi, M. Kitani, and K. Ueki, “Guide robot intelligent navigation in urban environments,”Advanced Robotics, vol.28, no. 15, pp. 1043-1053, 2014.
[4]G. Capi, “A vision based approach for intelligent robot navigation,”Intl. Journal of Intelligent Systems Technologies and Applications, vol. 9, no. 2, pp. 97-107, 2010.
[5]B. Hua, E. Rama, G. Capi, and M. Jindai, “A human-like robot intelligent navigation in narrow indoor environments,”Intl. Journal of Information and Electronics Engineering,vol. 6, no. 5, pp. 308-312, 2016.
[6]T. Oshima, M. Li, E. Rama, and G. Capi, “Intelligent robot navigation for surveillance behavior—A remote based approach,” inProc. of IEEJ Intl. Workshop on Sensing,Actuation,Motion Control,and Optimization, 2016, pp. 1-4.
[7]M. Mano and G. Capi, “An adaptive BMI based method for real time wheelchair navigation,”Intl. Journal of Innovative Computing, Information and Control, vol. 9, no. 12, pp.4963-4972, 2013.
[8]G. Capi, “Real robots controlled by brain signals—A BMI approach,”Intl. Journal of Advance Intelligence, vol. 2, no.1, pp. 25-35, 2010.
[9]N. Birbaumer, N. Ghanayim, T. Hinterberger,et al., “A spelling device for the paralyzed,”Nature, vol. 398, no.6725, pp. 297-298, 1999.
[10]F. Piccioneet, F. Giorgi, P. Tonin,et al., “P300-based brain computer interface: Reliability and performance in healthy and paralyzed participants,”Clinical Neurophysiology, vol.117, no. 3, pp. 531-537, 2006.
[11]B. J. Lance, S. E. Kerick, A. J. Ries, K. S. Oie, and K.McDowell, “Brain-computer interface technologies in the coming decades,”Proc. of the IEEE, vol. 100, pp. 1585-1599, May 2012.
[12]S. Halder, D. Agorastos, R. Veit,et al., “Neural mechanisms of brain-computer interface control,”Neuro Image, vol. 55,no. 4, pp. 1779-1790, 2011.
[13]M. A. Lebedev and M. A. L. Nicolelis, “Brain-machine interfaces: Past, present and future,”TRENDSin Neurosciences, vol. 29, no. 9, pp. 536-546, 2006.
[14]C. R. Gallistel, “The organization of learning,”Journal of Cognitive Neuroscience, vol. 3, no. 4, pp. 382-384, 1991.
[15]A. S. Etienne, R. Maurer, J. Berlie,et al., “Navigation through vector addition,”Nature, vol. 396, no. 6707, pp.161-164, 1998.
[16]A. S. Etienne, R. Maurer, and V. Seguinot, “Path integration in mammals and its interactions with visual landmarks,”The Journal of Experimental Biology, vol. 199, no. 1, pp. 201-209, 1996.
[17]S. J. Shettleworth,Cognition,Evolution,and Behavior, New York: Oxford University Press, 1998.
[18]E. Rama, G. Capi, S. Mizusaki, N. Tanaka, and S. Kawahara,“Effects of environment changes on rat’s learned behavior in an elevated Y-maze,”JournalofMedicaland Bioengineering, vol. 5, no. 2, pp. 113-118, 2016.
[19]E. Rama, G. Capi, N. Tanaka, and S. Kawahara, “Rat’s spatial learning in an novel elevated Y-Maze,” inProc. of the5th Annual Intl. Conf. on Cognitive Behavior Psychology,2016, pp. 140-145.
[20]F. Mondada, M. Bonani, X. Raemy,et al., “The e-puck, a robot designed for education in engineering,” inProc. of the 9th Conf. on Autonomous Robot Systems and Competitions,2009, pp. 59-65.
[21]J. Hubert and Y. Weibel. (November 2008).ePic2.Documentation. [Online]. Available: http://www.epuck.org/index.php?option=com_phocadownload&viewcate gory&id12:programs&Itemid38
杂志排行

Journal of Electronic Science and Technology的其它文章
- Multi-Reconfigurable Band-Notched Coplanar Waveguide-Fed Slot Antenna
- Pairing-Free Certificateless Key-Insulated Encryption with Provable Security
- Overview of Graphene as Anode in Lithium-Ion Batteries
- High Power Highly Nonlinear Holey Fiber with Low Confinement Loss for Supercontinuum Light Sources
- Modeling TCP Incast Issue in Data Center Networks and an Adaptive Application-Layer Solution
- Message from JEST Editorial Committee