Im proved Land Use and Leaf Area Index Enhances WRF-3DVAR Satellite Radiance assimilation:A Case Study Focusing on Rainfall Simulation in the Shule River Basin during July 2013
2018-04-08JunhuaYANGZhenmingJIDeliangCHENShichangKANGCongshenFUKeqinDUANandMiaogenSHEN
Junhua YANG,Zhenm ing JI,Deliang CHEN,Shichang KANG,7,Congshen FU,Keqin DUAN,and Miaogen SHEN
1State Key Laboratory of Cryospheric Sciences,Northwest Institute of Eco-Environment and Resources,Chinese Academy of Sciences(CAS),Lanzhou 730000,China
2School of Atmospheric Sciences,Sun Yat-sen University,Guangzhou 510275,China3Department of Earth Sciences,University of Gothenburg,Gothenburg 40530,Sweden
4Yale School of Forestry and Environmental Studies,Yale University,New Haven,Connecticut 06511,USA
5College of Tourism and Environment,Shaanxi Normal University,Xi’an 710000,China6Key Laboratory of Alpine Ecology and Biodiversity,Institute of Tibetan Plateau Research,Chinese Academy of Sciences,Beijing 100101,China
7CAS Center for Excellence in Tibetan Plateau Earth Sciences,Beijing 100101,China
1. Introduction
Accurate forecasting of precipitation is very important for water resource and flood regulation in arid regions,such as northwestern China and the Tibetan Plateau,where meteorological and hydrological observations are scarce.With the rapid development of satellite remote sensing technology,numerical weather prediction(NWP)models have been able to produce skillful precipitation predictions with high spatial and temporal resolutions over remote regions by directly assimilating satellite radiance data.The direct assimilation method could be highly beneficial for improving the quality of initial fields used in numerical models.The first use of the variational method to directly assimilate atmospheric detector data occurred in the 1990s,which triggered great interest in the utilization of satellite radiance data in numerical forecasts(Eyre,1989;Eyre et al.,1993).Since the 3D/4DVAR(three-/four-dimensional variational)methods combined with rapid radiation transfer models showed that variation direct assimilation was superior to inversion assimilation(Andersson et al.,1994),the direct assimilation of satellite radiance has become widely used in the forecasting of heavy rain,hurricanes,and tropical cyclones(Bauer et al.,2006;Rakesh et al.,2009;Sokol,2009;Routray et al.,2010;Singh et al.,2011;Xiong et al.,2013).
Despite the obvious benefit,only about 5%of available satellite data are currently used in assimilation systems because of the influence of inaccurate land surface information(Stensrud et al.,2009).To minimize the negative influence of inaccurate surface information on satellite radiance assimilation,previous studies(Sokol,2011;Zheng et al.,2012)have sought to remove data from surface-sensitive low-level channels,resulting in a reduction of the utilization of satellite data.Therefore,the key to increased usage of satellite data in assimilations lies in new ways to improve the quality of land surface information.
The land surface in northwestern China is characterized by a complex and diverse structure and inhomogeneous distribution,which has a considerable influenc on the atmospheric boundary layer(Gao et al.,2007).NWP models are currently coupled with land surface models that represent land surface processes in detail and describe energy and water fluxes with realistic land surface parameters.Previous studies have demonstrated the importance of accurate initialization of land surface parameters in mesoscale models(Chen et al.,1997;Chen and Dudhia,2001;Cassardo et al.,2002;Gao et al.,2008;Santos-Alamillos et al.,2015).He et al.(2011)investigated the effects of surface temperature and emissivity in the assimilation of AMSU-A data and indicated that improved quality in land surface parameters from the Microwave Surface and Precipitation Products System could significantly improve model simulations.This improvement was associated with more accurate land-surface skin temperatures that provided more observations for use in the assimilation system.Zheng et al.(2012)provided evidence that more accurate daily land surface temperatures could increase the utilization of satellite data in the WRF-3DVAR assimilation system and reduce the simulated bias in arid areas through the NCEPGFS model.Ina recent study,Gaoetal.(2017)quantified the roles played by land surface processes and large-scale dynamic forcing in dynamic downscaling over the Tibetan Plateau,which con firmed the critical role played by land surface processes.
In the current version of the Weather Research and Forecasting(WRF)model,the default land use and leaf area index information is derived from the 2001 MODIS-based data developed by Boston University(Friedl et al.,2002).However,the land surface conditions in northwestern China have changed in recent years due to climate change and human activities(Li et al.,2011).Therefore,we used updated MODIS data of land use and leaf area index in 2013 to improve the land surface information and then investigated the impact of the improved surface data on the performance of the WRF-3DVAR assimilation system for the Shule River Basin in July 2013 as a case study.
Following this introduction,section 2 introduces the data and methods used in the study.In section 3 we present the results with regard to the impacts of the land use and leaf area index data on the assimilated satellite radiance from different channels,as well as the responses of the initial conditions and the simulated precipitation induced by the improved land surface data.Section 6 provides a summary and conclusions.
2. Data and methods
2.1. Study area and rainfall data
Figure 1a shows the location of the Shule River Basin,which is our study region.The region is characterized by a very dry climate,and precipitation is a crucial component of the regional hydrological cycle(Zhang et al.,2012).Data were collected from 43 observation sites to evaluate the performance of a cumulative rainfall simulation for July 2013.Precipitation at Laohugou station(elevation of 4200 m above sea level)was used to evaluate the model performance in simulating a heavy precipitation event that occurred on 13 July 2013.In addition,precipitation data from the China Meteorological Adm inistration were also used for comparison with the simulation.The China Precipitation Day Grid(CPDG;Shen et al.,2010a)dataset has a spatial resolution of 0.25°×0.25°and was produced using the optimal interpolation method based on daily precipitation from 2419 sites in China.The China Merge CMORPH Precipitation Hour Grid(CMCPHG,Shen et al.,2010b)dataset has a spatial resolution of 0.1°×0.1°,and was produced via integration of hourly precipitation at more than 30 000 automatic sites,along with CMORPH satellite retrieval precipitation.

Fig.1. Study area and model domains:(a)the Shule River Basin and 43 observation stations(dots);(b)the three domains for WRF modeling,of which the outermost(d01),middle(d02)and inner(d03)boxes have resolutions of 27,9 and 3 km,respectively(d03 covers the entire Shule River Basin).
2.2. Improvement of land surface characteristics
2.2.1.Land use information
The default land use data(Fig.2a)in WRF derive from the2001MODIS-based dataset(Friedletal.,2002).Here,we updated the land use data with the MODIS land cover classification from 2001 to 2013,including the 16-day synthesized MODIS enhanced vegetation index(EVI),the 223–230-day(no cloud)8-day synthesized surface reflectance,and the SRTM DEM digital elevation data.The updated MODIS land use has been proven to improve the simulation of the atmospheric boundary layer over the northeastern Tibetan Plateau(Yang and Duan,2016).
The specific procedure for producing the land use was based on the method of Xu et al.(2007).Firstly,we used the principal component transform to compress the EVI and surface reflectance data and calculate the degree of homogeneity for the first principal component.Then,we constructed a comprehensive data classification matrix consisting of the EVI principal component,reflectivity principal component,digital elevation data,and the degree of homogeneity.Next,we selected typical training areas for all types of ground features based on high-resolution Google Earth data and converted them into training samples corresponding to the MODIS data.Finally,we used the training samples to calculate the classification through the classification and regression tree algorithm in order to construct decision tree classifiers and obtained the land use classification for the study region.These updated MODIS-based land use data are shown in Fig.2b.The woody savanna areas in 2001 had degraded into open shrubland by 2013 in most parts of the study area.
2.2.2.Leaf area index
The default leaf area index data in the WRF model are calculated from the 2001 MODIS-based land use dataset,which does not represent the actual current situation over northwestern China.Therefore,we reconstructed the leafarea index in 2013 using new MODIS leaf area index data provided by the Land Process Distributed Active Archive Center of the United States Geological Survey(https://lpdaac.usgs.gov),following the procedure of Xu et al.(2016).These data are projected on a sinusoidal grid with a spatial resolution of 1 km.Each product included six datasets,shown in Table 1.
The steps in the reconstruction of the leaf area index were as follows:First,the projection was transformed and the spatial mosaic was converted into latitude and longitude coordinates.Then,the leaf area index data for the China region(18.17°–53.55°N,73.42°–135.03°E)were extracted.Second,to improve the practical use of the remote sensing inversion results,we removed the low values caused by cloud cover using harmonic analysis.If the original data had an invalid value(255)or if the absolute value of the difference between fitting values was greater than 0.5,the data were considered to be influenced by cloud and were replaced by the Harmonic Analysis of Time Series(HANTS) fitting values.Finally,we transformed the original eight-day synthesized leaf area index data to monthly average data.Figures 2c and d show the spatial distribution of leaf area index for July 2001 and 2013,respectively.The leaf area index in 2013 in the west of the study area had decreased significantly compared with 2001,which is indicative of land degradation and is consistent with the conclusion of previous studies(Dai et al.,2010;Zheng et al.,2010).
2.3. Model setup and experimental design
2.3.1.Model setup and forcing data
The modeling experiments in this study were performed using the Advanced Research version of the WRF model,version 3.6.WRF is a non-hydrostatic,prim itive-equation,mesoscale meteorological model with advanced dynamics,physics,and numerical schemes(Skamarock et al.,2005).Details of the model are available at http://www.mmm.ucar.edu.The model domains are in a Lambert projection and triple-nested with horizontal resolutions of 27 km(67×61),9 km(85×76),and 3 km(112×100)(Fig.1b).Each domain has 28 vertical pressure levels,with the top level set at 50 hPa.As shown in Fig.1b,domain d03 covered the entire Shule River Basin.The physical parameterization schemes used were as follows:Purdue Lin microphysical parameterization(Chen and Sun,2002);Rapid Radiative Transfer Model longwave radiation(Mlawer et al.,1997);Dudhia shortwave radiation(Dudhia,1989);Noah land surface(Chen et al.,1997);Mellor–Yamada–Janjic planetary boundary layer scheme(Schaefer,1990);and Grell–Devenyi(GD)cumulus scheme(Grell and D´ev´enyi,2002).The selection of these physical parameterizations followed He et al.(2012),who demonstrated that this selection performs well when modeling heavy precipitation over the Tibetan Plateau.Additionally,we designed two experiments to test the simulation sensitivity of the GD cumulus scheme in domain d03(3 km).As shown in Fig.S1 in the Electronic Supplementary Material(ESM),the cumulus scheme greatly influenced the precipitation pattern,and the simulation with the GD scheme presented more consistency with observations(Fig.S2 in ESM).Therefore,the cumulus scheme was also used in the innermost domain.
The initial and boundary conditions necessary to run the WRF model are the NCEP–NCAR Final Analysis data with 1°×1°grid resolution.The simulation started at 0800 UTC 28 June 2013,and the first 56 h were used for model spin-up time.The assimilation time was at 0000 UTC 30 June 2013.It is important to note that the satellite radiance data at 0000 UTC 30 June were spliced by the satellite data from 2100 UTC 29 June to 0300 UTC 30 June,not only at 0000 UTC 30 June.
2.3.2.3DVAR data assimilation,experimental design and satellite data


Table 1. Datasets in the leaf area index product.
The 3DVAR system developed by Barker et al.(2004)was used in this study.Variational data assimilation achieves better results through the iterative minimization of a prescribed cost function(Ide et al.,1999):wherexxxis the analysis variable that minimizes the cost functionJ(xxx),xxxbis the background variable,yyy0stands for the assimilated observation,andyyy=HHH(xxx)is the derived observation from the analysisxxxby the observation operatorHHHfor comparison againstyyy0.The solution of the cost function shown by Eq.(1)represents the a posteriori maximum likelihood estimate of the true atmospheric state,giving a priori data for the first guessxxxband the observationyyy0.The fi t to individual observation points is weighted by the estimates of background error covarianceBBBand observation error covariance matrixRRR.The performance of the data assimilation system largely depends on the plausibility of the background error covarianceBBB.
In this study,the Community Radiative Transfer Model(CRTM;Weng et al.,2005)was used to calculate the radiances for AMSU-A and-B data.The selection CRTM scheme is controlled by as implepara meter RTM OPTION(2 for CRTM)in the namelist file.The“CV5”background error option in the WRF-3DVAR system was used,which uses the control variables of stream function,unbalanced temperature,unbalanced potential velocity,unbalanced surface pressure,and pseudo-relative humidity,generated via the National Meteorological Center method(Parrish and Derber,1992).We designed a single point assimilation experiment to analyze the effect of background error covariance on the analysis increment.As shown in Fig.S3 in the ESM,the temperature increment from single point assimilation experiment at 12th pressure level was mainly distributed in concentric circles.
The WRF-3DVAR system was used to assimilate the AMSU-A and AMSU-B satellite radiance data in our research.For the AMSU-A data,the radiance data in channels 11,12,13 and 14 were not used for assimilation because the peak energy heights of those channels are 20 hPa,10 hPa,5 hPa and 2 hPa respectively,which were above the top of the model simulation.We therefore chose 11 other channels,among which channels 1,2,3 and 15 are sensitive to land surface conditions.In the AMSU-B data,we selected all five channels,among which channels 1 and 2 are surfacesensitive.Strict quality control procedures were implemented before assimilation.The quality control method was as follows:(1)If the brightness temperature values detected by the AMSU microwave radiometer were not in the range of 150–300 K,these data were removed;(2)if the deviation between measured and simulated(by the background field)radiance brightness temperature was three or more times greater than the observation errors,the data were excluded in the assimilation system;and(3)AMSU data were thinned to improve observation usage by selecting one observation value from every seven.Additionally,the variational bias correction method was used in this study to correct the system error of observed satellite radiance.
In this study,we set 0000 UTC 30 June 2013 as the radiance assimilation time,and the assimilation time window was 3 h.Four sets of experiments were conducted for the three domains.As shown in Table 2,the model simulation with the default land use and leaf area index without data assimilation was referred to as the control(CTRL)experiment,while thatwith the surface data of the updated land use and leaf area index but without assimilation was marked as the MODS experiment.The experiment in which AMSU-A and-B radiance data were assimilated with the default land use and leaf area index was referred to as TONG.Finally,the assimilation of AMSU-A and-B radiances with the improved land surface data was called the TOUN experiment.The differences between CTRL and the other three experiments provide us with information about the effects of the land use and AMSU-A and-B radiance on the simulations,which are compared with observations.

Table 2. Experimental design.
3. Results and discussion
3.1. Impact of improved land surface information on satellite radiance utilization
This section provides a comparative analysis of how the modified land use and leaf area index dataset improves the effect of the utilization of satellite radiances in the WRF-3DVAR assimilation system.We calculated the statistics at 0000 UTC 30 June 2013.The data assimilation process describes atmospheric conditions by fusing and statistically optimizing all known information(including simulations and observations)(Li et al.,2016).In this study,satellite observations of radiation were defined as the observation field and simulated radiation(via the radiative transfer model)as the background field.The difference between the observation field and the background field was termed OMB(observation minus background).If the OMB values were too large,the satellite observations were rejected from entering the assimilation system.The aim of this procedure was to reduce the OMB values and provide more information in surfacesensitive channels that were able to pass the deviation test and get used by the assimilation system.We used channels 3(sensitive to land surface)and 7(not sensitive to land surface)to compare the impact of the modified land use and leaf area index data on OMB.
Figure 3 shows scatterplots of the observed and simulated brightness temperatures in the TONG and TOUN experiments.For channel 3,compared with the modeled brightness temperature in TONG(Fig.3a),the simulated values in TOUN were closer to the observations(Fig.3b).Use of the 2013 land cover condition in the model system removed part of the fairly large underestimation of the temperature when the 2001 land cover was used[the average deviation(AD)was reduced from−5.0 to−3.8 and the root-mean-square deviation(RMSD)was reduced from 6.1 to 4.8].This occurred because the vegetation index was lower in 2013 compared with 2001 because of land degradation,as shown inFig.2.The reduced vegetation index would have resulted in deceased canopy conductance and latent heat flux and increased sensible heat flux and ground heat flux.Therefore,the modeled surface temperature and brightness temperature were increased via the radiative transfer model in the surfacesensitive low-level channels(e.g.,channel 3).For channel 7(not a surface-sensitive channel),compared with the case using the original land use and leaf area index(Fig.3c),the simulated brightness temperature did not change much as a result of the new land cover and leaf area index(Fig.3d).

Fig.3. Scatter plots between the observed and simulated brightness temperature for(a)channel 3 in the TONG experiment,(b)channel 3 in the TOUN experiment,(c)channel 7 in the TONG experiment,and(d)channel 7 in the TOUN experiment.The dotted lines are the 1:1 lines.
Figure 4 shows a histogram of the bias between the observed and simulated brightness temperature in channel 3.Although the patterns of OMB were similar between TONG and TOUN,the quantities of OBM from−4 to 4 K in TOUN(Fig.4a)were much lower than those in TONG(Fig.4b).The improved land use and leaf area index dataset increased the satellite radiance utilization by 23%.We also present the spatial scatter distribution of the assimilated radiance brightness temperature in channel 3(Fig.S4).Compared with the TONG experiment(Fig.S4a in the ESM),more satellite data were used in the TOUN experiment(Fig.S4b).Additionally,we designed a continuous assimilation system to assimilate more satellite radiance at different times,as shown in Fig.S5 in the ESM.More satellite data in the surface-sensitive channel 3 were also utilized at 0600 UTC 30 June in the TOUN experiment,and the initial field was further changed by the continuous assimilation(Fig.S6 in the ESM).
In short,both the scatterplots and the histogram distributions show that the simulated brightness temperature was closer to observations in the surface-sensitive low-level channels when using the new land use and leaf area index data,which made it possible to include more satellite data in the assimilation system in a sensible and meaningful way.
3.2. Effect of the improvement of satellite radiance utilization on the model initial field
3.2.1.AD and RMSD
Figure 5 shows the AD and RMSD of the initial temperature between CTRL and the three sensitivity experiments across all the vertical levels used in the model.As shown in Fig.5a,compared with the CTRL experiment,the modification of initial temperature in the MODS experiment was much less than that in the TONG and TOUN experiments,and the MODS experiment consistently had a slight cooling effect on the original temperature field.The average deviation in TONG was not completely consistent with that of TOUN.In both experiments,the satellite data assimilation had a cooling effect in the lower(levels 1–10)and upper(levels 19–27)troposphere,but a warming effect in the middle troposphere(levels 12–18).In addition,as shown in Fig.5b,the RMSD between the three sensitivity experiments and CTRL in the middle troposphere(levels 11–21)was relatively small compared with those in the other vertical levels,which suggests that the modification of initial temperature occurred mainly in the lower and upper troposphere.Furthermore,compared with CTRL,the modification of initial temperature in TOUN was larger than that in TONG.

Fig.4. Histogram of the bias between the observed and simulated brightness temperatures for channel 3 in the TONG and TOUN experiments.
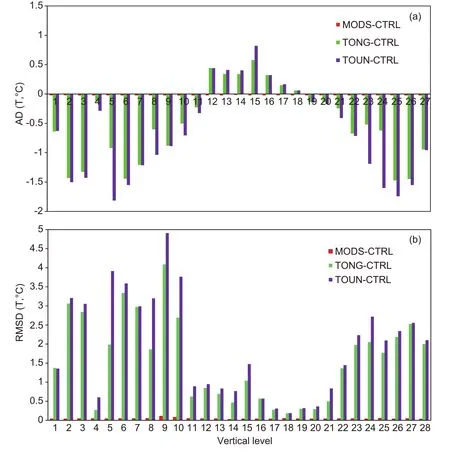
Fig.5. The(a)average deviation(AD)and(b)root-mean-square deviation(RMSD)between the temperatures in the sensitivity and the control experiments at all vertical levels.
The average deviation of theU-andV-wind fields between the sensitivity experiments and CTRL at all vertical levels(Figs.6a and c)shows that,compared with CTRL,the modification in MODS was much lower than that in TONG and TOUN.Specifically,the TONG and TOUN experiments had positiveU-andV-wind deviations in the lowest(1–8)and uppermost(25–27)levels;however,U-wind deviations were positive(Fig.6a)andV-wind deviations were negative(Fig.6c)in the middle levels(14–17).In addition,according to the RMSD between the sensitivity experiments and CTRL in Figs.6b and d,the modification of the wind field was clearly larger than the modification of temperature in the middle levels.Specifically,the modification occurred mainly in the middle levels forU-wind(Fig.6b)and in the middle and upper levels forV-wind(Fig.6d).In the lower levels(1–10),the RMSD in the three sensitivity experiments was nearly zero forU-wind but was much larger forV-wind.
In summary,the two experiments that assimilated satellite radiance had a greater influenc on the initial fields than the experiment using only the modified land use and leaf area index.Additionally,the modification ofU-andV-wind in TOUN was similar to that in TONG,whereas the modification of potential temperature was much larger in TOUN than in TONG.
3.2.2.Spatial deviation distribution
Figure 7 shows the distributions of temperature and relative humidity(RH)compared with the background field in the CTRL experiment at 500 hPa.It is clear that the deviations of temperature and RH in MODS were much lower than those in TONG and TOUN.TONG and TOUN had large positive deviations for temperature and RH in the western part of the study area,and the largest values were as high as 5 K for temperature(Figs.7c and e)and 20%for RH(Figs.7d and f).The greater temperature and RH in the initial fields of TONG and TOUN led to larger precipitation in the western part of the study area.In the southeastern part of the study region,TONG and TOUN showed slight negative deviations in temperature and RH with respect to CTRL,but the deviation for TOUN was smaller.The cooler and drier initial field in the TONG experiment in the southeastern part of the study area resulted in lower precipitation compared with that in TOUN.Moreover,we compared the initial temperature from different experiments with ERA-Interim data.As shown in Fig.S7 in the ESM,the temperature at 500 hPa in TOUN(Fig.S7b)was closer to the ERA-Interim data,and the CTRL experiment presented an overestimate of temperature compared with this dataset.
In summary,the modification of temperature and RH at 500 hPa was not obvious when using the modified land use and leaf area index data,but the assimilation of the satellite radiance data led to greater modifi cations for temperature and RH,which made the initial field warmer and wetter in the western part of the region and cooler and drier in the eastern part.
3.3. Improvement in the simulated precipitation
3.3.1.Spatial distribution
Figure 8 shows the cumulative rainfall distribution from the four WRF experiments and two observational datasets,CPDG and CMCPHG,from the China Meteorological Adm inistration.The cumulative rainfall in the CPDG dataset was concentrated mainly in the eastern Shule River Basin(Fig.8a),and the precipitation intensity in the CMCPHG dataset was greater in the western part of the domain(Fig.8b).Meanwhile,the WRF simulation experiments showed subtler orographic features,such as high precipitation along the southern high-altitude mountain area(Figs.8c–f),the characteristics of which could not be represented well by the interpolated observations,especially CPDG,with coarser grids.Compared with gauge data from 43 sites,the WRF simulation experiments represented the spatial distribution of precipitation better(R2>0.4;Table 3)than the CPDG dataset(R2=0.38;Fig.S8 in the ESM).Previous research demonstrates that coarse-grid observational data may be unreliable in some unpopulated regions(Ji and Kang,2013;Ji et al.,2016).Among the simulation experiments,the rainfall area in CTRL(Fig.8c)was similar to that in MODS(Fig.8d),but the precipitation intensity in MODS was much lower than that in CTRL.In the western portion of the region,the precipitation intensity was lower in TONG(Fig.8e)and TOUN(Fig.8f)than in CTRL or MODS.Moreover,compared with TONG,the precipitation intensity and area clearly varied in TOUN as a result of the updated land use and leaf area index data.
Rain gauge data from 43 sites were used to evaluate the modeled cumulative rainfall in July(Fig.9).Five observation sites in the southeast high-altitude area(green triangles)lay above they=xline in the CTRL and MODS experiments(Figs.9a and b).After satellite radiance assimilation,rainfall simulations in the TONG and TOUN experiments(Figs.9c and d) fitted the observations more closely at the high-altitude sites.For the simulation at the five sites on the piedmont low-altitude plain(red triangles),all four model experiments showed a close fit to observations.
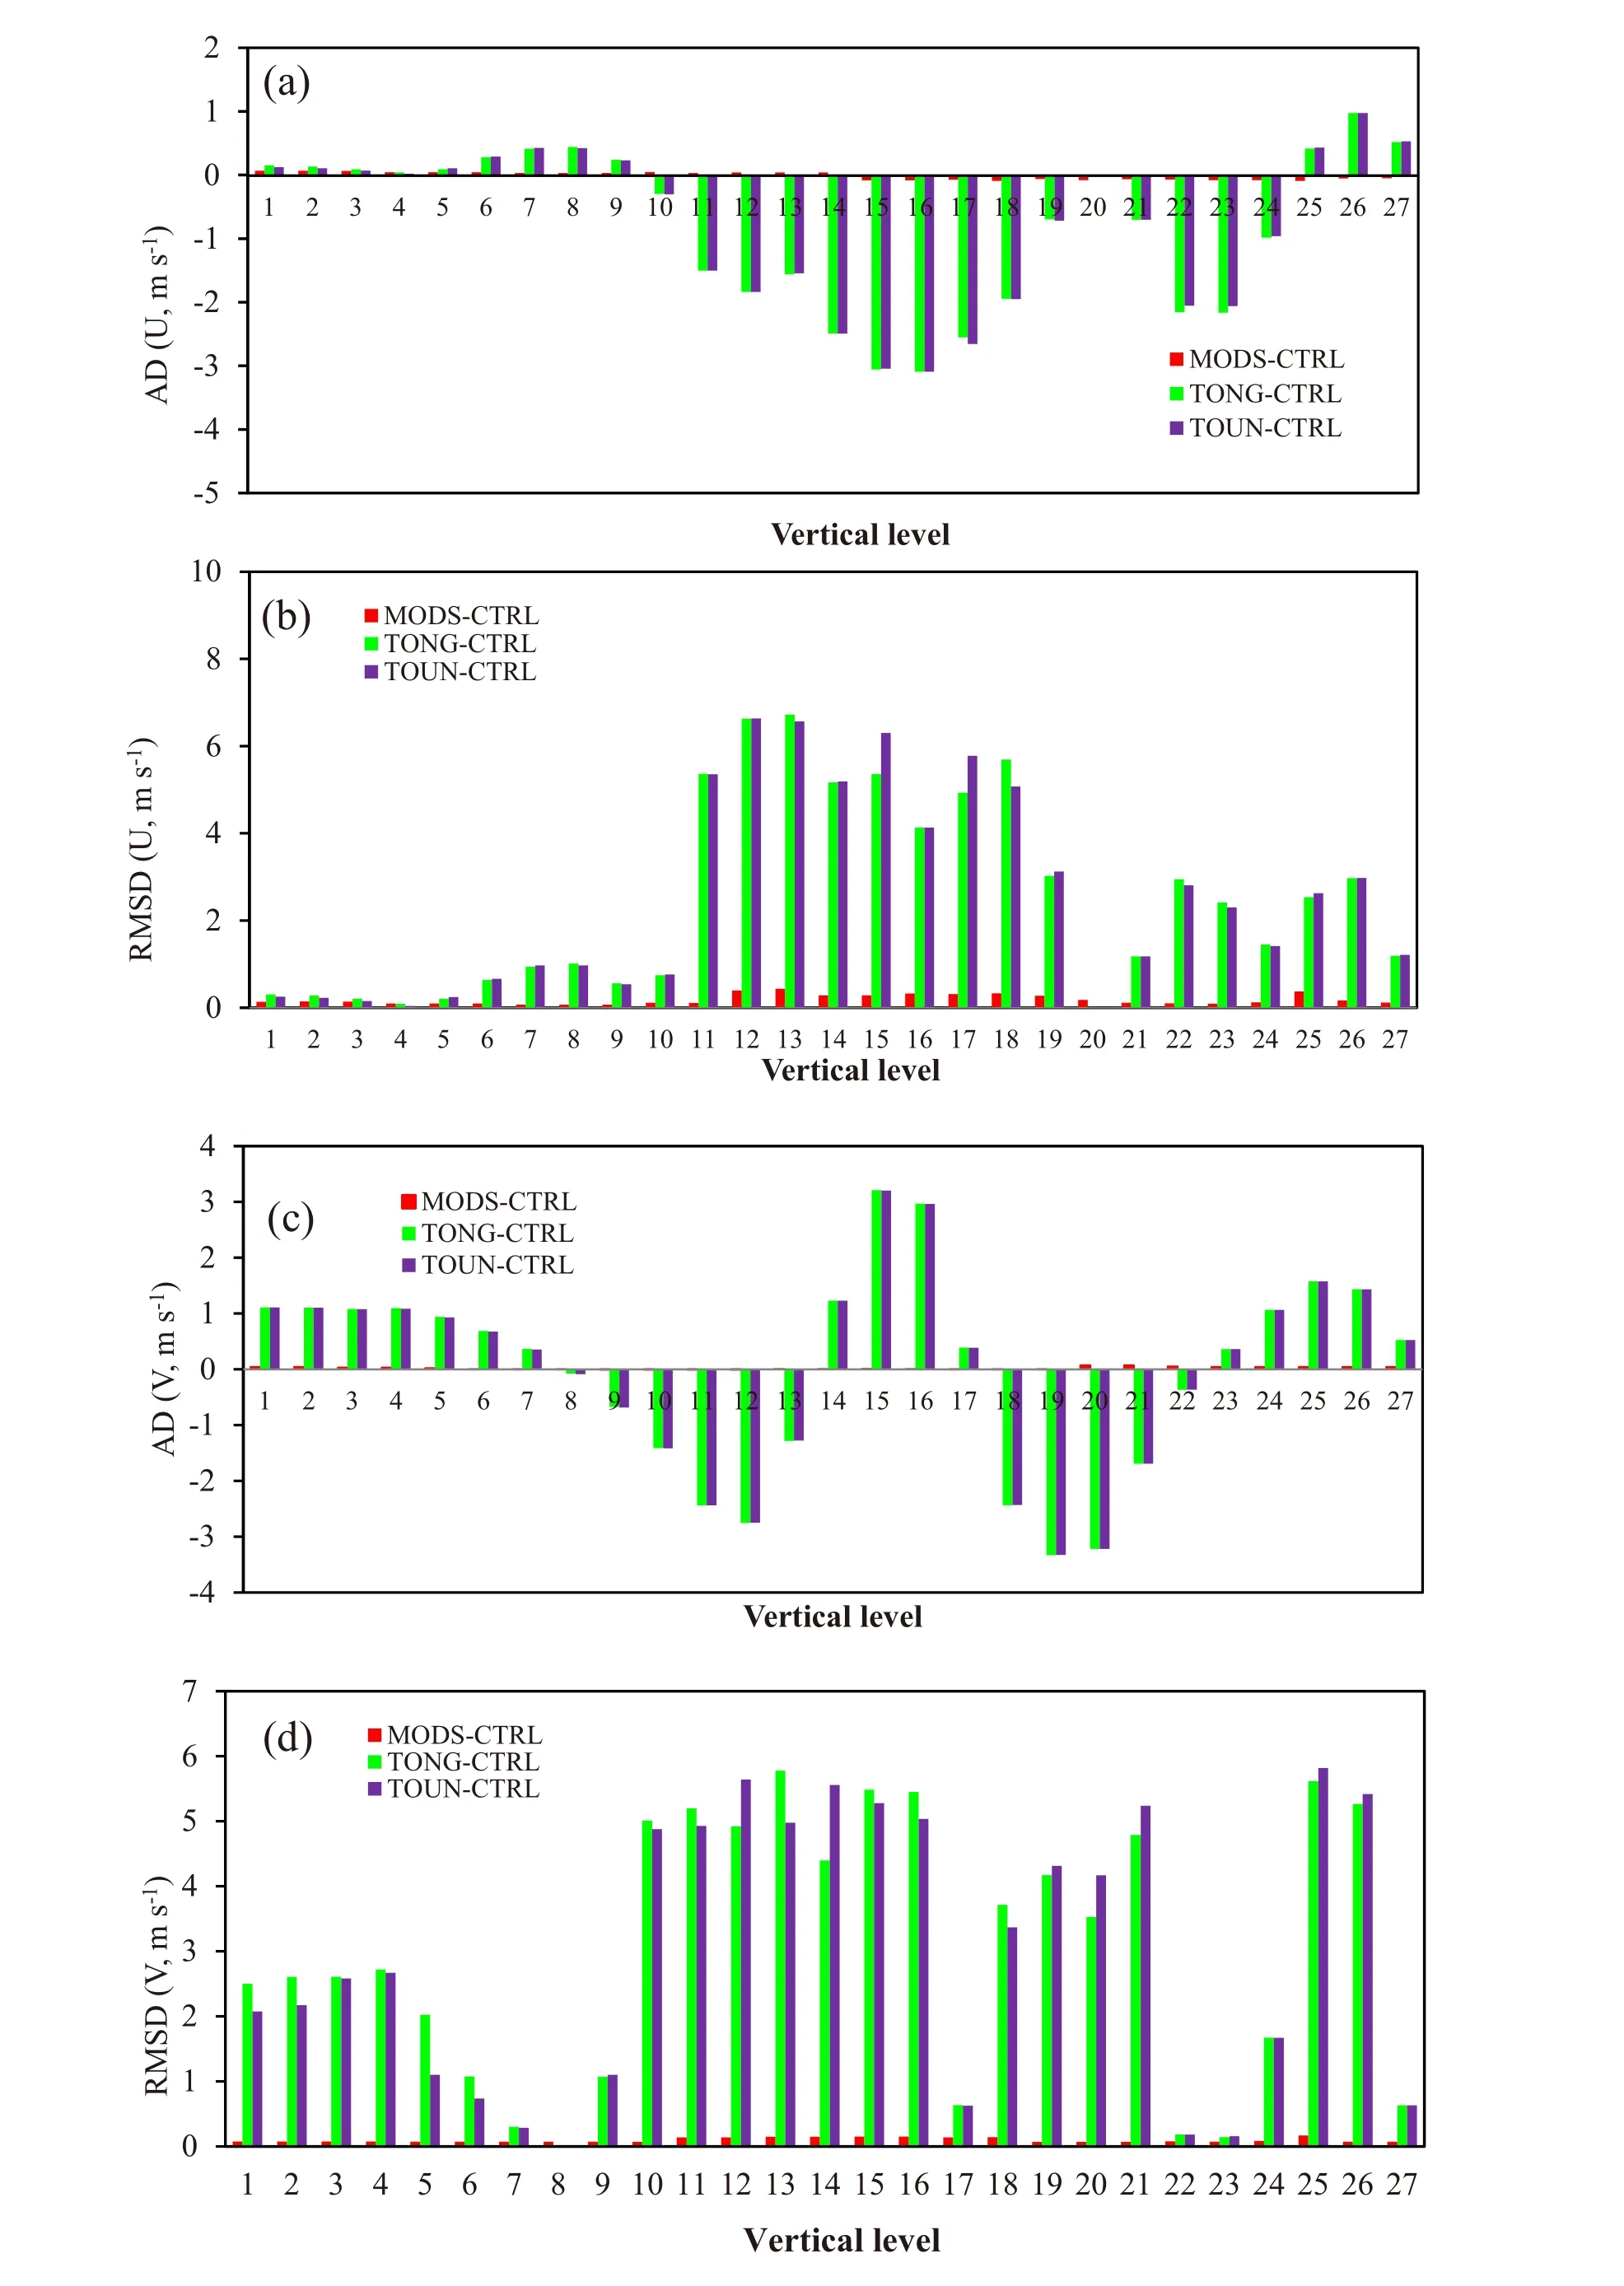
Fig.6. The(a)average deviation(AD)for U-wind,(b)root-mean-square deviation(RMSD)for U-wind,(c)AD for V-wind,and(d)RMSD for V-wind,between the adjusted and original initial fields at all vertical levels.

Fig.7. Distribution of temperature(T;units:°C)and relative humidity(RH;units:%)compared with the CTRL experiment at 500 hPa:(a)MODS minus CTRL(T);(b)MODS minus CTRL(RH);(c)TONG minus CTRL(T);(d)TONG minus CTRL(RH);(e)TOUN minus CTRL(T);(f)TOUN minus CTRL(RH).
To summarize,compared with the CPDG dataset,the CTRL and MODS experiments clearly overestimated cumulative precipitation in the southeastern high-altitude mountain area.Table 3 lists the results of a statistical comparison between the measured and simulated precipitation.The CTRL experiment had the lowestR2and the maximum RMSD of all the numerical experiments,whereas the TOUN experiment had the largestR2and lowest RMSD.Compared with the MODS experiment,theR2in the TONG experiment was higher by 0.1 and the RMSD lower by 5.9 mm.In short,assimilating satellite radiance and using modified land use and leaf area index data simultaneously showed the highest simulation precision for rainfall.Additionally,the simulation accuracy was greater in the experiment with assimilation than in the experiment with only modified land surface data.

Fig.8. Cumulative precipitation(units:mm)in July for(a)CPDG,(b)CMCPHG,(c)CTRL,(d)MODS,(e)TONG,and(f)TOUN.
3.3.2.Temporal variation of precipitation in a heavy precipitation event
A heavy rainfall event that occurred on 13 July 2013 was used to further analyze the impacts of the different experiments on temporal variations in precipitation.Figure 10 shows the six-hourly cumulative precipitation simulated by the four WRF experiments.From 0000 to 0600 UTC,the CTRL and MODS experiments had two precipitation centers in the eastern part of the study region(Figs.10a and e),while there was only one rainfall center in the TONG and TOUN experiments(Figs.10i and m).Moreover,the CTRL and MODS experiments had a greater precipitation area and intensity than the TONG and TOUN experiments.From 0600 to 1200 UTC,the simulated precipitation intensity was significantly reduced compared with that in the first six hours.In the CTRL and MODS experiments(Figs.10b and f),there were still two rainfall centers in the eastern part of the region.Compared with the CTRL experiment,the precipitation area with rainfall of more than 12.8 mm was larger in the MODS experiment in the southwest.Meanwhile,in the TOUN experiment(Fig.10j),the area with more than 6.4 mm of precipitation was augmented in the west compared with that in the TONG experiment(Fig.10n).From 1200 to 1800 UTC,precipitation occurred mainly in the southwest.The TONG(Fig.10k)and TOUN(Fig.10o)experiments,with assimilated satellite radiance,showed higher precipitation in the east(especially in the TOUN experiment)compared with the CTRL(Fig.10c)and MODS(Fig.10g)experiments.In ad-dition,the TOUN experiment had higher rainfall in the south than the TONG experiment.Over the six-hour period from 1800 to 2400 UTC,precipitation decreased significantly,especially in the TONG and TOUN experiments(Fig.10l and p).

Fig.9. Scatterplots between the measured and predicted rainfall at the observations sites for different experiments:(a)CTRL;(b)MODS;(c)TONG;(d)TOUN.Green triangles are high-altitude sites and red triangles are low-altitude sites.The dotted lines are the 1:1 lines.
Figure 11a shows the observed and simulated cumulative rainfall curves and the intensities at Laohugou station on 13 July 2013.The cumulative curve for the CTRL experiment was a poor fit to both the observations and the other three sensitivity experiments,and it overestimated the precipitation intensity in the first four hours.Although the cumulative curve for the MODS experiment performed better than CTRL,it overestimated the precipitation intensity from 0600 to 1200 UTC.The cumulative curve of the TOUN experiment was best in terms of its closeness to the observations,followed by that of the TONG experiment,in which precipitation intensities were underestimated from 1600 to 2000 UTC.Figure 11b shows the absolute error(AE)between the modeled and observed values,along with the precipitation intensity.The AEs for the CTRL and MODS experiments were relatively large compared with those for the TONG and TOUN experiments.The AEs of the TONG experiment were greater than those for the TOUN experiment,especially from 1600 to 2000 UTC.This suggests that the modified land use and leaf area index data improve the WRF-3DVAR simulation of precipitation with AMSU-A and-B radiance assimilation.
3.3.3.Analysis of the simulated rainfall differences

Fig.10. Six-hour cumulative precipitation(units:mm)(0000–0600,0600–1200,1200–1800 and 1800–2400 UTC 13 July 2013)simulated in the four experiments:(a–d)CTRL;(e–h)MODS;(i–l)TONG;(m–p)TOUN.
Figure 12 shows the mean vertical wind difference between the three sensitivity experiments and CTRL along 39°N in July 2013.The three sensitivity experiments had enhanced convection compared with that in the CTRL experiment.Compared with the MODS experiment(Fig.12a),there were greater increments of vertical motion in the TONG and TOUN experiments to the west of 96°30′E,(Figs.12b and c),where higher RH and temperature initial fields were located(Figs.7b and c).Therefore,the precipitation was larger there in these two simulations(Figs.8e and f).In addition,the increment of the upward wind in the TOUN experiment was obviously larger than that in the TONG experiment in the area west of 96°30′E,where the vegetation index clearly decreased.This indicates that enhanced vertical convection under improved satellite radiance utilization led to greater precipitation in the TOUN experiment than in the TONG experiment,which is consistent with the results in Figs.8e and f.
4. Summary and conclusions
In this study,we carried out a case study for the Shule River Basin during the period of July 2013 to test the effects of improved land use and leaf area index data on satellite radiance assimilation for rainfall prediction.Experiments using direct assimilation of microwave remote sensing data,AMSU-A and-B,were designed for the WRF mesoscale weather prediction model(version 3.6)and its 3DVAR system.We updated the land use and leaf area index data(underlying surface conditions)in the model to analyze the impact of these modifications on model simulations and the direct assimilation of satellite radiance.The main conclusions of this study are as follows:

Fig.11. Observed and simulated(a)cumulative rainfall(curves)and(b)absolute error(lower bars)at Laohugou station,13 July 2013(LST=UTC+8).The upper bars in both(a)and(b)show the rainfall intensity.
The land use and leaf area index in the study area changed from 2001 to 2013.Replacing the default land use and leaf area index data for 2001 with more realistic ones in 2013 led to an increased rate of satellite radiance utilization in the lowlevel channels that are sensitive to surface conditions.Additionally,the experiment with assimilation of satellite radiance under the improved land use and leaf area index showed the largest modification in the initial fields,causing the temperature and RH to be higher in the western region than in the other three experiments.For cumulative precipitation in July,the most accurate prediction was achieved in the TOUN experiment,which assimilated satellite radiance under the modified land use and leaf area index data,leading to greater precipitation in the region of the study area west of 96°30′E due to higher temperature,RH,and vertical convection.Further,compared with the observational dataset CPDG,all the WRF experiments showed finer described cumulative precipitation in this small watershed.In an analysis of the temporal distribution of precipitation during a heavy rainfall event that occurred on 13 July 2013,the cumulative precipitation curve for the TOUN experiment was closest to the measured values at Laohugou station.

Fig.12. Vertical wind(units:m s−1)in different experiments in July 2013:(a)MODS minus CTRL;(b)TONG minus CTRL;(c)TOUN minus CTRL.
In short,the modified land use and leaf area index data increased the satellite data utilization rate,and the data assimilation experiment built on this clearly improved the simulation of the WRF-3DVAR assimilation system for precipitation in this inland watershed.
A logical next step would be to test other more advanced assimilation techniques(e.g.,4DVAR,EnKF)with sim ilar experiments.These approaches have great potential,although computing speed and cost may present a challenge to their w ide implementation and use.
Acknowledgements.This study was supported by the National Key Research and Development Program of China(Grant No.2016YFA0602701),the National Natural Science Foundation of China(Grant Nos.41721091,41630754,91644225),and the Open Program(Grant No.SKLCS-OP-2017-02)from the State Key Laboratory of Cryospheric Science,Northwest Institute of Eco-Environment and Resources,Chinese Academy of Sciences.
Electronic supplementary material:Supplementary material is available in the online version of this article at https://doi.org/10.1007/s00376-017-7120-4.
Andersson,E.,J.Pailleux,J.N.Th´epaut,J.R.Eyre,A.P.McNally,G.A.Kelly,and P.Courtier,1994:Use of cloud-cleared radiances in three/four-dimensional variational data assimilation.Quar.J.Roy.Meteor.Soc.,120(517),627–653,https://doi.org/10.1002/qj.49712051707.
Barker,D.M.,W.Huang,Y.R.Guo,A.J.Bourgeois,and Q.N.Xiao,2004:A three-dimensional variational data assimilation system for MM 5:Implementation and initial results.Mon.Wea.Rev.,132(4),897–914,https://doi.org/10.1175/1520-0493(2004)132<0897:ATVDAS>2.0.CO;2.
Bauer,P.,P.Lopez,A.Benedetti,D.Salmond,S.Saarinen,and M.Bonazzola,2006:Implementation of 1D+4D-Var assimilation of precipitation-affected microwave radiances in precipitation at ECMWF.II:4D-Var.Quart.J.Roy.Meteor.Soc.,132(620),2307–2332,https://doi.org/10.1256/qj.06.07.
Cassardo,C.,G.P.Balsamo,C.Cacciamani,D.Cesari,T.Paccagnella,and R.Pelosini,2002:Impact of soil surface moisture initialization on rainfall in a limited area model:A case study of the 1995 South Ticino flash flood.Hydrological Processes,16(6),1301–1317,https://doi.org/10.1002/hyp.1063.
Chen,F.,and J.Dudhia,2001:Coupling an advanced land surfacehydrology model with the Penn State-NCAR MM 5 modeling system.Part I:Model implementation and sensitivity.Mon.Wea.Rev.,129(4),569–585,https://doi.org/10.1175/1520-0493(2001)129<0569:CAALSH>2.0.CO;2.
Chen,F.,Z.Janji´c,and K.Mitchell,1997:Impact of atmospheric surface-layer parameterizations in the new landsurface scheme of the NCEP mesoscale ETA model.Bound.-Layer Meteor.,85(3),391–421,https://doi.org/10.1023/A:1000531001463.
Chen,F.,J.Dudhia,Z.Janjic,and M.Baldw in,1997:Coupling a land surface model to the NCEP mesoscale Eta model.Preprints,13th Conf.on Hydrology,Long Beach,CA:Amer-ican Meteorological Society,99–100.
Chen,S.H.,and W.Y.Sun,2002:A one-dimensional time dependent cloud model.J.Meteor.Soc.Japan,80(1),99–118,https://doi.org/10.2151/jmsj.80.99.
Dai,S.P.,B.Zhang,H.J.Wang,Y.M.Wang,L.X.Guo,X.M.Wang,and D.Li,2010:Vegetation cover change and its driving factors over northwest China.Arid Land Geography,33(4),636–643,https://doi.org/10.13826/j.cnki.cn65-1103/x.2010.04.020.(in Chinese)
Dudhia,J.,1989:Numerical study of convection observed during the winter monsoon experiment using a mesoscale two-dimensional model.J.Atmos.Sci.,46(20),3077–3107,https://doi.org/10.1175/1520-0469(1989)046<3077:NSOCOD>2.0.CO;2.
Eyre,J.R.,1989:Inversion of cloudy satellite sounding radiances by nonlinear optimal estimation.II:Application to TOVS data.Quart.J.Roy.Meteor.Soc.,115(489),1027–1037,https://doi.org/10.1002/qj.49711548903.
Eyre,J.R.,G.A.Kelly,A.P.McNally,E.Andersson,and A.Persson,1993:assimilation of TOVS radiance information through one-dimensional variational analysis.Quart.J.Roy.Meteor.Soc.,119(514),1427–1463,https://doi.org/10.1002/qj.49711951411.
Friedl,M.A.,D.K.McIver,J.C.F.Hodges,X.Y.Zhang,D.Muchoney,A.H.Strahler,C.E.Woodcock,S.Gopal,A.Schneider,A.Cooper,A.Baccini,F.Gao,and C.Schaaf,2002:Global land cover mapping from MODIS:Algorithms and early results.Remote Sensing of Environment,83(1–2),287–302,https://doi.org/10.1016/S0034-4257(02)00078-0.
Gao,X.J.,D.F.Zhang,Z.X.Chen,J.S.Pal,and F.Giorgi,2007:Land use effects on climate in China as simulated by a regional climate model.Science in China Series D:Earth Sciences,50(4),620–628,https://doi.org/10.1007/s11430-007-2060-y.
Gao,Y.H.,F.Chen,M.Barlage,W.Liu,G.D.Cheng,X.Li,Y.Yu,Y.H.Ran,H.Y.Li,H.C.Peng,and M.G.Ma,2008:Enhancement of land surface information and its impact on atmospheric modeling in the Heihe River Basin,Northwest China.J.Geophys.Res.,113(D20),https://doi.org/10.1029/2008JD010359.
Gao,Y.H.,L.H.Xiao,D.L.Chen,F.Chen,J.W.Xu,and Y.Xu,2017:Quantification of the relative role of landsurface processes and large-scale forcing in dynam ic downscaling over the Tibetan Plateau.Climate Dyn.,48,1705–1721,https://doi.org/10.1007/s00382-016-3168-6.
Grell,G.A.,and D.De´ve´nyi,2002:A generalized approach to parameterizing convection combining ensemble and data assimilation techniques.Geophys.Res.Lett.,29,38-1–38-4,https://doi.org/10.1029/2002GL015311.
He,W.Y.,Z.Q.Liu,and H.B.Chen,2011:influenc of surface temperature and emissivity on AMSU-A assimilation over land.Acta Meteorologica Sinica,25(5),545–557,https://doi.org/10.1007/s13351-011-0501-1.
He,Y.,H.Yang,T.D.Yao,and J.He,2012:Numerical simulation of a heavy precipitation in Qinghai-Xizang plateau based on WRF model.Plateau Meteorology,31(5),1183–1191.(in Chinese)
Ide,K.,P.Courtier,M.Ghil,and A.C.Lorenc,1999:Unified notation for data assimilation:Operational,sequential and variational.J.Meteor.Soc.Japan,75,181–189,https://doi.org/10.2151/jmsj1965.75.1B 181.
Ji,Z.M.,and S.C.Kang,2013:Double nested dynamical downscaling experiments over the Tibetan Plateau and their projection of climate change under RCP scenarios.J.Atmos.Sci.,70(4),1278–1290,https://doi.org/10.1175/JAS-D-12-0155.1.Ji,Z.M.,S.C.Kang,Q.G.Zhang,Z.Y.Cong,P.F.Chen,and M.Sillanpaa,2016:Investigation of mineral aerosols radiative effects over High Mountain Asia in 1990-2009 using a regional climate model.Atmos.Res.,178–179,484–496,https://doi.org/10.1016/j.atmosres.2016.05.003.
Li,X.,M.J.Zeng,Y.Wang,W.L.Wang,H.Y.Wu,and H.X.Mei,2016:Evaluation of two momentum control variable schemes and their impact on the variational assimilation of radar wind data:Case study of a squall line.Adv.Atmos.Sci.,33(10),1143–1157,https://doi.org/10.1007/s00376-016-5255-3.
Li,Z.H.,Z.Q.Gao,W.Gao,R.H.Shi,and C.S.Liu,2011:Spatio-temporal feature of land use/land coverdynamic changes in China from 1999 to 2009.Transactions of the CSAE,27(2),312–322,https://doi.org/10.3969/j.issn.1002-6819.2011.02.054.(in Chinese)
Mlawer,E.J.,S.J.Taubman,P.D.Brown,M.J.Iacono,and S.A.Clough,1997:Radiative transfer for inhomogeneous atmospheres:RRTM,a validated correlated-k model for the longwave.J.Geophys.Res.,102(14),16 663—16 682,https://doi.org/10.1029/97JD00237.
Parrish,D.F.,and J.C.Derber,1992:The national meteorological center’s spectral statistical-interpolation analysis system.Mon.Wea.Rev.,120,1747–1763,https://doi.org/10.1175/1520-0493(1992)120<1747:TNMCSS>2.0.CO;2.
Rakesh,V.,R.Singh,and P.C.Joshi,2009:Intercomparison of the performance of MM 5/WRF with and w ithout satellite data assimilation in short-range forecast applications over the Indian region.Meteor.Atmos.Phys.,105,133–155,https://doi.org/10.1007/s00703-009-0038-3.
Routray,A.,U.C.Mohanty,D.Niyogi,S.R.H.Rizvi,and K.K.Osuri,2010:Simulation of heavy rainfall events over Indian monsoon region using WRF-3DVAR data assimilation system.Meteor.Atmos.Phys.,106,107–125,https://doi.org/10.1007/s00703-009-0054-3.
Santos-A lam illos,F.J.,D.Pozo-V´azquez,J.A.Ruiz-Arias,and J.Tovar-Pescador,2015:influenc of land-use misrepresentation on the accuracy of WRF wind estimates:Evaluation of GLCC and CORINE land-use maps in southern Spain.Atmo.Res.,157,17–28,https://doi.org/10.1016/j.atmosres.2015.01.006.
Schaefer,J.T.,1990:The critical success index as an indicator of warning skill.Wea.Forecasting,5,570–275,https://doi.org/10.1175/1520-0434(1990)005<0570:TCSIAA>2.0.CO;2.
Shen,Y.,M.N.Feng,H.Z.Zhang,and F.Gao,2010a:Interpolation methods of China daily precipitation data.Journal of AppliedMeteorological Science,21(3),279–286,https://doi.org/10.3969/j.issn.1001-7313.2010.03.003.(in Chinese)
Shen,Y.,A.Y.Xiong,Y.Wang,and P.P.Xie,2010b:Performance of high-resolution satellite precipitation products over China.J.Geophys.Res.,115(D2),https://doi.org/10.1029/2009JD012097.
Singh,R.,C.M.Kishtawal,P.K.Pal,and P.C.Joshi,2011:Improved tropical cyclone forecasts over north Indian Ocean with direct assimilation of AMSU-A radiances.Meteor.Atmos.Phys.,115,15–34,https://doi.org/10.1007/s00703-011-0165-5.
Skamarock,W.C.,J.B.K lemp,J.Dudhia,D.O.Gill,D.M.Barker,W.Wang,and J.D.Powers,2005:A description of the Advanced Research WRF version 2.Tech.Rep.NCAR/TN-468+STR,National Center for Atmospheric Research,Boulder,Colorado,8 pp,https://doi.org/10.5065/D6DZ069T.
Sokol,Z.,2009:Effects of an assimilation of radar and satellite data on a very-short range forecast of heavy convective rainfalls.Atmos.Res.,93,188–206,https://doi.org/10.1016/j.atmosres.2008.11.001.
Sokol,Z.,2011:assimilation of extrapolated radar reflectivity into a NWP model and its impact on a precipitation forecast at high resolution.Atmos.Res.,100(2–3),201–212,https://doi.org/10.1016/j.atmosres.2010.09.008.
Stensrud,D.J.,N.Yussouf,D.C.Dowell,and M.C.Coniglio,2009:Assim ilating surface data into a mesoscale model ensemble:Cold pool analyses from spring 2007.Atmos.Res.,93(1–3),207–220,https://doi.org/10.1016/j.atmosres.2008.10.009.
Weng,F.Z.,Y.Han,P.Van Delst,Q.H.Liu,T.K leespies,B.H.Yan,and J.Le Marshall,2005:JCSDA community radiative transfer model(CRTM).Proceedings of the 14th International TOVS Study Conference,Beijing,China,International TOVS Working Group,122 pp.
Xiong,C.H.,L.F.Zhang,J.P.Guan,J.Peng,and B.Zhang,2013:Analysis and numerical study of a hybrid BGM-3DVAR data assimilation scheme using satellite radiance data for heavy rain forecasts.Journal of Hydrodynamics,Ser.B,25(3),430–439,https://doi.org/10.1016/S1001-6058(11)60382-0.
Xu,Y.M.,Y.Zhang,and L.Bai,2016:Study on the spatiotemporal variations of vegetation fraction in Zoige based on remote sensing data.Plateau Meteorology,35(3),643–650,https://doi.org/10.7522/j.issn.1000-0534.2015.00040.(in Chinese)
Xu,Y.M.,Y.H.Liu,M.Wei,and J.J.Lv,2007:Land cover classification of the Yangtze River delta using MODIS data.Acta Geographica Sinica,62(5),640–648,https://doi.org/10.11821/xb200706009.(in Chinese)
Yang,J.H.,and K.Q.Duan,2016:Effects of initial drivers and land use on WRF modeling for near-surface fields and atmospheric boundary layer over the northeastern Tibetan Plateau.Advances in Meteorology,Article ID 7849249,https://doi.org/10.1155/2016/7849249.
Zhang,J.,R.Z.Zhang,and D.M.Zhou,2012:A study on water resource carrying capacity in the Shule River Basin based on ecological footprints.Acta Prataculturae Sinica,21(4),267–274.(in Chinese)
Zheng,W.Z.,L.W.He,Z.Wang,X.B.Zeng,J.Meng,M.Ek,K.M itchell,and J.Derber,2012:Improvement of daytime land surface skin temperature over arid regions in the NCEP GFS model and its impact on satellite data assimilation.J.Geophys.Res.,117(D6),D06117,https://doi.org/10.1029/2011JD015901.
Zheng,X.,N.A.Wang,Z.L.Li,X.N.Zhang,and L.Wang,2010:Analysis on land use/cover change during 1990-2005 in Shule River Basin.Journal of Desert Research,30(4),857–861,(in Chinese)
杂志排行

Advances in Atmospheric Sciences的其它文章
- First Global Carbon Dioxide Maps Produced from Tan Sat Measurements
- SPARC Local Workshop on“WCRP Grand Challenges and Regional Climate Change”
- Interannual Weakening of the Tropical Pacific Walker Circulation Due to Strong Tropical Volcanism
- Evaluation of the New Dynamic Global Vegetation Model in CAS-ESM
- Simulating Eastern-and Central-Pacific Type ENSO Using a Sim p le Coup led M odel
- Regional Features and Seasonality of Land–Atmosphere Coup ling over Eastern China