Estimation of soil organic carbon storage and its fractions in a small karst watershed
2018-03-28ZhenmingZhangYunchaoZhouShijieWangXianfeiHuang
Zhenming Zhang•Yunchao Zhou,3•Shijie Wang•Xianfei Huang
1 Introduction
As the largest carbon pool on earth,the terrestrial ecosystem has a total carbon storage of approximately 2500 Pg,of which nearly two thirds(approximately 1550 Pg)is soil organic carbon(SOC).Due to global warming,any subtle changes in the terrestrial carbon pool greatly influence the global climate(Schlesinger 1982;Lal 2004).Many methods for estimating SOC storage have been proposed by the academic community(Bohn 1982;Wang et al.2011;Wei et al.2014a,b;Zhang et al.2015;Zheng et al.2016).Evaluations of soil type,ecological methods,and geostatistical methods are commonly used in these types of studies.In both geostatistical and ecological methods,the entire study area is represented by a sample area,which can result in large errors depending on the number of sampling points and the sampling method.However,in the more widely used soil-type method,SOC storage in small or medium-sized areas is estimated by summing SOC values that have been calculated for each soil type,weighted by the corresponding acreage(Rodriguez-Murillo 2001).Because it is unclear which factors influence SOC storage,large differences exist between the values estimated by different people,and it is diffi cult to determine which estimates are the most accurate(Wang et al.2003;Mao et al.2015;Zhao et al.2015).In the 1950s,Bolin used a summary of the SOC contents published by nine researchers in the United States to calculate the global organic carbon stock and obtained a value of 710 Pg(Bolin 1977).Using a soil distribution map and the organic carbon content of the related soil groups,Bohn estimated that the global SOC storage equals 2946 Pg.In 1982,Post and others(Batjes 1996)used 2696 soil pro file datasets from around the world to estimate the global SOC storage reserves in the top 1 m of soil and obtained a value of approximately 1395 Pg(Bohn 1982).Estimates of the soil C stock of the top 1 m of soil in China ranges from 50 to 185.6 Pg according to Fang et al.(1996),and Pan et al.(2005),who used a soil-type method in which the average C density and soil acreage of each soil type were calculated from the soil C contents provided in general soil surveys of China(particularly soil survey maps with scales of 1:4 million and 1:10 million).Due to the spatial distribution of SOC,some errors exist in estimated global SOC storage(Jie et al.2004).Using the same method and considering the same study area,different researchers have arrived at different conclusions.Incorrect estimates have mainly occurred because of the large variability in soil type,the spatial distribution of organic C,and the weak representativeness of the sampled soil pro fi les.Highly representative soil pro files and accurate ranges for the related soil indexes are important for obtaining reliable estimates.
Karst areas are different from non-karst areas in terms of terrain and l and form conditions,hydrothermal conditions,site conditions for vegetation,and soil development conditions(Lu et al.2014),all of which cause the soil C cycle in karst areas to differ from that in other areas(Chen et al.2014;Heilman et al.2014).The study of soil C storage in karst areas is necessary to evaluate the C sink capacities of terrestrial soil ecosystems in China(Gifford 1994;VandenBygaart et al.2004;Jones et al.2005).Due to their unique geology and climate conditions,karst areas have low environmental C storage capacities,weak resilience against disturbance,low stabilities,and poor self-adjusting abilities.In addition,the basic characteristics of karst areas,such as bedrock outcrops,small soil C stocks,discontinuity,and complex microrelief,make it more difficult to calculate SOC storage in these areas(Zhang et al.2016).In recent studies,some indexes,such as boulder content and soil thickness,have been used in estimating SOC storage in karst areas(Zhou et al.2010;Zheng et al.2012;Chen et al.2014).However,some areas,such as large desertified rocky areas,have not been considered when estimating SOC storage in karst areas.In 2010,a 36,500 km2rocky area undergoing desertification was observed in Guizhou Province;the area accounted for 19%of the land area in the province(Ying et al.2012).Large areas of bare rock,which do not contain SOC,should be removed from formulas used to estimate SOC storage.In this study,we considered the spatial variability of related indexes,including soil distribution and acreage,occurrence rate of bare rock,rock fragment content,soil thickness,soil bulk density,and SOC content,in a plateau-type karst area in a small watershed.By revising the formulas used for obtaining SOC density and storage data,we propose a calculation method based on the soil-type method to improve the reliability of C storage estimations.
The primary objective of this research is a comprehensive analysis of the factors that impact organic carbon storage in the Houzhai River Basin.By exploring the factors that control organic carbon storage and correcting the formulas used to calculate SOC storage,a more reasonable calculation model can be put forward.Our in-depth study of a karst area informed a more accurate method for estimating the carbon pool in karst areas.This new method can be used as a reference for regional sustainable development and the accurate estimation of the global soil carbon pool.
2 Samples and methods
2.1 The study area
The study site (105°40′43′′–105°48′2′′E,26°12′29′′–26°17′15′′N)is located in the towns of Chengguan,Maguan,and Baiyan in Puding County,Guizhou Province,and covers an area of 75 km2.The elevation at the study site is between 1223 and 1567 m above sea level,and the air pressure is between 806.1 and 883.8 hPa.Three major categories of soil were studied:limestone soil,paddy soil,and yellow soil.The vegetation in the area includes Chinese weeping cypress(Cupressus funebris Endl.),Populus adenopoda Maxim,Toona sinensis(A.Juss.)Roem.,and Chinese pear(Pyrus pyrifolia Burm Nakai),among others.The main crops in the study area include paddy rice(Oryza sativa,Oryza glaberrima),corn(Zea mays Linn.sp.),soybeans(Glycine max(Linn.)Merr),and sun flowers(Helianthus annuus)(Fig.1).
2.2 Experimental design
2.2.1 Layout of sampling points
Grids were laid out on a 1:10,000 topographic map of the study area in accordance with the principles of the grid method using ArcGIS 9.3.A sampling point was placed at the center of each cell,and each cell represented an area of 150 m×150 m.Although 3333 sampling points were generated,only 2755 points were considered because the remainder was located in rivers,on roads,under houses,or in other inaccessible areas.
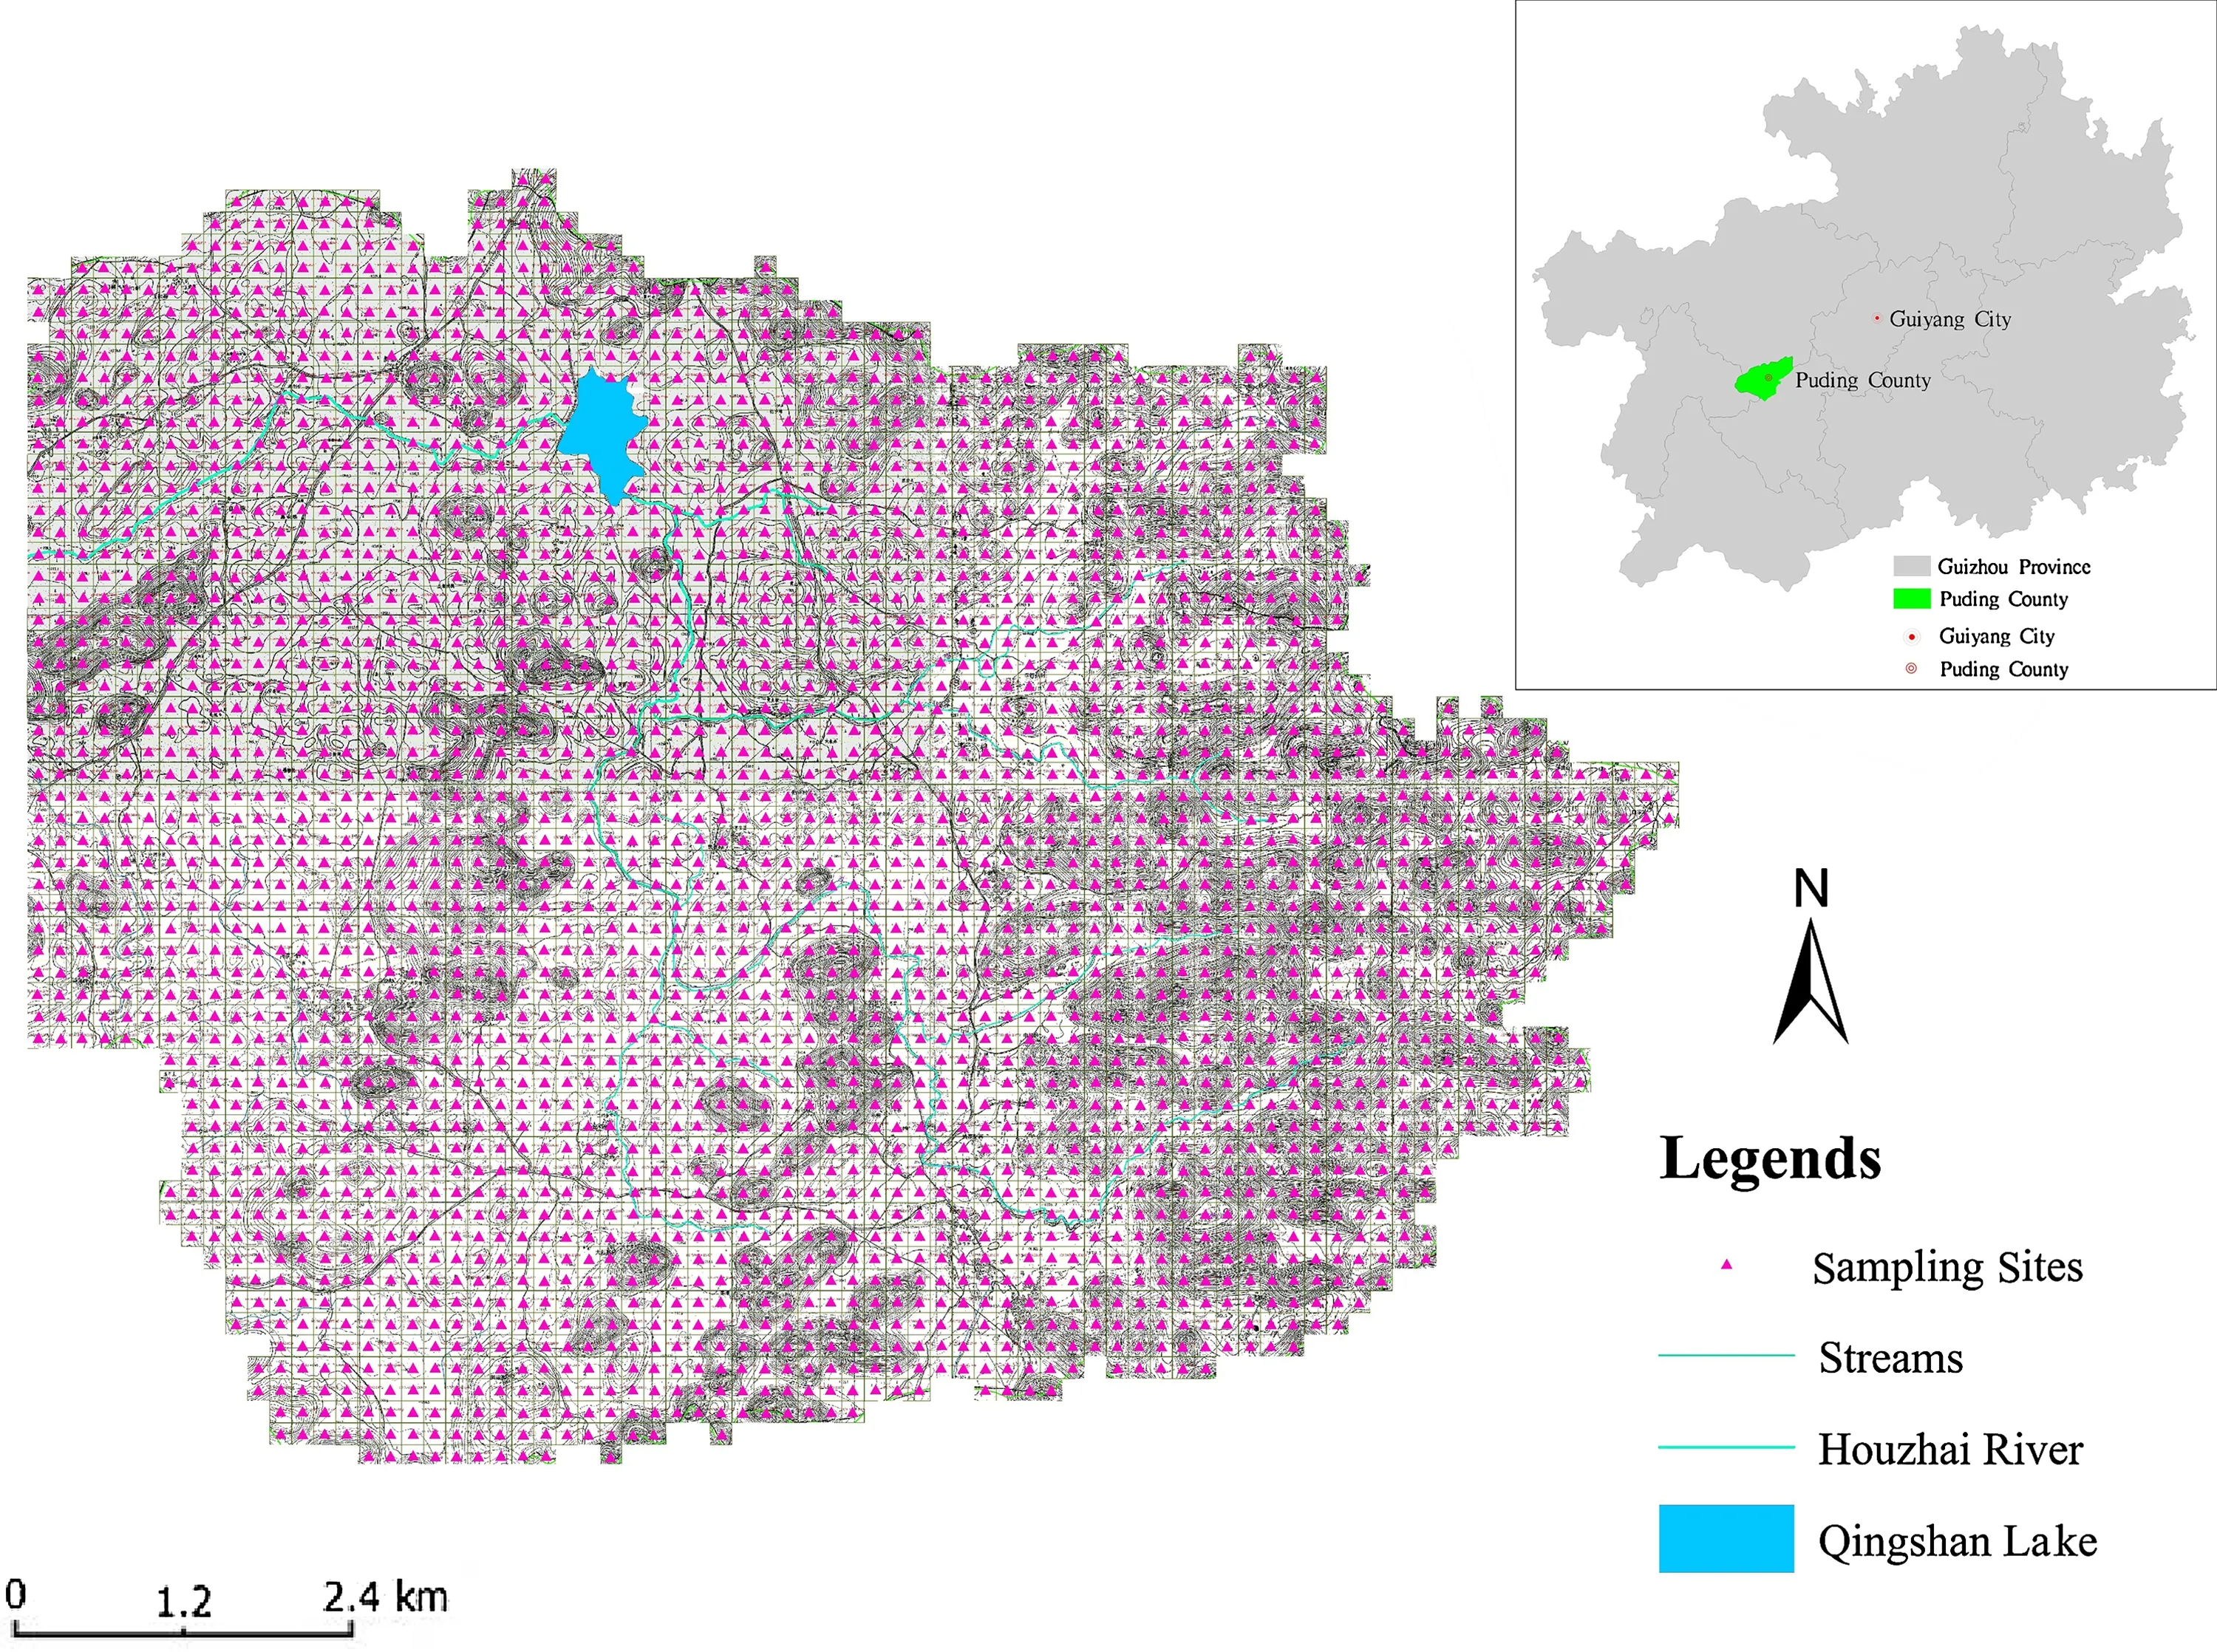
Fig.1 Location of the Houzhai river small watershed and distribution of sample sites
During soil sampling and when conducting a survey for local information,a portable GPS,a box compass,and a topographic map showing the point distribution were used to locate the sampling points in the fi eld.
2.2.2 Sample collection
Soil samples were collected from the bottom to the top and layer by layer along the soil pro file,which was always≤100 cm deep.When the bedrock or parent material layer was at a depth of less than 100 cm,the soil pro file depth was the soil and rock interface.The soil pro file was divided into up to 12 depth increments(0–5,5–10,10–15,15–20,20–30,30–40,40–50,50–60,60–70,70–80,80–90,and 90–100 cm).Local information for each sampling point and the soil bulk density,soil thickness,rock coverage,and other indexes were measured and recorded.
2.3 Test methods
First,the soil samples were air-dried,ground,and prepared according to the requirements of the laboratory.Then,the SOC contents of the samples were determined using the potassium dichromate method.
Soil acreage was calculated using GIS information and fi eld survey data.Bulk density was measured layer by layer from the top to the bottom of the soil pro file using the cutting-ring method.Soil thickness was recorded according to the type of ecological niche using an iron measuring rod that was 60 or 120 cm long,based on the soil mass at different depths.The boulder content was surveyed using a linear transect.Due to the existence of complex landscapes in the karst area,the length of the linear transect was set at 10 m.Although more accurate information could be obtained from a longer transect,establishing a longer transect would have required excessive effort.Grid cells with rock coverage were surveyed using a tape measure.
2.4 Data analysis
The soils were divided into several types as follows:457 samples of Xanthi-udic ferralsols,613 samples of Black Lithomorphic Isohumisols,397 samples of yellow limestone soil,129 samples of Cab High fertility Orthic Anthrosols,439 samples of Cab Low fertility Orthic Anthrosols,125 samples of white Cab High fertility Orthic Anthrosols,106 samples of Cab Medium fertility Orthic Anthrosols,185 samples of large mud field loam,and 304 samples of Fec Hydragric Anthrosols.The data from these 2755 soil samples were analyzed using Excel 2013 and ArcGIS 9.3.
2.5 Computation of soil organic carbon storage and formula modifi cation
2.5.1 Commonly used equations

where Ci is the SOC content in the i layer of the soil,Hiis the thickness of the i layer of the soil (cm),is the weighted average organic matter content for the first j soil species(%),C is the carbon pool,ρ is the soil bulk density(g cm-3),S is the acreage of soil j(mu),is used to convert the resulting value to meters in the coefficient,and 10-2is a conversion coefficient.

where j is the soil type,Cjis the total SOC stock in an area of soil j(t),Sjis the acreage of soil j(km2),Hjis the thickness of the i layer of soil j(cm),Ojis the SOC content of soil j(%),and Wjis the bulk density of the i layer of soil j(g cm-3).

where j is the soil type,socdjis the SOC density in the i layer of soil j(kg m-2),cjis the SOC content of soil j(%),hjis the thickness of the i layer of soil j(cm),Wjis the bulk density of soil j(g cm-3),socjis the total stock of SOC in the study area(t),and sjis the acreage of soil j(km2).
Although the three equations used above for estimating the SOC stock are expressed in different forms,they share the same theory and involve the use of the same four major parameters:SOC content,soil bulk density,soil thickness,and soil acreage.Equation A accounts for soil type and indicates a bulk density value of 1.4 g cm-3.By taking the mean values of all indexes,Equation B represents the SOC stock of one soil type.Equation C,in which SOC content is considered by soil layer,also represents the SOC stock of one soil type.Because the SOC content,soil bulk density,soil thickness,and other parameters vary widely among the soil types in the karst area,the equations above should be modifi ed before they are used for estimating the SOC stock when using the soil-type method.
2.5.2 First modified equation
Due to the variety of soil types in the karstarea,the soil-type method was adopted.Because of the large variability in the indexes,such as the SOC content,bulk density,and soil thickness,the SOC density was calculated layer by layer.The soil pro file was divided into twelve layers.The SOC density in each layer was computed based on its corresponding SOC content,bulk density,and thickness.In addition,the spatial eigenvalue of the SOC density of the Houzhai River watershed in Puding was estimated based on the SOC density in each soillayer.Next,the SOC density and soil acreage of each soiltype were used to determine the SOC stock layer by layer,which was then used to determine the total SOC storage in the study area.Thus,the equations for SOC density and storage can be modifi ed as follows:
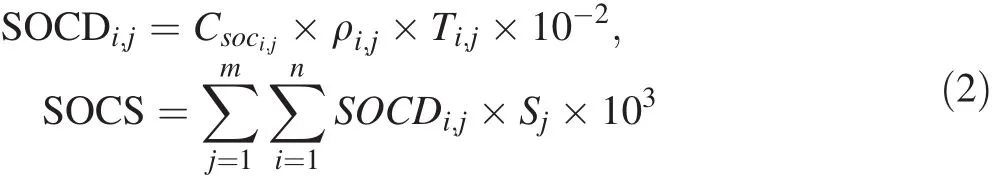
where SOCDi,jis the SOC density in the i layer of soil j(kg m-2),Csoci,jis the SOC content in the i layer of soil j(g kg-1), ρi,jis the bulk density of layer i of soil j(g cm-3),Ti,jis the thickness of layer i of soil j(cm),10-2is a conversion coefficient,SOCS is the total stock of SOC in the study area(t),Sjis the acreage of soil j(km2),and 103is a unit conversion factor.
2.5.3 Second modified equation
To minimize the difference between the estimated SOC stock and the actual SOC stock,th error caused by rock coverage in the karst area was reduced by revising the bare rock rate.Equation 2 can be modifi ed to generate Eq.3 as follows:
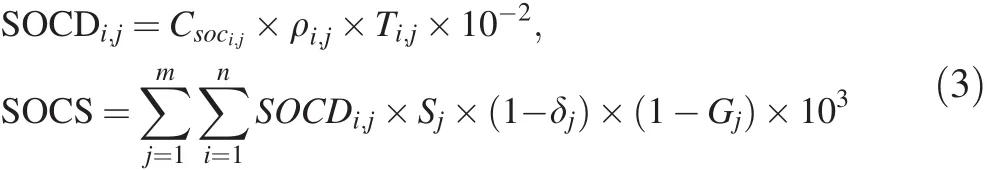
where δjis the boulder content in the sampling area of soil j(%),Gjis the volume percentage of gravel that is larger than 2 mm in soil j,and the other indexes are the same as those described in Eq.2.
After the second modifi cation,Eq.3 can be used to estimate SOC storage in the karst area while considering the large variability in the related indexes.
3 Results
3.1 Statistical analysis of the related soil indexes
3.1.1 Characteristics of soil acreage,boulder content,and soil thickness
In accordance with the survey and statistics,three soil groups were identified in the basin:limestone soil,paddy soil,and yellow soil.These soils include the following nine soil types:Xan Udic Fernalisols,Black Lithomorphic Isohumisols,yellow limestone soil,Cab High fertility Orthic Anthrosols,Cab Low fertility Orthic Anthrosols,Cab Medium fertility Orthic Anthrosols,Cab Medium fertility Orthic Anthrosols,large mud field loam,and Fec Hydragric Anthrosols.Using GIS and field surveys,the study area was divided into different sampling units based on soil type.The units,quite different in size,were interlaced in the basin.Coverages are listed in Table 1.The Black Lithomorphic Isohumisols and yellow limestone soils covered small areas and usually occurred in clusters.These soils were generally mixed together and dif fi cult to separate using GIS technology.Based on the number of sampling points for these two soil genera,the soil coverages of Black Lithomorphic Isohumisols and yellow limestone soils were 13.79 and 8.93 km2,respectively.
Because limestone,paddy,and yellow soils are interwoven,the soil in the watershed is very heterogeneous.The limestone soil areas suffer from severe stony desertifi cation and scattered rock exposure.When rock coverage is not considered,soil coverage is overestimated.Therefore,the value of soil acreage was revised by considering the area covered by rocks.The boulder content differed substantially for different soil units;for instance,43.34%of the area containing Black Lithomorphic Isohumisols was covered by rocks(the highest percentage),as was 29.22%of the area with tilled Cab High fertility Orthic Anthrosols(the lowest non-zero percentage).Rock exposure was rare in the three major tillage areas consisting of Xan Udic Fernalisols,large mud field loam,and Fec Hydragric Anthrosols;therefore,the rate of rock coverage in these areas was recorded as zero.The particle size distribution and rock exposure rate in the Cab Medium fertility Orthic Anthrosols and Fec Hydragric Anthrosols were nearly the same,with no rock fragments.However,the sizes of the rock fragments in the other soil types decreased as follows: Black Lithomorphic Isohumisols>Cab Udi Orthic Entisols>Cab Medium fertility OrthicAnthrosols>whiteCab High fertility Orthic Anthrosols>Cab Low fertility Orthic Anthrosols>Cab High fertility Orthic Anthrosols>Xan Udic Fernalisols.

Because limestone soils develop slowly from carbonate rock and severe water and soil losses occur in lithic areas,the soils in the peak clusters were very thin,and bare rock was sometimes observed.However,the soil in the lowlying lands was relatively thick.The soil thicknesses in the sampling areas of different soil units were very different.For instance,the Xan Udic Fernalisols were deeper than 100 cm,while the Black Lithomorphic Isohumisols were only a few centimeters to 20 cm deep.The Xan Udic Fernalisols that developed on dry land from yellow soils were deep.However,the small amount of yellow soil that developed from sandy shale was rather thin and included Xan Udic Fernalisols,which were deeper than 100 cm.The Cab High fertility Orthic Anthrosols,Cab Low fertility Orthic Anthrosols,Cab Medium fertility Orthic Anthrosols,and Cab Medium fertility Orthic Anthrosols with different soil thicknesses were located in dry areas.The Cab Medium fertility Orthic Anthrosols were shallow.The areas of large mud fi eld loam and Fec Hydragric Anthrosols were paddy fi elds.The Cab High fertility Orthic Anthrosols were thin in the upstream area but relatively thick downstream.Most of the Fec Hydragric Anthrosols were deeper than 100 cm,and the Black Lithomorphic Isohumisols and yellow limestone soils were relatively thin and scattered in peak clusters.
3.1.2 Soil bulk density
The soil bulk densities of the Black Lithomorphic Isohumisols,yellow limestone soil,and Cab Low fertility Orthic Anthrosols gradually increase with increasing soil depth.The bulk densities of Xan Udic Fernalisols,Cab High fertility Orthic Anthrosols,Cab Medium fertility Orthic Anthrosols,Cab Medium fertility Orthic Anthrosols,and Fec Hydragric Anthrosols increase and then decrease as the thicknesses of the soil layers increase.Meanwhile,the bulk densities of the Cab High fertility Orthic Anthrosols and Cab Medium fertility Orthic Anthrosols tend to remain stable in the deep layers,but the bulk density of Xan Udic Fernalisols tends to increase with depth.The bulk density of Cab Medium fertility Orthic Anthrosols first decreases and then increases with increasing soil depth.The bulk densities in the bottom layers of the Black Lithomorphic Isohumisols,yellow limestone soil,and Cab Low fertility Orthic Anthrosols reached a plateau,while the bulk densities of the Cab High fertility Orthic Anthrosols and Fec Hydragric Anthrosols were greatest in the plow pan.The bulk densities of the other soils were greatest in the transitional zone between the A and B horizons.The same layers of different soil units have very different bulk densities.For example,the bulk density at a depth of 15–20 cm in the mud field loam was 0.32 g cm-3greater than the bulk density at the same depth in the Black Lithomorphic Isohumisols.The maximum bulk plow pan was observed in the large area containing mud field loam and was 1.44 g cm-3.The minimum bulk density was in the surface layer of the Black Lithomorphic Isohumisols at 0.94 g cm-3(Fig.2).
3.1.3 Soil organic carbon content
The SOC contents in the different soils decreased with increasing soil depth at different rates.The SOC content decreased gradually at a depth of 0–50 cm,and no large differences were observed at depths of 50–100 cm.The SOC contents of the different soil genera in corresponding layers were very different.For example,the SOC content of the Black Lithomorphic Isohumisols in the surface layer was 2.61 times greater than that in the Xan Udic Fernalisols.Overall,the Black Lithomorphic Isohumisols had the highest SOC content,and the Xan Udic Fernalisols the lowest SOC content.In all soil samples,the SOC content was higher at the surface than in the deeper soil layers.Black Lithomorphic Isohumisols and yellow limestone soils located in peak clusters and in natural woodlands soils had higher SOC than the other seven units of cultivated soil.Moreover,the SOC content of the Black Lithomorphic Isohumisols in the upper part of the peak cluster was greater than that of the yellow limestone soil in the lower part of the peak cluster(Fig.3).
3.2 Index values of SOC storage
The interval values of the indexes,including the SOC content,bulk density,soil thickness,soil acreage,and bare rock rate,in the Houzhai River Basin in Puding were obtained by analyzing data from 2755 sampling points(Table 2).
In the study area,the SOC density at 5-cm intervals at depths of 0–20 cm ranged from 0.21 to 3.43 kg m-2,and the SOC density at 10–cm intervals at depths of 20–100 cm ranged from 0.16 to 4.21 kg m-2.The SOC density at a depth of 20–100 cm in the different soils ranges from 5.14 to 19.32 kg m-2.The bulk density at a depth of 0–100 cm ranged from 0.94 to 1.44 g cm-3.The soil thickness ranged from 20 to 100 cm(soil deeper than 100 cm was labeled 100 cm).The average soil thickness in the study area was 64 cm.The boulder content in the karst area ranged from 29.22%to 43.34%,and the particle rock content ranged from 0%to 75.71%,which was used to revise the soil acreage.The total area of the watershed is 75 km2,of which the area of water is 0.83 km2and the area of land is 74.17 km2.The total area of land includes both soil and bare rock.The SOC contents,bulk densities,thicknesses,and acreages of the soils were very different,particularly in the large area containing limestone soils.Therefore,SOC stocks in each soil type and in each soil layer were calculated individually and then used to calculate total SOC storage of the area.
3.3 Estimates of soil organic carbon density

Fig.2 Soil bulk density of different soils.YC,Xan Udic Fernalisols;RD,Black Lithomorphic Isohumisols;YLS,Cab Udi Orthic Entisols;LL,Cab High fertility Orthic Anthrosols;SC,Cab Low fertility Orthic Anthrosols;WLL,Cab Medium fertility Orthic Anthrosols;WS,Cab Medium fertility Orthic Anthrosols;LMFS,Cab Medium fertility Orthic Anthrosols;YCS,Fec Hydragric Anthrosols
The SOC density at intervals of 5 cm at depths of 0–20 cm in the sampling area of each soil genus decreased as the depth of the soil layer increased.Black Lithomorphic Isohumisols were observed to have the highest SOC density,while yellow limestone soil was observed to have the lowest SOC density.The SOC density at intervals of 10 cm at depths of 20–100 cm in the sampling area of each soil type gradually decreased as the depth of the soil layer increased,and generally became stable near the bottom of the soil pro fi le.The largest SOC density to a depth of 10 cm was 1.58 times the smallest value.The SOC density to a depth of 20 cm ranged from 3.29 to 5.44 kg m-2,and the SOC density to a depth of 100 cm ranged from 4.44 to 14.50 kg m-2(Table 3).Meanwhile,the national average SOC density to a depth of 87 cm in China is 10.53 kg m-2(Wang et al.2011).The average SOC density to a depth of 10 cm in the karst area of the Houzhai River watershed was 2.39 kg m-2,1.95 times that of the 1.21 kg m-2observed in China.
3.4 Comparisons of the methods used to calculate soil organic carbon storage
The estimated SOC storage in the Houzhai River watershed is SOCS7=9.37×10⁵t when the variability of the SOCcontent,bulk density and soil thickness is considered and the in fl uence of rock coverage is ignored.If the SOC content,bulk density,and soil thickness are given as average values and the variabilities of the remaining indexes are considered,the corresponding estimates of SOC storage in the HouzhaiRiverwatershed are SOCS4=9.61×10⁵t,SOCS5=9.28×10⁵t,and SOCS6=8.53×10⁵t,respectively,and SOCS6<-SOCS5<SOCS4(Table 4).This indicates that SOC content,bulk density,and soil thickness have different degrees of in fl uence on the estimation of SOC storage.

Table 2 Interval value of different indexes
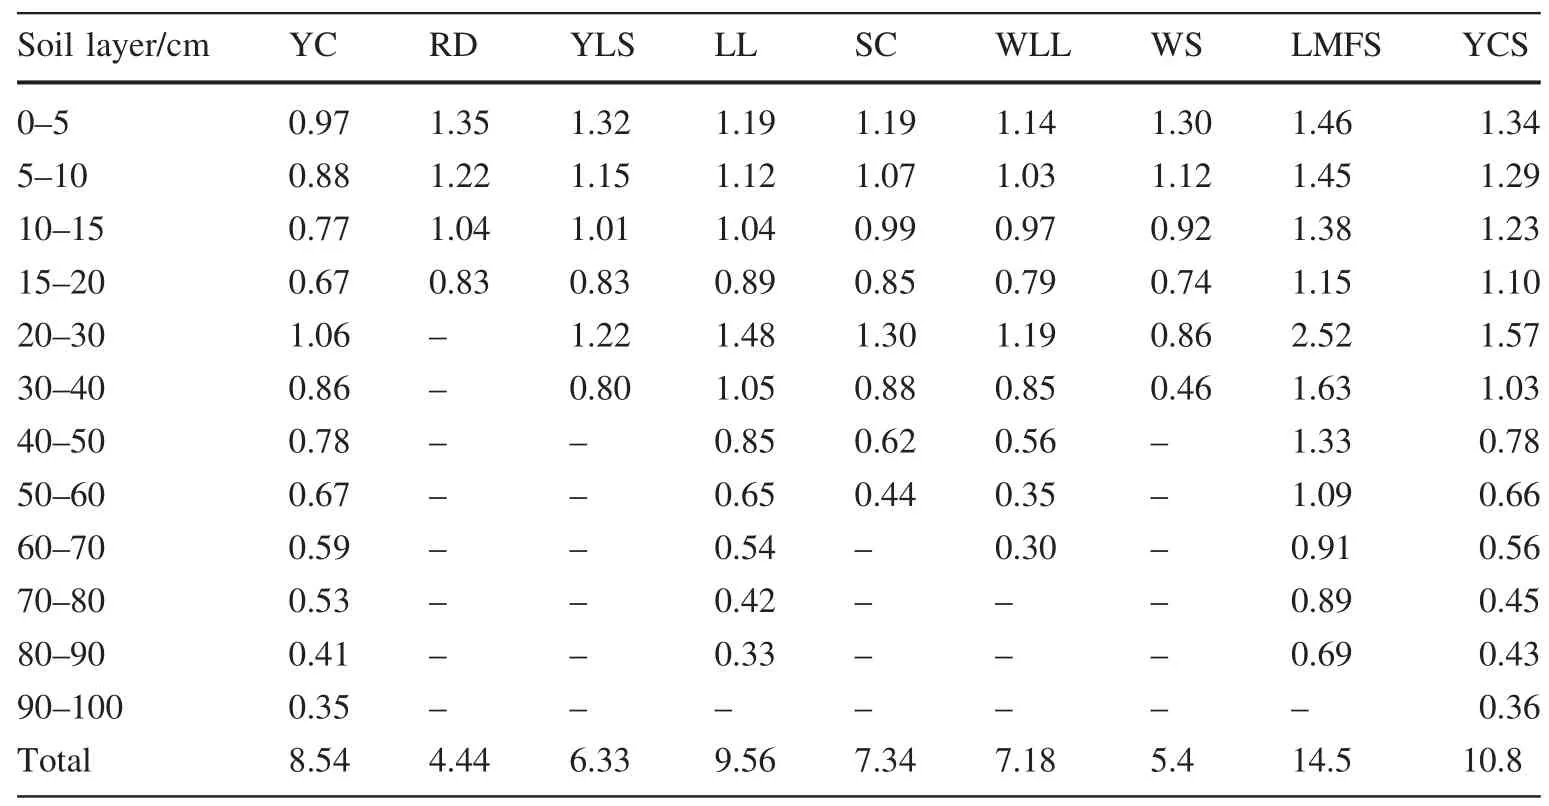
Table 3 Spatial distribution eigenvalue of soil organic carbon density of different soils in basin(unit kg m-2)
When assuming that the soil is uniform to a depth of 100 cm and thatthe average soilbulk density is 1.20 g cm-3,the estimated SOC storage decreases as follows:SOCS1>SOCS2>SOCS3=1.8(SOCS7).In other words,SOC storage decreases as the average SOC content decreases,and the SOCS3content is 1.8 times the SOCS7content.When rock coverage is ignored,the SOC storage in the Houzhai River watershed is SOCS7=9.37×10⁵t;taking rock coverage into account,the SOC storage is SOCS8(CK)=5.39× 10⁵t—a difference of 3.98× 10⁵t(Table 4),which is very large considering that the area of the watershed is 75 km2.This indicates that the boulder content is a significant factor that must be considered to improve the reliability of SOC storage estimates in karst areas.Different correction indicators should be compared to estimate the error in organic carbon storage estimates.If it is assumed that the soil is homogeneous to a depth of 100 cm,with an average bulk density of 1.20 g cm-3,and if other variation factors are not considered,the error range is 216.33%to 287.01%.However,when mean SOC content,soil bulk density,soil thickness,and the variability of other indicators are considered,the error range is reduced to 58.26%to 78.29%.
4 Discussion
4.1 Spatial heterogeneity of the soil in the karst area
The extraordinary spatial heterogeneity of the Houzhai River watershed in Puding forms a dual structure;thelandscape elevation increases and decreases for various soil types that are interwoven with one another and with scattered bare rocks.In the vertical direction,soil depths differ substantially among the soil types,and related indexes at different soil depths within the same soil type are very different.The related indexes in this complex area with high spatial heterogeneity are widely variable.The spatial distribution of soil mass in this area is complex,various soil genera are interwoven with one another,and there is a discontinuous regolith caused by exposed rock and nonuniform soil thickness.The spatial heterogeneity in the karst area is responsible for the variability in the related indexes,including the SOC content,bulk density,soil thickness,soil distribution,soil coverage,and bare rock rate,all of which play important roles in estimating SOC storage.In the process of estimating SOC storage and density,the boulder content and soil thickness should be considered in order to reduce error.These factors should be revised further to estimate the SOC stock and density in areas with high bare rock rates.Simultaneously,the variability in the spatial distribution of soil mass,SOC content,and bulk density should be considered important factors for sampling and for calculating SOC storage(Bohn 1982;Wei et al.2014a).The large spatial heterogeneity of the soil should play a signi fi cant role in estimating the SOC storage in the karst area when using the soil-type method.

Table 4 Soil organic carbon storage with different calculation modes
The accuracy of SOC storage estimates in karst areas are related not only to the estimate modes but also to the accuracy of the indexes,such as the SOC content,bulk density,soil thickness,and soil acreage,which are important factors for estimating the SOC stock.However,due to the exposed rock in the karst area,the actual soil acreage must be revised by using boulder content and rock fragment content.This study was conducted using a highquality database containing information from 2755 samples that represent 23,536 soil samples.With the basic data detailed above,accurate estimates of SOC density and storage can be obtained.Meanwhile,the formula used for determining C storage can be revised.All of these factors can contribute to the accurate calculation of C storage in small karst areas(Fig.4).
4.2 Influencing factors of soil organic carbon density in karst areas
Although some researchers have previously considered boulder content and soil thickness in karst areas(Li et al.2015;Tang et al.2016;Wen et al.2016),this study considers related indexes such as SOC content,bulk density,soil thickness,soil coverage,and boulder content together.SOCS4is 0.24×10⁵t more than SOCS7;SOCS5is 0.092×10⁵t less than SOCS7;SOCS6is 0.84×10⁵t more than SOCS7;and SOCS8is 3.98×10⁵t less than SOCS7(Table 4).These results show that the in fl uences of the indexes on SOC storage estimates decrease as follows:soil thickness>boulder content>SOC content>bulk density.Hence,to estimate SOC storage in karst areas,the impacts of soil thickness and boulder content should be prioritized,followed by SOC content and soil bulk density.This study presents a detailed survey of soil types,SOC,bulk density,boulder content,and soil thickness by using a detailed survey and soil-type method.Using this method resulted in more accurate SOC content and density estimates for this basin.When using an average soil bulk density of 1.20 g cm-3,the SOC storage in the Houzhai River watershed was estimated at 7.33×10⁵t using Equation A—1.94×10⁵t greater than the SOC storage estimated using Eq.3;the SOC storage estimated using Equation B was 7.63×10⁵t,which was 2.24×10⁵t greater than the result based on Eq.3.Equations A,B,and C all ignore the in fl uence of rock coverage and have large errors because the indexes,such as SOC content and bulk density,contained variability.If mean SOC content,soil bulk density,and soil thickness are considered in addition to the variabilities of other indicators,the error is very large.The error of SOC storage in the small watershed in the post-walled river basin was 73.84%when the bare rock ratio was not considered.
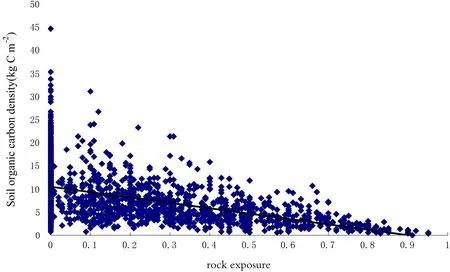
Fig.4 Correlation between exposed rock rate and soil organic carbon density
Soil thickness and rock exposure are both important factors that directly and indirectly affect SOC storage in karst areas.In the Houzhai River basin,soil thickness and rock exposure ranged from 0 to>100 cm and from 0%to 95%,respectively,and were used in the equations to calculate the SOC density and SOC storage.The karst soils developed from limestone,dolomite,and widely exposed laminated bedrock.These soils are unique and complicated,resulting from the weathering of rock around fissures and accumulating dissolved oxygen.In addition,these soils form discontinuous shallow deposits with a scattered distribution and variable thickness.The organic carbon density of the soil was negatively correlated with boulder content,meaning that the boulder content was high when the SOC density was lower and vice versa(Zhang et al.2003).These results are consistent withthose of(Zhang et al.2007),who showed that bedrock around sampled soillayers (similar to the stone throughout the soil)is generally shallow;that organic carbon is concentrated in a small amount of soil;and that exposed bedrock with litter debris,soil particles,and nutrients has stone surface erosion that reallocates the litter and soil nutrients,resulting in a lower SOC density(Zhang et al.2016).

Fig.5 Soil organic carbon density by soil depth and gravel content(series)
Generally,SOC densities decreased with increasing soil depth and with increased gravel content(Fig.5).This decrease occurred because less soil was present when the proportion of gravel was greater and the unit area with a certain thickness of SOC decreased.The largest SOC density—33.59 tC hm-2—was observed at soil depths of 0–10 cm and gravel content of 10%–20%.The SOC density was the lowest when the gravel content was greater than 50%.
5 Conclusions
(1)Composite estimates of SOC must take into account the variability in SOC content,soil bulk density,soil thickness,and bare rock rate.In karst areas,the soil-type method should be used layer-by-layer in the vertical direction and type-by-type in the horizontal direction.
(2)Due to its impact on estimation accuracy,boulder content was used to revise the following formula.The revised equations of SOC density and storage in karst areas arerespectively.
(3)The influences of the different indexes on the accuracy of SOC storage estimation decrease as follows:soil thickness>boulder content>SOC content>bulk density.Using the equations revised by the bare rock rate,the estimated SOC storage in the small watershed of the Houzhai River in Puding is 5.39×10⁵t;SOC content to a depth of 20 cm ranges from 3.53 to 5.44 kg m-2,with an average value of 1.24 kg m-2,and the range of the SOC content to a depth of 100 cm is from 4.44 to 14.50 kg m-2,with an average value of 12.12 kg m-2.
AcknowledgementsFunding was provided by National Key Basic Research Development Program(Grant No.2013CB956702).
Open AccessThis article is distributed under the terms of the Creative Commons Attribution 4.0 International License(http://crea tivecommons.org/licenses/by/4.0/),which permits unrestricted use,distribution,and reproduction in any medium,provided you give appropriate credit to the original author(s)and the source,provide a link to the Creative Commons license,and indicate if changes were made.
Batjes NH(1996)Total carbon and nitrogen in soils of the world.Eur J Soil Sci 47:151–163
Bohn HL(1982)Estimate of organic carbon in world soils.Soil Sci Soc Am J 46:1118–1119
Bolin B(1977)Change of land biota and their importance for the carbon cycle.Science 196:613–615
Chen XB,Zheng H,Zhang W,He XY,Li L,Wu JS,Huang DY,Su YR(2014)Effects of land cover on soil organic carbon stock in a karst landscape with discontinuous soil distribution.J Mt Sci 11:774–781
Fang JY,Liu GH,Xu X(1996)The carbon pool of terrestrial ecosystem in China.In:Wen YP,Wang G(eds)Determination and related process of greenhouse gas concentration and emission. China Environmental Science Press, Beijing,pp 109–128
Gifford RM(1994)The Global carbon cycle:a viewpoint on the missing sink.Funct Plant Biol 21:1–15
Heilman JL,Litvak ME,Kevin JM,Kjelgaard JF,Kamps RH,Schwinning S(2014)Water-storage capacity controls energy partitioning and water use in karst 470 ecosystems on the Edwards Plateau,Texas.Ecohydrology 7:127–138
Jie X,Sun B,Zhou HZ,Li AB,Li ZP(2004)Organic carbon density and storage soil of China and spatial analysis.Acta Pedol Sin 41:35–43(in Chinese with English abstract)
Jones C,McConnell C,Coleman K,Cox P,Falloon P,Jenkinson D,Powlson D(2005)Global climate change and soil carbon stocks;predictions from two contrasting models for the turnover of organic carbon in soil.Global Change Biol 11:154–166
Lal R(2004)carbon sequestration impacts on global climate change and food security.Soil Sci 304:1623–1627
Li YB,Xie J,Luo GJ,Yang H,Wang SJ(2015)The evolution of a karst rocky deserti fi cation land ecosystem and its driving forces in the Houzhaihe area.Open J Ecol 5:501–512
Lu XQ,Todab H,Ding FJ,Fang SZ,Yang WX,Xua HG(2014)Effect of vegetation types on chemical and biological properties of soils of karst ecosystems.Eur J Soil Biol 61:49–57
Mao DH,Wan ZM,LiL Miao ZH,Ma WH,Song CC,Ren CY,Jia MM(2015)Soil organic carbon in the San Jiang Plain of China:storage,distribution and controlling factors.Biogeosciences 12:1635–1645
Pan GX,Li LQ,Zhang Q,Wang XK,Sun XB,Xu XB,Jiang DA(2005)Organic carbon stock in topsoil of Jiangsu Province,China,and the recent trend of carbon sequestration.J Environ Sci 17:1–7
Rodriguez-Murillo JC(2001)Organic carbon content under different types of land use and soil in peninsular Spain.Biol Fertil Soils 33(1):53–61
Schlesinger William H(1982)Carbon storage in the caliches of arid soils a case study from Arizona.Soil Sci 133:247–255
Tang YQ,Kai S,Zhang XH,Zhou J,Yang Q,Liu Q(2016)Microstructure changes of red clay during its loss and leakage in the karst rocky deserti fi cation area.Environ Earth Sci 75:1–12
Vanden Bygaart AJ,Greg EG,Angers DA,Stoklas UF(2004)Uncertainty analysis of soil organic carbon stock change in Canadian cropland from 1991 to 2001.Global Change Biol 10:983–994
Wang SQ,Liu JY,Yu GR(2003)Error analysis of estimating terrestrial soil organic carbon storage in China.Chin J Appl Ecol 14:797–802(in Chinese with English abstract)
Wang SQ,Liu JY,Zang GC,Yi CX,Wu WX(2011)Effects of afforestation on soil carbon turnover in China’s subtropical region.J Geogr Sci 21:118–134
Wei Y,Pk Jiang,Zhou KI,Li GM,Wu YF,Du JS(2014a)The carbon storage in moso bamboo plantation and its spatial variation in Anji County of southeastern China.J Soils Sediments 14:320–329
Wei YW,Yu DP,Lewis BJ,Zhou L,Zhou WM,Fang XM,Zhao W,Wu SN,Dai LM(2014b)Forest carbon storage and tree carbon pool dynamics under natural forest protection program in northeastern China.Geogr Sci 24:397–405
Wen QS,Lei B,Gang P(2016)Effect of algal fl occulation on dissolved organic matters using cationic starch modified soils.J Environ Sci 45:177–184
Ying B,Xiao SZ,Xiong KN,Cheng QW,Luo JS(2012)Comparative studies of the distribution characteristics of rocky desertification and land use/land cover classes in typical areas of Guizhou Province,China.Environ Earth Sci 71:631–645
Zhang W,Chen HS,Wang KL,Su YR,Zhang JG,Yi AJ(2007)The heterogeneity and its in fl uencing factors of soil nutrients in peakcluster depression areas of karst region.Agric Sci China 6:322–329
Zhang JY,Dai MH,Wang LC,Zeng CF,Su WC(2015)The challenge and future of rocky desertification control in karst areas in southwest China.Solid Earth Discuss 7:3271–3292
Zhang WQ,Jin X,Rong N(2016)Organic matter and pH affect the analysis efficiency of(31)P-NMR.Environ Sci 43:793–799
Zhao X,Xue JF,Zhang XQ,Kong FL,Chen F,Lal R,Zhang HL(2015)Stratification and storage of soil organic carbon and nitrogen as affected by tillage practices in the North China plain.PLoS ONE 10:1–14
Zheng H,Su YR,He XY,Hu LN,Wu JS,Huang DY,Li L,Zhao CX(2012)modified method for estimating organic carbon density of discontinuous soil in peak-karst regions in southwest China.Sci Environ Earth Sci 67:1743–1755
Zheng T,Wu XQ,Dai EF,Zhao D(2016)SOC storage and potential of grasslands from 2000 to 2012 in central and eastern Inner Mongolia,China.J Arid Land 8:364–374
Zhou YC,Wang SJ,Lu HM,Xie L,Xiao D(2010)Forest soil heterogeneity and soil sampling protocols on limestone outctops:example from SW China.Acta Carsologica 39:117–226
Zhuang S,Qian H,Wang F,Ji H(2015)Spatial variability of the topsoil organic carbon in the moso bamboo forests of southern China in association with soil properties.PLoS ONE 10:1–17
杂志排行
Acta Geochimica的其它文章
- Erratum to:The oceanic cycles of the transition metals and their isotopes
- Elemental characteristics and paleoenvironment reconstruction:a case study of the Triassic lacustrine Zhangjiatan oil shale,southern Ordos Basin,China
- Effect of Zn deficiency and excessive bicarbonate on the allocation and exudation of organic acids in two Moraceae plants
- Application of K-means and PCA approaches to estimation of gold grade in Khooni district(central Iran)
- Spatial analysis of carbon storage density of mid-subtropical forests using geostatistics:a case study in Jiangle County,southeast China
- Timing of mineralization at the Shihu gold deposit in the middle segment of the Taihang Mountain,China