Heart rate variability to assess ventilatory thresholds in professional basketball players
2018-01-08DomingoJesRmosCmpoJooRuioArisVientevilGndCristinMrPgAntonioLuquePedroAlrz
Domingo Jesús Rmos-Cmpo *,Joo A.Ruio-ArisViente Ávil-Gndí,Cristin Mrín-Pgán ,Antonio Luque,Pedro E.Alrz
a Department of Physical Activity and Sport Science,Faculty of Sports,Catholic University of Murcia,Murcia 30107,Spain
b Department of Physiology,Catholic University of Murcia,Murcia 30107,Spain
c UCAM Research Center for High Performance Sport,Murcia 30107,Spain
1.Introduction
Competitive basketball is an intermittent,high-intensity physical activity that requires a well-developed aerobic and anaerobic fitness1The main actions are related to anaerobic ability;however,aerobic capacity plays a determ inant role for recovery.2Specifical y,a higher maximum oxygen uptake(VO2max)improves the ability to recover from anaerobic actions,3where the anaerobic threshold(AT)is used as an indicator of endurance performance and stress.4Thus,determining the ventilatory thresholds(VTs)is essential for coaches and physical trainers because they can use these physiological points as a reference to establish individual training zones and to evaluate training interventions.2,5
AT is the work rate above which the oxidative metabolism does not provide for all the required energy,and the greater anaerobic contribution to energy production results in lactate accumulation in the blood.6Several methods have been proposed to determine AT,such as the onset of blood lactate accumulation,maximal lactate steady state,or second ventilatory threshold(VT2).7Respiratory compensation point is linked with VT2,as hyperpnoea is not sufficien to eliminate carbon dioxide(CO2)metabolic production;thus,ventilation increases more markedly and is strongly related to AT.6Moreover,during a graded maximal exercise,there is a significan inflectio point in ventilation known as the firs ventilatory threshold(VT1),which is elicited by the increase in CO2metabolic production during hyperpnoea.The VT1 is related to the increased contribution of anaerobic metabolism and has been shown to be strongly related to AT.6,7
Although the ventilatory method is useful in determining VTs,the technology(i.e.,gas analyser)is expensive and its use is limited to laboratories and specialized centres.For this reason,we decided to use the gold standard method(ventilatory equivalent,VE)to determine the VT28in addition to gas exchange or V-slope that has been used in other studies.However,some studies suggest that heart rate variability(HRV)could be an alternative method for determining VTs.8–10
HRV is measured by the beat-to-beat variation in HR and time between each heartbeat.11This variance reflect the status of the neurocardiac function,which is regulated by the autonomic nervous system.Previous research suggests that VTs may also be under the same type of nervous system control.9The synchronization between the cardiac and respiratory rhythms modulates the respiratory sinus arrhythmia(RSA).
During exercise,the increase in exercise intensity producesa higher HR and lower HRV,12which may be due to an increment in sympathetic nervous activity and a decrease of vagal modulation to the heart.13The onset of intensity-induced blood lactate accumulation produces an increase in ventilation.Furthermore,the amplitude of RSA is proportional to ventilation at moderate-intensity exercise(60%–65%VO2max).14Some researchers have found that the relationship between HRV and VT enables the detection of a similar threshold by examining changes in HRV during progressive exercise.7,9,15–18In fact,there appears a dominant frequency(dfHF)in the high frequency range(HF)of the HRV spectrum,which corresponds to breathing rate.Therefore,HRV could be a reliable,noninvasive,and low-cost method of assessing VT.This HRV technique has been developed and validated using specifi populations,primarily,endurance sports,5,10,14–16,19healthy people,9older people,20children,7,21and people with illness.18However,further research is needed to elucidate if HRV is a reliable and valid approach to measure VTs in professional athletes from sport teams.Thus,the purpose of this study was to determine if changes in HRV,during incremental VO2maxtests,could be used to reliably estimate VTs(VT1,VT2)in professional basketball players.This could lead to accurate determination of suitable workloads when designing a training program.The second aim of this study was to examine the relationship between HRV and the3 methods used to determine VT,using gas analysis.
2.Methods
2.1.Participants
Twenty-four professional basketball players from the Spanish Association of Basketball Clubs(ACB)league participated in this study.All participants provided signed informed consent,which was approved by the Institutional Review Board of Catholic University of Murcia and in accordance with theDeclaration of Helsinki,prior to their participation.Table 1 shows the descriptive data of the players.
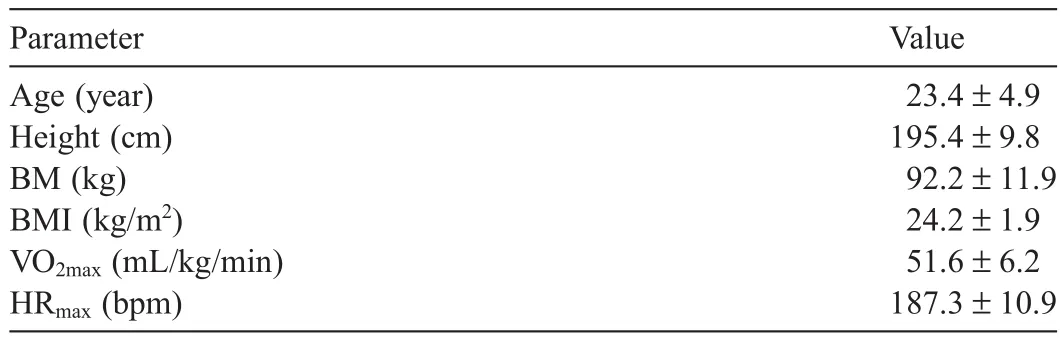
Table1 Descriptive data of the participants(mean±SD)(n=24).
2.2.Protocol
The participants had trained and competed regularly in professional basketball teams,for at least 4 years,prior to the study.The participants refrained from ingesting caffeine and alcohol for a minimum of12 h before testing.Furthermore,the participants performed their last exhaustive bout of training 48 h before the evaluation.The basketball players completed an incremental test to exhaustion on a treadmill(Run Med Technogym,Cessena,Italy)in standard environmental conditions,with the grade set at 1%.22The tests were performed between 10:00 a.m.and 12:00 p.m.in the laboratory with the room temperature set between 20°C and 22°C.During testing,gas exchange was measured using a breath-by-breath gas analyser(Met alyzer 3B;Cortex-medical,Leipzig,Germany),where oxygen consumption(VO2),carbon dioxide production(VCO2),and expired minute volume(VE)were continuously recorded and averaged every minute.The respiratory exchange ratio(R=VCO2/VO2),the oxygen ventilatory equivalent(VE/VO2)and the carbon dioxide ventilator equivalent(VE/VCO2)were calculated.The gas analyser system was calibrated before each test using the manufacturer’s recommendations.Additionally,a Polar RS800CX HR monitor(Polar Electro,Kempele,Finland)was fitte around the chest and used to measure HR and record the R-R intervals(beat-to-beat fluctuatio of HR)at a sampling frequency of 1 kHz.7After a 5 min warm-up at 7 km/h,the velocity was increased by 1 km/h every minute for optimal determination of the VTs.23The test was terminated when participants reached volitional fatigue.The end criteria was in accordance with the traditional physiological standards:24(1)occurrence of a plateau despite an increase in speed;(2)elevated blood lactate concentration(≥8mmol/L);(3)elevated respiratory exchange ratio(R≥1.0);(4)elevated HR(≥90%of(220 – age));and(5)maximal perceived exertion.Verbal encouragement was given to ensure maximum physical effort.
2.3.Data collection and reduction
The VT1 was determined by VE and HRV,and VT2 was determined by 3methods of gas analysis:VE,V-slope and R,and HRV.
Inflectio points over time were used to determine thresholds of the VE/VCO2,VE/VO2and the VE.The second increase in VE with a concomitant rapid increase in VE/VO2and VE/VCO2was define as VT2.8The VT1 was define as the firs increase of VE/VO2vs.workload,without a simultaneous increase in VE/VCO2vs.workload.8
The VT2 was define as the exercise intensity that brought about a disproportionate increase in excess CO2from steady state.25VT2 determination was assessed by gas exchange and define when R(VCO2/VO2)was greater than 1.
Furthermore,the VT2 was define as the exercise intensity in which the slope represented the increase in the minute production of CO2over the minute utilization of oxygen(VO2)from less than 1 to greater than 1.26VT2 identificatio was determined using the V-slope method.This method was applied to the sampling frequency,used in breath-by-breath gas analysis,which was modifie to display the 20 s gas collection averages.
All measurements of VT were made by visual inspection of graphs by 2 experienced exercise physiologists independently and in a blinded fashion.If the determinations of VT were not within a 3%agreement between investigators,a third trained researcher independently analyzed the same data to adjudicate the determination of VT.The adjudicated VT value was then compared with those of the initial determinations and averaged using the value within 3%of the initial measurement.
To determine VTs by HRV,all R-R interval data were exported from Polar Pro Training 5 software(Polar Electro)and analysed using Kubios HRV analysis software(Version 2.0 beta4;University of Kuopio,Kuopio,Finland).All tachograms were examined to detect and correct artefacts(<2%of the analysed beats in the present study)before HRV analysis.The R-R intervals of each stage of 60 s were used to measure HRV.For determination of the firs VT1 by HRV(HRVT1),the values of the instantaneous variability in the R-R intervals(SD1),from the Poincaré plot,were used.The HRVT1 was assessed in the firs stage of exercise,in which the difference between the instantaneous variability in the R-R intervals(SD1),of 2 consecutive stages,was less than 1ms and no longer changed significant y.Furthermore,the instantaneous HF power(HFp)trend,as a function of time and frequency over the entire exercise period,was calculated from R-R interval series using a time-varying short-term Fourier transform with 64 s moving window.VT2 was determined from HFp at the fina abrupt increase in the HF band(HRVT2).HFp range was extended from resting recordings(>0.15–0.5Hz to >0.15–2Hz).15Workload speed in HRVT1 and HRVT2 was obtained for further analysis and to attain heart rate(HR)and VO2in these physiological points.
Two independent researchers determined the thresholds using HRV analysis.When there was a greater disagreement of 3%,a third experienced investigator was involved in the process.The methodology used was similar to those made with VTs,assessed by gas exchange.
2.4.Statistical analysis
Statistical analysis was carried out using the statistical package SPSS Version 21.0(IBM Corp.,Armonk,NY,USA)and XL stat for Windows(Addinsoft,New York,NY,USA).The Gaussian distribution for the data was verifie by the Kolmogorov–Smirnov goodness-of-fi test(Z value< 1.0).HR,VO2,and speed were the variables analysed in each technique.The relationships were initially assessed by Pearson’s coefficient correlation(r).The magnitude of the correlations was assessed according to Hopkins et al.27Agreement between the methods was then determined by calculating the difference between the HRV method and the gas analysis methods tested.Furthermore,the means of absolute differences were compared to 0.Finally,Bland–Altman pairwise comparisons28were used to evaluate whether there was an agreement or bias between the VT2 and VT1.This was determined from respiratory measurements(reference technique)and HRV spectral analyses.Differences between the HRV and gas analysis methods were also tested with a paired t test.All data were reported as mean±SD and statistical significanc was set at p<0.05.
3.Results
A ll the tests performed in the study were considered maximum tests because the physiological criteria,explained in the methodology section,were met.The basketball players obtained 51.6±6.2mL/kg/min of VO2maxand 187.3±10.9 bpm ofmaximum HR.The time of the test was 12m in 19 s±2m in 4 sand the R value atVO2maxwas 1.13±0.20.
3.1.VT1
There were no significan differences between the VO2and HR,corresponding to VT1 calculated by gas analysis and HRV methods(Tables 2 and 3).However,speed was significant y higher with inflectio when compared to the HRV method.
Significan correlations between HRV technique and gas analysis method(r=0.54 in VO2;r=0.57 in HR;r=0.47 in speed)were observed(Table 3).Fig.1 illustrates the Bland–Altman analysis of the HRVT1method and the VT1 gas analysis method.There was minimal bias,with the majority of differences remaining in the 95%confidenc interval(CI).
3.2.VT2
There were no significan differences between the VO2,HR and speed,corresponding to VT2,calculated by gas analysisand HRVT2(Table 2).However,significan correlations between the HRVT2 method and variables obtained from the gas analyser VT2 were observed(Table 3).Correlations between methods in VO2,HR,and speed were:a)VO2:r=0.91 between HRV and V-slope,r=0.94 between HRV and VE,and r=0.95 between HRV and R;b)HR:r=0.90 between HRV and V-slope,r=0.96 between HRV and VE,and r=0.96 between HRV and R;c)speed:r=0.93 between HRV and V-slope,r=0.92 between HRV and VE,and r=0.91 between HRV and R.Bland–Altman analysis of the HRVT2 method and gas analysis VT2 procedures showed minimal bias and the majority of differences remained in the 95%CI(Fig.1).
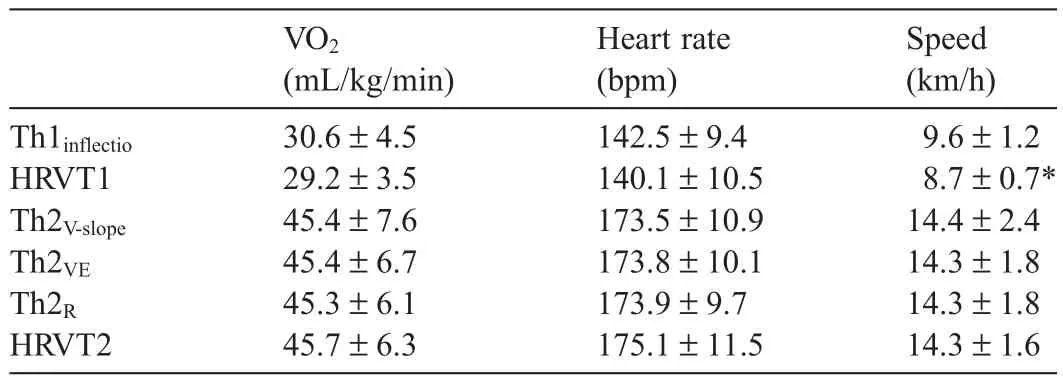
Table2 Comparison in VO2,heart rate,and speed between HRV and gas analysis methods(mean±SD).
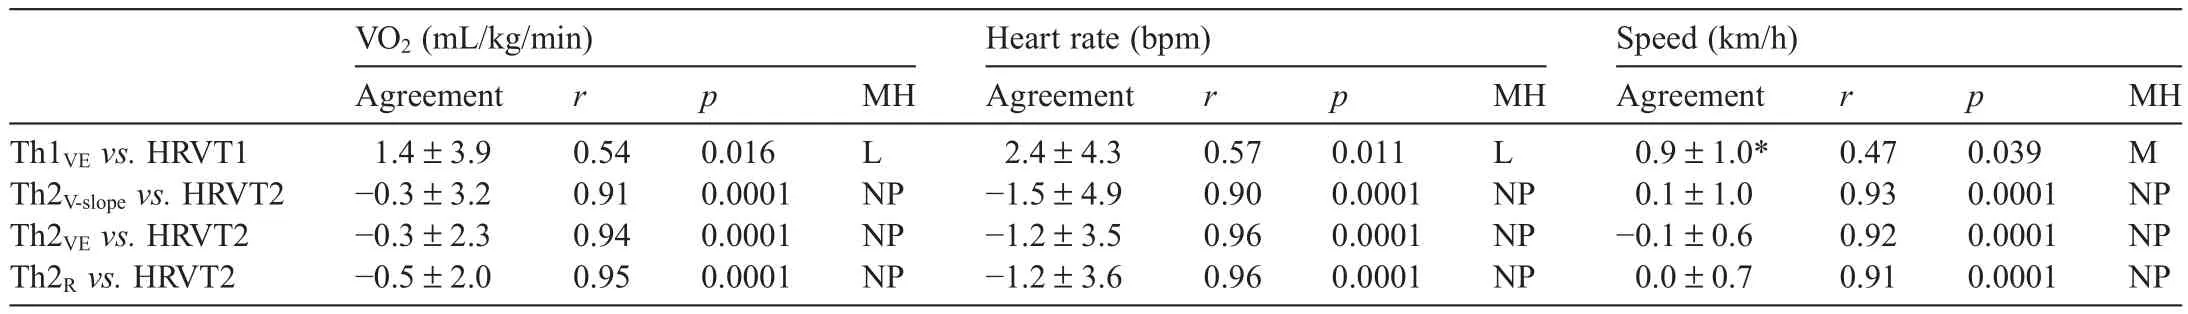
Table3 Correlations and mean of absolute differences at Th1 and Th2 between HRV technique and gas analysis methods of VO2,heart rate,and speed(mean±SD).

Fig.1.Bland–Altman plots representing the central line and 95%limits of agreement between VT parameters,as assessed from HRV and from the gas analysis.HR=heart rate;HRV=heart rate variability;IC=interval of confidence R=gas exchange ratio;Th=threshold;Th1=aerobic threshold;VE=ventilatory equivalent;VO2=oxygen consumption;V-slope=slope trends;VT=ventilator threshold.
4.Discussion
The present study shows that HRV methods may be an alternative for analysing the autonomic modulation during an incremental test to exhaustion on a treadmill in basketball players.Specifical y,HFp analysis may be useful for determining VT2,and the quantitative Poincaréplot may be appropriate for analysing VT1.Although previous studies have shown the determination of VTs using HRV in swimmers,5cyclists,15,29skiers,19and runners,7,16to our know ledge,this is the firs study that has correlated HRV responses with different gas analyser procedure techniques in professional basketball players.
In this study,HR and VO2,determined by the HRV method,could be used for measuring VT1.However,a significan difference was observed in the speed of HRVT1.Furthermore,a moderate correlation(Table3)was seen(r values ranging from 0.47 to 0.57)between HRVT1 and ergospirometric techniques in VT1.Cottin et al.’s16results showed a larger correlation between VT1 determ ined by gas analysis and the HRV method(r=0.97)compared to our study(r=0.54).This difference may be explained by the different methodology used to determine HRVT1.Dourado and Guerra20suggested the use of non-linear methods to obtain data,such as the quantitative Poincaré plot methodology(SD1),rather than the HFp method.However,the R-R interval during incremental physical efforts(results of the spectral analysis)is inconsistent when determining VT1.30Using SD1,Dourado and Guerra20found a higher correlation(r=0.84)between the speed of HRVT1 and the speed of VT1 determ ined by respiratory equivalent compared with our study(r=0.47).This difference may be explained by the differences in subject characteristics(older adults vs.professional athletes)and the type of testing protocol(walking vs.running).Although we have not found significan differences in VO2and HR,we found significan differences in speed.These finding have led us to reconsider the validity of HRV for determining the VT1.
We observed an overall significan correlation(r values ranging from 0.90 to 0.96)between the VT2measured by gas analysis methods and the HRV technique,supporting the hypothesis that VT1 and VT2 can be estimated using the HRV in an incremental running test in basketball players.Specifi cally,the results obtained in this research showed significan correlations between HRV and the gas analyser methods used,with a nearly perfect Hopkins magnitude.Although there were no significan differences between gases analysis methods,the correlation in HR values was higher between R and HRV(r=0.96)and VE and HRV(r=0.96)than V-slope and HRV(r=0.90).These correlations could be explained by the marked alternation exercise causes in autonomic function,where there is a gradual vagal withdrawal followed by sympathetic activation,17and are commonly observed during the transition between moderate-and high-intensity exercises.31
Intensities at VT2 are quite demanding,requiring great autonomic responses which may lead to a better recognition of inflectio points,as well as less discrepancy between respiratory exchange methods and HRV analysis.19In fact,high intensity exercise at VT2 causes higher concentration of catecholamines,mediated by the increase in sympathetic activity,and increased muscle glycogenolysis,which in turn increases ventilation.32In the present study,HRVT2 was determined using the time-varying method that is based on HFp and changes in breathing frequency and tidal volume.15,16In all of the basketball players,an abrupt increase in both indices was observed and associated with VT2.Therefore,when using HFp for determining HRVT2,the limit of agreement between the HR at VT2 from HRV(175.05±11.46 bpm)and ventilatory measurements(V-slope:173.53±10.90 bpm;VE:173.84±10.05 bpm;R:173.89 ± 9.71 bpm)was low(~2 bpm).These finding are consistent with others studies with regard to HR,7,19intensity such as power output,speed,5,15and VO2.9Cassirame et al.’s19study showed a strong correlation with HR and speed between VT2 and HRVT2 during a fiel test in skiers.Cottin et al.15found no significan difference in workload at HRVT2 and VT2 during cycloergometry in healthy adults.Karapetian et al.9showed results similar to those found in this study and a strong significan correlation(r=0.89)between oxygen uptake at VT2 and HRVT2 during a cyclergometer test in healthy adults.These finding suggest that HRV is an effective method to determine VT2,particularly when designing exercise intensity training for professional basketball.Additionally,HRV was found to be a reliable indicator of aerobic capacity improvements post-training.
One of the limitations of the present study was the small number of subjects(n=24)who participated in this study.Furthermore,this study was conducted on a homogenous group of basketball players during a specifi time of the season;thus,this may limit the applicability of the results.Further studies are necessary to examine the effica y of HRV technique at different points of the season,with different groups of players.Moreover,further research is needed to confim whether or not this approach provides similar results with repeated testing.
5.Conclusion
Based on the limitations and the level of the participants of this study,we concluded that the ability of the HRV time varying spectral analysis to estimate VT2 during incremental running test,in professional basketball players,was demonstrated to provide sufficien reliability and validity and thus may be implemented into a training session without the use of a gas analyser to determine HR,speed,orVO2.However,the speed at VT,in these basketball players,could not be determined with the HRV method,although no differences were observed in HR and VO2.In conclusion,the HRV method is able to identify the exercise intensity that represents the transition from a lower to a higher sympathetic activity.This method is particularly practical for coaches and basketball players to determine and adjust exercise intensities throughout the season without using expensive,ergospirometric,and invasive techniques.
Acknowledgment
The authors would like to thank all of the players who participated in this study.
Authors’contributions
DJRC conceived of the study,participated in its design and coordination,helped to determine ventilatory thresholds and drafted the manuscript;JARA participated in the design and coordination and performed the statistical analysis;VÁG carried out the performance test and participated in the threshold analysis;CMP carried out the performance test and participated in the threshold analysis;AL carried out the performance test and participated in the threshold analysis;PEA participated in the design of the study and helped draft the manuscript.All authors have read and approved the fina version of the manuscript,and agree with the order of presentation of the authors.
Competing interests
The authors declare that they have no competing interests.
1.McInnes SE,Carlson JS,Jones CJ,M cKenna MJ.The physiological load imposed on basketball players during competition.J Sports Sci 1995;13:387–97.
2.Stone WJ,Steingard PM.Year-round conditioning for basketball.Clin Sports Med 1993;12:173–91.
3.Tomlin DL,Wenger HA.The relationship between aerobic fitnes and recovery from high intensity intermittent exercise.Sports Med 2001;31:1–11.
4.Weltman J,Seip R,Levine S,Snead D,Rogol A,Weltman A.Prediction of lactate threshold and fi ed blood lactate concentrations from 3200-m time trial running performances in untrained females.Int J Sports Med 1989;10:207–11.
5.Di Michele R,Gatta G,Di Leo A,Cortesi M,Andina F,Tam E,et al.Estimation of the anaerobic threshold from heart rate variability in an incremental swimming test.J Strength Cond Res 2012;26:3059–66.
6.Svedahl K,Macintosh BR.Anaerobic threshold:the conceptand methods of measurement.Can J Appl Physiol 2003;28:299–323.
7.Buchheit M,Solano R,Millet GP.Heart-rate deflectio point and the second heart-rate variability threshold during running exercise in trained boys.Pediatr Exerc Sci2007;19:192–204.
8.Wasserman K,Whipp B,Koyl SN,Beaver WL.Anaerobic threshold and respiratory gas exchange during exercise.J Appl Physiol1973;35:236–43.
9.Karapetian GK,Engels HJ,Gretebeck RJ.Use of heart rate variability to estimate LT and VT.Int J Sports Med 2008;29:652–7.
10.Mourot L,Fabre N,Savoldelli A,Schena F.Second ventilatory threshold from heart-rate variability:valid when the upper body is involved?Int J Sport Physiol Perform 2014;9:695–701.
11.A lonso DO,Forjaz CL,Rezende LO,Braga AM,Barretto AC,Negrão C,et al.Heart rate response and its variability during different phases of maximal graded exercise.Arq Bras Cardiol 1998;71:787–92.
12.Tulppo MP,Mäkikallio TH,Seppänen T,Laukkanen RT,Huikuri HV.Vagal modulation of heart rate during exercise:effects of age and physical fitness Am J Physiol Heart Circ Physiol 1998;274:424–9.
13.Tulppo MP,Makikallio TH,Takala TE,Seppanen T,Huikuri HV.Quantitative beat-to-beat analysis of heart rate dynamics during exercise.Am J Physiol 1996;271:H244–52.
14.Blain G,Meste O,Bermon S.Influence of breathing patterns on respiratory sinus arrhythmia in humans during exercise.Am J Physiol Heart Circ Physiol 2005;288:H887–95.
15.Cottin F,Lepretre PM,Lopes P,Papelier Y,Medigue C,Billat V.Assessment of ventilatory thresholds from heart rate variability in well trained subjects during cycling.Int J Sports Med 2006;27:959–67.
16.Cottin F,Medigue C,Lopes P,Leprêtre PM,Heubert R,Billat V.Ventilatory thresholds assessment from heart rate variability during an incremental exhaustive running test.Int J Sports Med 2007;28:287–94.
17.Dourado VZ,Banov MC,Marino MC,Souza VD,Antunes LO,McBurnie M.A simple approach to assess VT during a fi el walk test.Int J Sports Med 2010;31:698–703.
18.Sales MM,Campbell CS,Morais PK,Ernesto C,Soares-Caldeira LF,Russo P,et al.Non-invasive method to estimate anaerobic threshold in individuals with type 2 diabetes.Diabetol Metab Syndr 2011;3:1–8.
19.Cassirame J,Tordi N,Fabre N,Duc S,Durand F,Mourot L.Heart rate variability to assess ventilatory threshold in ski-mountaineering.Eur J Sport Sci2014;15:1–8.
20.Dourado VZ,Guerra R.Reliability and validity of heart rate variability threshold assessment during an incremental shuttle-walk test in middle-aged and older adults.Braz J Med Biol Res2013;46:194–9.
21.Cottin F,Medigue C,Lepretre PM,Papelier Y,Koralsztein JP,Billat V.Heart rate variability during exercise performed below and above ventilatory threshold.Med Sci Sports Exerc 2004;36:594–600.
22.Jones AM,Doust JH.A 1% treadmill grade most accurately reflect the energetic cost of outdoor running.J Sports Sci1996;14:321–7.
23.Clemente-Suárez VJ,González-Ravé JM,Navarro-Valdivielso F.Short-term periodized aerobic training does not attenuate strength capacity or jump performance in recreational endurance athletes.Acta Physiol Hung 2014;101:1–12.
24.Howley ET,Bassett DR,Welch HG.Criteria for maximal oxygen uptake:review and commentary.Med Sci Sports Exerc 1995;27:1292–301.
25.Wasserman K,Stringer WW,Casaburi R,Koike A,Cooper CB.Determination of the anaerobic threshold by gas exchange:biochemical considerations,methodology and physiological effects.Z Kardiol 1994;83:1–12.
26.Beaver WL,Wasserman K,Whipp J.A new method for detecting anaerobic threshold by gas exchange.J Appl Physiol1986;60:2020–7.
27.Hopkins WG,Marshall SW,Batterham AM,Hanin J.Progressive statistics for studies in sports medicine and exercise science.Med Sci Sports Exerc 2009;41:3–13.
28.Bland JM,Altman DG.Statistical methods for assessing agreement between two methods of clinical measurement.The Lancet1986;327:307–10.
29.Garcia-Tabar I,Sánchez-Medina L,Aramendi JF,Ruesta M,Ibañez J,Gorostiaga E.Heart rate variability thresholds predict lactate thresholds in professional world-class road cyclists.J Exerc Physiol 2013;16:38–50.
30.Brunetto AF,Moreira B,Tesini B,Muller D,Pinto D.Ventilatory threshold and heart rate variability in adolescents.Rev Bras Med Esporte 2005;11:28–33.
31.Wasserman K,Hansen J,Sue D,Whipp BJ,Casaburi R.Principles of exercise testing and interpretation.4th ed.Philadelphia,PA:Lippincott Wiliams&Wilkins;2005.
32.Chwalbinska-Moneta J,Robergs RA,Costill DL,Fink WJ.Threshold for muscle lactate accumulation during progressive exercise.J Appl Physiol 1989;66:2710–6.
杂志排行
Journal of Sport and Health Science的其它文章
- The effects of aerobic exercise training on oxidant-antioxidant balance, neurotrophic factor levels, and blood-brain barrier function in obese and non-obese men
- Footfall patterns of a runner with an Achilles tendon rupture
- Three-dimensional impact kinetics with foot-strike manipulations during running
- Shock attenuation,spatio-temporal and physiological parameter comparisons between land treadmill and water treadmill running
- Tribulus terrestris extracts alleviate muscle damage and promote anaerobic performance of trained male boxers and its mechanisms:Roles of androgen,IGF-1,and IGF binding protein-3
- The influenc of different exercise intensities on kicking accuracy and velocity in soccer players