NMR Relaxation Response of CO2 Hydrate Formation and Dissociation in Sand
2017-12-18CHENHeLongWEIChangFuTIANHuiHuiWEIHouZhen
CHEN He-Long WEI Chang-Fu* TIAN Hui-Hui WEI Hou-Zhen
NMR Relaxation Response of CO2Hydrate Formation and Dissociation in Sand
CHEN He-Long1,2WEI Chang-Fu1,* TIAN Hui-Hui1WEI Hou-Zhen1
(1;2)
Quantification and characterization of hydrate formation and dissociation in sediments are highly important in the study of the physical properties of hydrate-bearing sediments. In this paper, the behavior of CO2hydrate formation and dissociation in sand is studied using the nuclear magnetic resonance (NMR) technique. The components of the pore space, including gas, liquid water, and hydrate, were quantified using a convenient method by which the hydration number was determined. No abrupt change in the relaxation behavior of the sample was found during hydrate formation and dissociation. In addition, the value of mean-log2appeared to be proportional to the liquid water content of the sample with or without the pore hydrate. A straightforward explanation is that the liquid water in the pore space remains in contact with grain surfaces, and relaxation occurs mainly at the grain surface. The results suggest that, rather than coating the grains, the hydrate is pore-filling or cementing.
Nuclear magnetic resonance; Hydrate saturation; Hydration number;Hydrate distribution; Relaxation behavior
1 Introduction
Gas hydrates are crystalline solids composed of water and small molecular-weight gases. The gas molecules are trapped in water cavities that are composed of hydrogen-bonded water molecules1. Natural gas hydrates occur widely in continental margins and arctic areas, where the conditions are suitable for hydrate formation (temperature and pressure as well as the availability of gas and water). Besides being considered as a potential unconventional energy resource2, gas hydrate is also a driver for global climate change3or a contributing factor in large submarine slide4,5.
To map hydrate occurrences and estimate the hydrate saturation, acoustic remote sensing technique is extensively used. This technique is based on the fact that hydrate stiffens the host sediment, thus increasing theandwave velocities. The stiffening effect, however, depends not only on hydrate saturation but also on the hydrate occurrence habit. Namely, pore-filling hydrate does not affect the shear stiffness unless hydrate saturates over 25%-40% of pore space to become load-bearing, while cementing hydrate stiffens the host sediment dramatically even at low hydrate saturation6. This increases the ambiguity when try to infer hydrate saturation from measured velocities7,8. Therefore, intensive efforts are directed to pore-scale measurement for hydrate formation. Modern imaging techniques, including X-ray computed tomography (CT)9,10, micro CT11-13and magnetic resonance imaging (MRI)14,15, have been widely used in the study of hydrate distribution in porous media.
The NMR relaxation technique is also capable of shedding insight into the pore-structure of hydrate-bearing sediments16. Compared to other imaging techniques, which can detail discrete pores within small samples, the NMR technique allows us to obtain static pore structure information which can be more readily used in physical modeling17.
In contrast to the common application in saturated porous media, the application of NMR in unsaturated soils, especially as complex as hydrate-bearing sediments, is scarce. In this study, the CO2hydrate was formed and dissociated in mono-disperse sands. The NMR relaxation measurements were performed. The evolution of hydrate saturation and hydration number was determined, and the NMR relaxation data were analyzed, from which the pore structure and the hydrate habit were characterized.
2 NMR relaxation in porous media
Here the principle of nuclear magnetic resonance is only briefly introduced, and a more comprehensive introduction of the technique can be found in Kleinberg17. In a static magnetic field, magnetic nuclei, such as hydrogen, are directionally aligned, and precess about the field with the Lamor frequency, resulting in additional macroscopic magnetization along the direction of the magnetic field. In NMR measurement, the magnetization is reoriented by irradiating the magnetic nuclei with the Larmor frequency pulses. After the pulse is stopped, the magnetization relaxes back to its equilibrium state.
Decaying of the magnetization component perpendicular to the static magnetic field is called the spin-spin relaxation or transverse relaxation, and in porous media it is generally described by a multi-exponential function, i.e.,
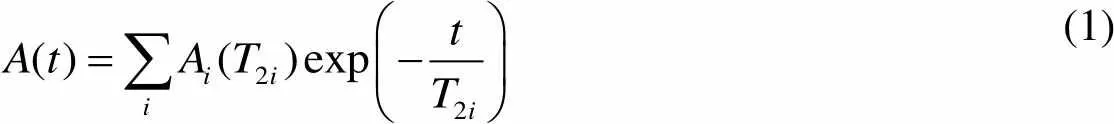
(1)
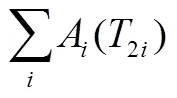
The relaxation rate,2i, is given by
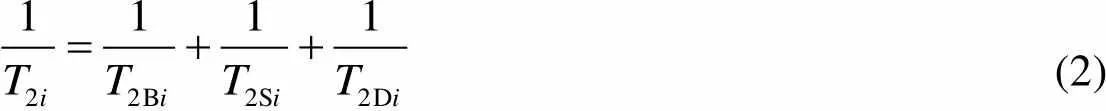
(2)
where2Bi,2Si,2Diare bulk relaxation time, surface relaxation time and diffusion relaxation time, respectively.2Biis usually larger than2Siby one order. Inside the pore space, diffusion relaxation is caused by the naturally inhomogeneous magnetic field due to the susceptibility contrast between the solid phase and the fluid in the pores and thus it is negligible at low field. Further, in a surface-limited region, the relaxation time is given by
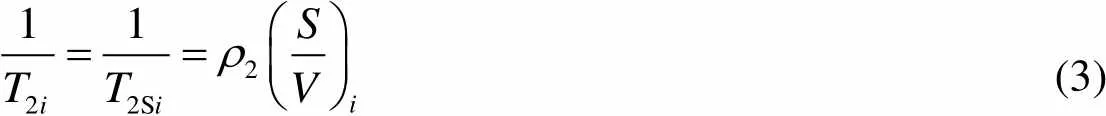
(3)
where2is the relaxivity, accounting for the effect of the solid on the relaxation of pore fluid, and is specific for a certain combination of solid and fluid. (/)is theth pore surface-to-volume ratio. Eq.(3) can only be applied to saturated porous media.
For partially water-saturated porous media, the relaxation time can be described with the dependence on the water saturation through18
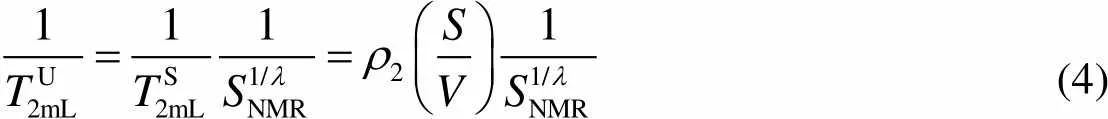
(4)
whereS2mLandU2mLare the mean-log values of the2distribution of saturated and unsaturated samples, respectively.NMRis the degree of saturation of pore water determined from the NMR signal amplitude.is a fitting parameter.
3 Equipment and methods
In this study, an experiment is sequentially performed in three phases: host sand sample preparation, hydrate formation and dissociation, and NMR relaxation measurement.
3.1 Host sample preparation
Silica sands were retrieved from Wuhan section of the Yangtze River, and sieved into particles having diameters in the range 0.25−0.5 mm. The sand was step-wise wetted with distilled, deionized water to a desired water content (11.9%), and mixed until water distributed visually homogeneous. 25.42 g of moistened sand was tampered gently into a cylindrical bottle to a porosity of 43.3% and water saturation of 0.42. The sample bottle, having the volume of 15 cm3, is made of Polytetrafluoroethylene (PTEE) that imposes no interference in magnetic field and has no NMR signals.
3.2 Hydrate formation and dissociation
A pressure cell was manufactured with polyetheretherketone (PEEK), a high-strength material, which can withstand the high pressure of hydrate reaction and has no NMR signals and imposes no interference to the magnetic field. The bottle containing moistened sands was put into the pressure cell. The cell was evacuated for about 5 min to remove the air in the cell and sample, then it was weighted again and the water loss induced by evacuation was subtracted from the sample. About 3.8 MPa CO2gas (purity >99.9%) (produced by Wuhan Xiangyun Gas Co.) was injected into the cell in a smooth way such that the disturbance to the sample can be minimized. In the cell, the ratio of the mole of CO2gas to the mole of water is nearly 0.55, meaning that the gas in the cell is sufficient to convert all the water content into hydrate (ideally, the guest-gas-to-water ration in hydrate is 1 : 5.75). The cell was then immersed in a cool bath (product ID: THD 2020, by Ningbo Tianheng Instrument Factory), and kept at 283.15 K for about 2 h. The bath temperature was reduced to 279.15 K and kept for nearly 12 h. Although the pressure and temperature was kept within the stable zone of hydrate, no hydrate formation was detected during this period. The bath temperature was further reduced to 274.15 K to induce hydrate formation.
The variations of the gas pressure in the cell and bath temperature were recorded once per minute. It was observed that when the temperature difference between the interior of the cell and the bath was about 5 K, it took about 15 min for the cell to reach the same temperature as the bath. Considering the fact that hydrate formation is time-consuming (tens of hours), it is reasonable to regard the temperature of bath as the temperature of the sample inside the cell throughout the test.
An indicator of hydrate formation is observed from the measured pressure data (Fig.1). From the temporal variation curve of the cell pressure, a steep drop can be clearly identified. Such a drop in pressure resulted from hydrate formation that consumed CO2gas from the gas phase. After hydrate formed at 274.15 K for about 24 h, the temperature was increased stepwise to allow the hydrate to dissociate. At each temperature step the system was maintained for about 4 or 12 h. During application of temperature step, additional rise of gas pressure resulting from hydrate dissociation was observed. It can be seen that hydrate started to dissociate when the temperature rose from 279.15 to 280.15 K.

Fig.1 Temporal variations of gas pressure and temperature during the experiment.
The circle denotes the start point of the steep pressure drop due to hydrate formation.
3.3 NMR relaxation measurement
NMR relaxation measurements were performed using a 23 MHz MiniMR system developed jointly by the Institute of Rock and Soil Mechanics, Chinese Academy of Sciences, and Niumag Corporation. Combined with a cool-dry air supply unit, the NMR analysis system is applicable to hydrate-bearing or frozen samples. The dead time of NMR system is 70 μs, which is much longer than the relaxation time of proton in hydrate. Thus it is reasonable to assume that all the signals detected by the NMR system come from the liquid water.
The transverse relaxation measurements were conducted throughout the test, using the Carr-Purcell-Meiboom-Gill (CPMG) pulse sequence withE= 240 μs and 10000 echoes. Before putting the whole cell into the sample cube in NMR system, the cube was blown with cool dry air to keep at such a low temperature that minimize interference of environment temperature to the sample in the cell. An iterative regularization method based on the Trust-Region Algorithm was used for the inversion of2distribution. The time when relaxation measurement were performed and the signal amplitudes are listed in Table 1, for brevity. Also listed are the gas pressure and temperature of the sample during the relaxation measurements. The end of gas injection is set to the time zero of the test.
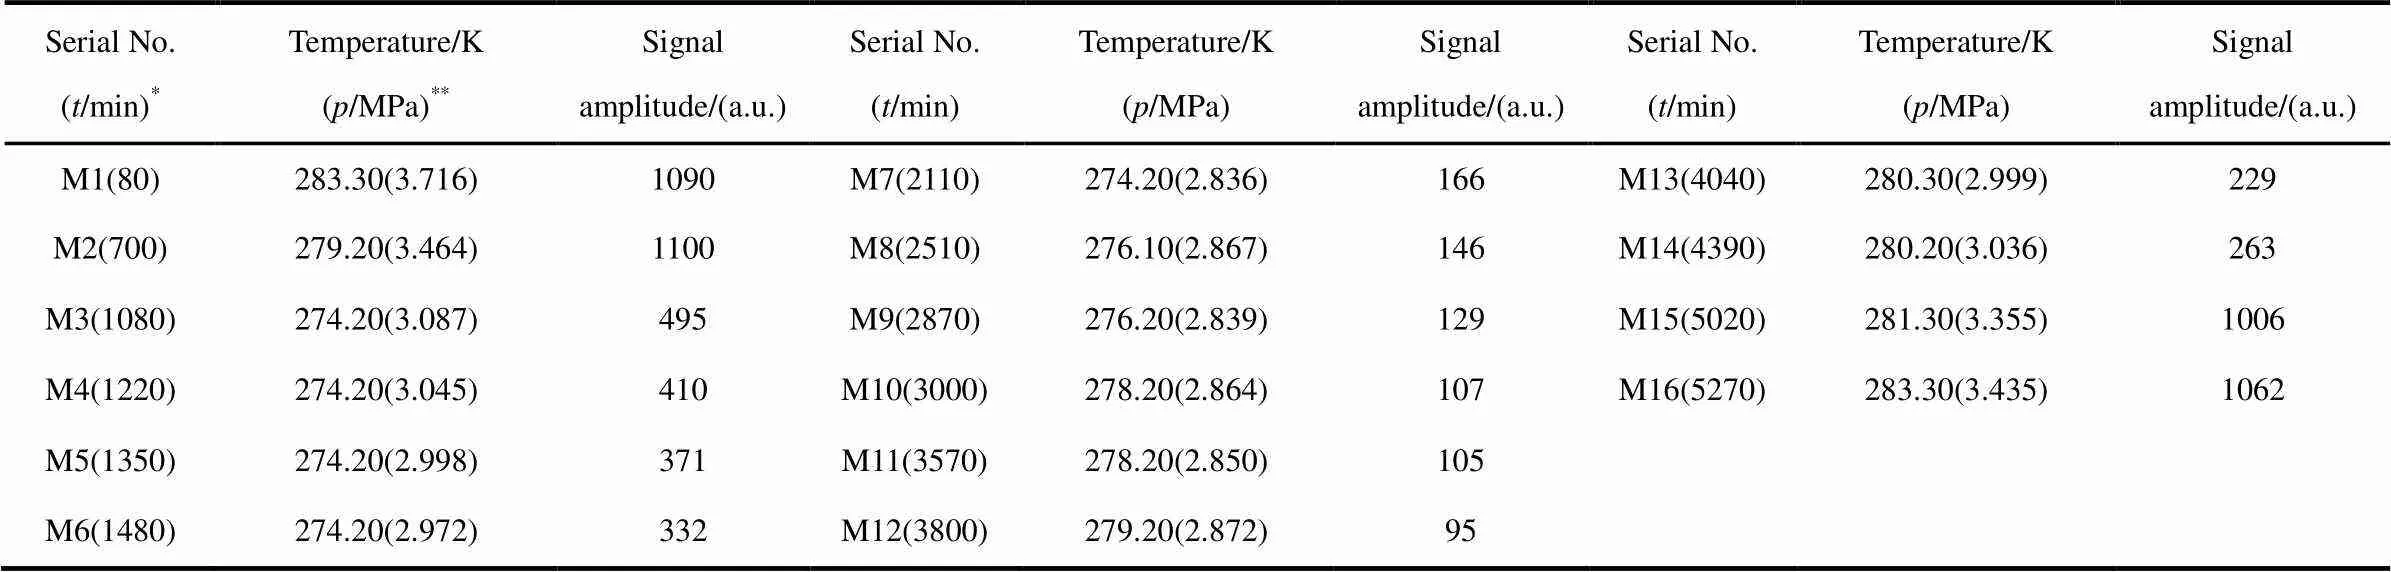
Table 1 Series of NMR relaxation measurements.
* In the brackets the number is the time when the NMR relaxation measurement was conducted with the end of gas injection set as the time zero. ** The column lists the temperature and gas pressure in the sample.
3.4 Quantification of CO2 and water contained in hydrate
As noted above, the NMR signals from hydrate are absent and thus all the signals are solely due to the liquid water. Since the liquid water in the sample is proportional to the NMR signal magnitude, the amount of water molecules in hydrate is readily determined through the difference between the current and initial signal values.
No hydrate was formed in the system at the start of test, thus the initial amount of CO2was the sum of gaseous and dissolved one. The solubility of CO2in water and the molar volume of gaseous CO2were calculated using a routine offered by Diamond and Akinfiev19When the hydrate formed, the total amount of CO2was equal to the sum of CO2in the phases of hydrate and non-hydrate. Here, the non-hydrate phase is referred to the combination of the gas phase and the liquid phase. Another routine proposed by Sun and Duan20was used to compute the solubility of CO2in liquid water in the presence of hydrate. In this test, the total amount of CO2in the system was unchanged. Eventually subtracting from the total the amount of non-hydrated CO2, which included gaseous and dissolved CO2, the amount of CO2contained in hydrate was determined. The ratio of the amount of water molecules to guest molecules in hydrate, which is called hydration number, can also be calculated.
Assuming reasonably a constant hydrate molar volume for the narrow range of temperature and pressure in the test, hydrate saturation is determined:

(5)
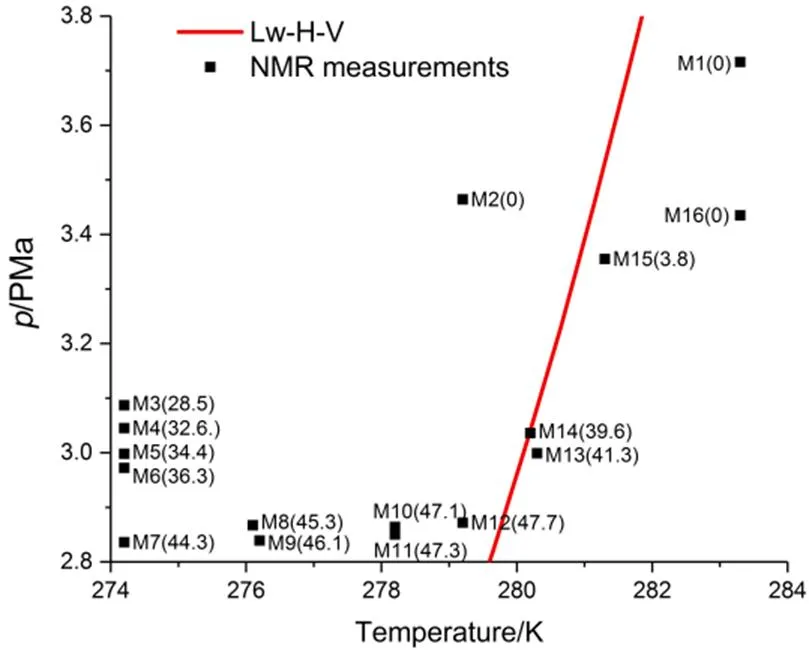
Fig.2 NMR measurements series.
The number in brackets is the hydrate saturation (%). Lw-H-V equilibria data are referred to Sloan and Koh1: Lw-liquid water, H-hydrate, and V-gas.
The temporal variations of hydration number and hydrate saturation during hydrate formation process are plotted in Fig.3. The time axis is shifted with zero corresponding to the start point of the steep pressure drop that was regarded as the beginning of hydrate formation. As the reaction progressed, the rate of hydrate formation decreased. In contrast, the decreasing hydration number suggested that the empty cages, emerged at the early stage of hydrate formation, were gradually filled by CO2molecules. This phenomenon was also discussed by Geng22. If the hydration number was fitted with an exponential function, a value 19.6 of hydration number was obtained at= 0. This value is close to the ratio of the number of water molecules to guest molecules in the metastable solution on the verge of hydrate nucleation obtained by Guo and Rodger.23, showing consistency with previous results.
Fig.3 Temporal variations of hydrate saturation and hydration number.
For clarity, some but not all of the2spectrums during hydrate formation and dissociation are shown in Fig.4. The2spectrums obtained during hydrate dissociation are indicated with dashed line (M14 and M16), others by solid lines. It is clear that each2spectrum has two peaks, showing the occurrence of water that resides in pores of two distinct sizes17. As hydrate formed, both peak amplitudes decreased, indicating that liquid water in the large and small pores had been converted into hydrate simultaneously. This is because that the freezing point depression in coarse sand is negligible. In addition, the sample is over-cooled for about 6 K, thus thermodynamic control of pore size is not the dominant factor16.
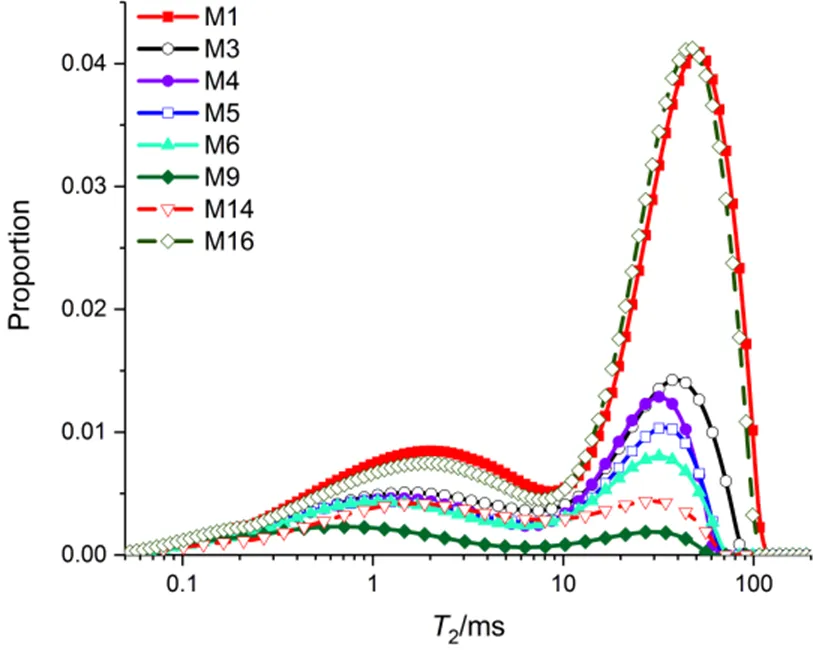
Fig.4 T2 distribution evolution during hydrate formation and dissociation.
It can be also seen that as the hydrate grows, the2distribution moves to the regime of shorter relaxation times, and as the hydrate dissociates the2distribution moves back. The appearance or disappearance does not result in abrupt shift of the two peaks of2distribution. Such a relaxation response makes it possible to identify the growth habit of hydrate in the sample. Before doing this, we shall emphasize a subtle but important point. As noted in Section 2, the relaxation time is controlled by surface relaxation which is specific for liquid-solid combination. At the water-grain interface, the relaxation mainly occurs at paramagnetic centers at grain surface17. At the water-hydrate interface, the proton spin is relaxed dominantly by intra-dipole-dipole interaction which is a totally different mechanism24.
Four possible hydrate growth habits in rich-gas condition is shown in Fig.5. If hydrate formed as coating grains (Fig.5(a)), hydrate formation would have created a water-hydate interface instead of the water-grain interface, and different relaxation response would have occurred. If hydrate formed as layers over liquid water (Fig.5(b)), additional fast relaxation at water-hydrate interface24would have made the relaxation time much shorter. Clearly, the relaxation data in this study are inconsistent with the above two hydrate habits. The other two hydrate habits, pore filling (Fig.5(c)) and cementing (Fig.5(d)), do not alter the pore environment of water, and thus do not cause an abrupt change of relaxation time, which is consistent with the relaxation response observed in our experiments.
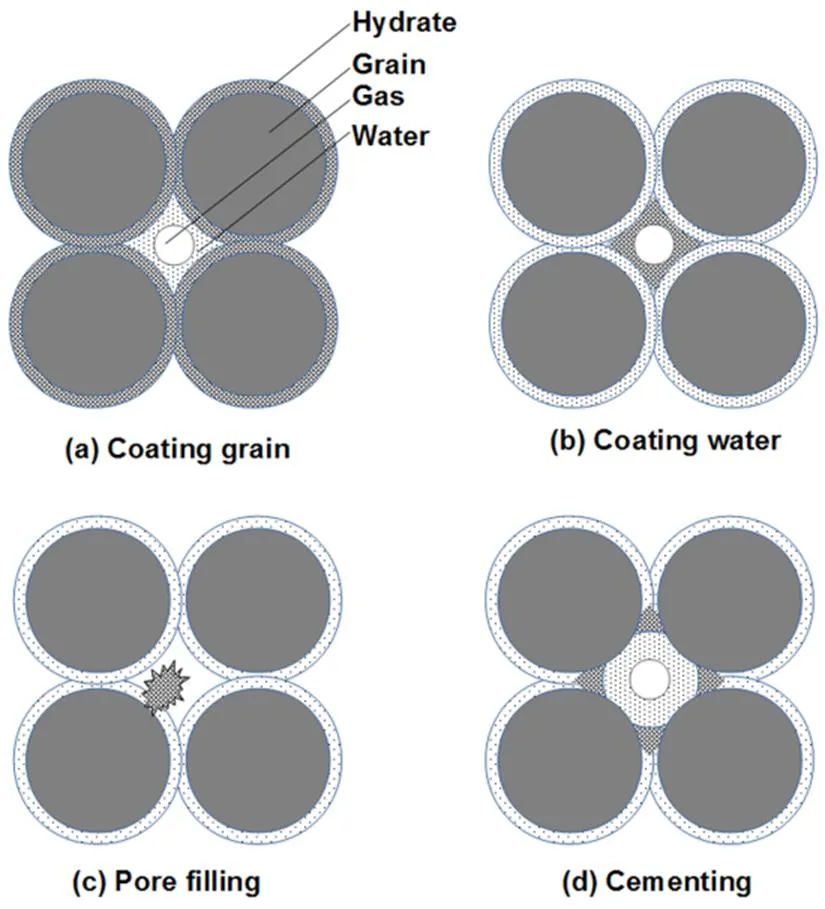
Fig.5 Illustration for hydrate habits.
(a) hydrate coats the grain, (b) a layer of water coats the grain, and hydrate forms at the surface of water, (c) hydrate forms at certain location on the grain surface, and grows into pore space, and (d) hydrate forms at the contact of grains, cementing the grains together.
The mean-log relaxation time is plotted against water content in Fig.6. Data collected with the same sand sample of different water contents in absence of hydrate is also shown in the figure. As clearly seen, the data points can be reasonably well fitted by a straight line. According to Eq.(4), it is also clear that the relaxivities in sands with or without hydrate are the same, and= 1; this further verifies that hydrate formation did not significantly change the pore environment of liquid water. Similarly, possible hydrate habit is directed to pore filling or cementing. Compared to pore-filling hydrate, cementing hydrate isolates pores from each other since it forms at the throats of pore space, dramatically reducing water diffusion. Therefore, although these two hydrate habits cannot be distinguished through the relaxation measurements, it is possible to identify which one is the true hydrate habit by the diffusion measurements.
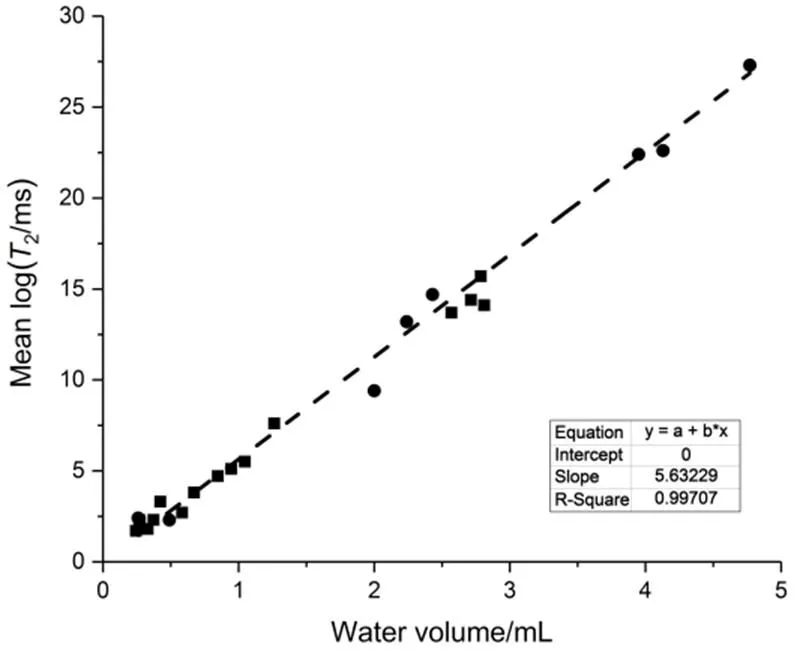
Fig.6 Relationship between mean-log T2 and water volume.
The squares denote data collected during hydrate formation and dissociation test, and circles denote data collected with the partially water-saturated sand in the absence of hydrate. The dashed line is a linear fitting for all data.
5 Conclusions
This study presents a set of NMR relaxation measurements of sand within which CO2hydrate formed and dissociated. It is shown that in coarse sand, rather than the pore sizes, the thermal condition was the dominant factor in the hydrate formation and dissociation. A convenient and accurate method has been proposed to quantify various components in the hydrate-bearing sand. Based on this quantitative method, a reasonable value of the ratio of the number of water molecules to guest molecules in the metastable solution prior to hydrate nucleation was obtained. A comprehensive analysis for the relaxation behavior of the pore water during the hydrate formation and dissociation is presented, which can shed new light into the hydrate occurrence habit in sediments. It is suggested that combined with the NMR diffusion measurement, the NMR technique could provide further evidence to identify whether hydrate forms at grain surface or at grain contact.
(1) Sloan, E.D.; Koh, C. A., 3rd ed.; CRC Press: New York, 2008.
(2) Makogon, Y. F.; Holditch, S. A.; Makogon, T. Y..2007,, 14. doi: 10.1016/j.petrol.2005.10.009
(3) Kvenvolden, K. A.. 1993,, 173. doi: 10.1029/93RG00268.
(4) Mienert, J.; Posewang, J.; Baumann, M. Gas hydrates along the northeastern Atlantic margin: possible hydrate-bound margins instabilities and possible release of methane. In; Henriet, J. P., Mienert, J. Eds.; Geological Society: London, 1998; Vol. 134, pp 275-291 (Special Publication). doi: 10.1144/GSL.SP.1998.137.01.22
(5) Sultan, N.; Cochonat, P.; Foucher, J. P.; Mienert, J.2004,, 379. doi: 10.1016/j.margeo.2004.10.015.
(6) Waite, W. F.; Santamarina, J. C.; Cortes, D. D.; Dugan, B.; Espinoza, D. N.; Germaine, J.; Jang, J.; Jung, J. W.; Kneafsey, T. J.; Shine, H.; Soga, K.; Winters, W. J.; Yun, T. S.2009,, RG4003. doi: 10.1029/2008RG000279
(7) Helgerud, M. B.; Dvorkin, J.; Nur, A.; Sakai, A.; Collett, T. S.1999,, 2021. doi: 10.1029/1999GL900421
(8) Priest, J. A.; Rees, E. V. L.; Clayton, C. R. I..2009,, B11205. doi: 10.1029/2009JB006284
(9) Ersland, G.; J. Husebo, A.; Graue, B. A.; Howard, B. J.; Stevens, J.2010,, 25. doi: 10.1016/j.cej.2008.12.028.
(10) Kneafsey, T. J.; Tomutsa, L.; Moridis, G. J.; Seol, Y.; Freifeld, B. M.; Taylor, C. E.; Gupta, A.2007,, 108. doi: 10.1016/j.petrol.2006.02.002
(11) Zhao, J.; Yang, L.; Xue, K.; Lam, W.; Li, Y.; Song, Y.2014,, 124. doi: 10.1016/j.cplett.2014.07.066
(12) Rees, E. V.L.; Priest, J. A.; Clayton, C. R. I.2011,, 1283. doi: 10.1016/j.marpetgeo.2011.03.015
(13) Kerkar, P. B.; Horvat, K.; Jones, K. W.; Mahajan, D.. 2014,, 4759. doi: 10.1002/2014GC005373.
(14) Chaouachi, M.; Falenty, A.; Sell, K.; Enzmann, F.; Kersten, M.; Haberthür, D.; Kuhs, W. F.2015,, 1711. doi: 10.1002/2015GC005811.
(15) Bagherzadeh, S. A.; Moudrakovski, I. L.; Ripmeester, J. A.; Englezos, P.2015,, 3083. doi: 10.1021/ef200399a.
(16) Kleinberg, R. L.; Flaum, C.; Griffin, D. D.; Brewer, P. G.; Malby, G. E.; Peltzer, E. T.; Yesinowski, J. P. J.2003,, 2508. doi: 10.1029/2003JB002389.
(17) Kleinberg, R. L. Nuclear Magnetic Resonance, In; Wong, P. Z. Eds.; Academic Press: San Diego, USA, 1999; pp 337–385. doi: 10.1016/S0076-695X(08)60420-2
(18) Costabel, S.; Yaramanci, U.2011,(2), 155. doi: 10.3997/1873-0604.2010055
(19) Diamond, L. W.; Akinfiev, N. N.2003,, 265. doi: 10.1016/S0378-3812(03)00041-4
(20) Sun, R.; Duan, Z.2005,(18), 4411. doi: 10.1016/j.gca.2005.05.012
(21) Yan, R.T.; Wei, H. Z.; Wu, E. L.; Wang, S. Y.; Wei, C. F.2011,, 295. [颜荣涛, 魏厚振, 吴二林, 王淑云, 韦昌富. 物理化学学报, 2011,,295.] doi: 10.3866/PKU.WHXB20110204
(22) Geng, C. Y.; Ding, L. Y.; Han, Q. Z.; Wen, H.2008,, 595. [耿春宇, 丁丽颖, 韩清珍, 温 浩. 物理化学学报, 2008,,595.] doi: 10.3866/PKU.WHXB20080409
(23) Guo, G.; Rodger, P. M.2013,, 6498. doi: 10.1021/jp3117215
(24) Gao, S.; Chapman, W. G.; House, W.. 2009,, 208. doi: 10.1016/j.jmr.2008.12.022
CO2水合物在砂中生成和分解的核磁共振弛豫响应
陈合龙1,2韦昌富1,*田慧会1魏厚振1
(1中国科学院武汉岩土力学研究所,岩土力学与工程国家重点实验室,武汉 430071;2中国科学院大学,北京 100049)
水合物在沉积物中生成和分解的定量和表征对于含水合物沉积物的物理性质的研究有重要意义。基于核磁共振(NMR)技术研究了水合物在砂中的形成和分解行为,以一种简便的方式计量了孔隙空间中各组分的含量,包括气体、液态水和水合物,并确定了水合数。在水合物形成和分解过程中试样的弛豫行为并没有发生突变,此外,对于含或不含水合物的试样,平均对数2时间都与含水量成比例关系,直接的解释是液态水始终保持与颗粒表面的接触,弛豫主要发生在颗粒表面,表明水合物以孔隙填充或胶结的形式而不是颗粒涂层的方式存在。
核磁共振;水合物饱和度;水合数;水合物分布;弛豫行为
O642
10.3866/PKU.WHXB201704194
March 13, 2017;
April 6, 2017;
April 19, 2017.
Corresponding author. Email: cfwei@email.com; Tel: +86-27-87197153.
The project was supported by the National Natural Science Foundation of China (51239010, 41572295, 41502301) and Youth Innovation Promotion Association ofChinese Academy of Sciences (2015272).
国家自然科学基金项目(51239010, 41572295, 41502301)和中国科学院青年创新促进会项目(2015272)资助
