基于土壤水分异质性的小麦滴灌试验小区布设方法
2017-12-15王鹏翔陈智芳申孝军王景雷
王鹏翔,宋 妮,陈智芳,王 峰,申孝军,王景雷
基于土壤水分异质性的小麦滴灌试验小区布设方法
王鹏翔1,2,宋 妮1,陈智芳1,王 峰1,申孝军1,王景雷1※
(1. 中国农业科学院农田灌溉研究所/农业部作物需水与调控重点开放实验室,新乡 453002; 2.中国农业科学院研究生院,北京 100081)
科学合理地确定适宜的试验小区规格,对于经济、高效地获取具有较高精度和代表性的试验数据具有重要现实意义。该研究以确定滴灌条件下适宜的试验小区规格为目标,采用幂函数建立土壤含水率方差与不同小区面积之间的相关关系,计算土壤水分异质性指数以表征试验小区内土壤含水率的相关程度;利用土壤含水率异质性指数,采用Hatheway法确定小麦滴灌试验小区适宜的面积和重复数;根据不同方向上土壤含水率异质性指数研究形状对试验结果的影响,确定试验小区适宜的长宽比。结果表明:增大试验小区面积可以提高试验数据的准确性,但不同面积区间数据离散程度的降低幅度变化较大:面积由1 m2增大到50~100 m2,灌水定额30 mm处理田块间土壤含水率方差降低77.4%~82.6%,灌水定额45 mm处理降低78.6%~83.7%,面积从100 m2增加到500 m2,方差降低幅度显著变小,灌水定额30 mm处理降低17.4%,灌水定额45 mm处理降低16.3%;增加试验重复数可以增加试验对处理间土壤含水率差异的区分能力,试验小区面积在50~100 m2时,重复数由2增加到3能检测出的处理间土壤含水率差异由23.2%~26.5%提高到13.1%~15.0%,表明增加试验重复数可以检测出试验处理间更小的土壤含水率差异,提高试验精度。通过研究滴灌试验小区土壤水分异质性指数与滴灌试验小区规格之间的关系,综合考虑试验精度、代表性和田间实际操作得出以下结论:若试验为高、低水2处理时,试验布设宜为3重复,每重复小区面积为50 m2,可在80%的概率下检测出15%的真实差异;若试验为高、中、低3处理时,试验布设宜为3重复,每重复小区面积为100 m2,可在80%的概率下检测出12%的真实差异。滴灌试验小区适宜的形状为沿滴灌带方向布设的长方形,长宽比在1:1到5:1之间可使试验小区所得数据更具代表性。
土壤水分;异质性;布设;试验小区规格;重复数;滴灌;小麦
0 引 言
节水灌溉是促进农业高产稳产,提高农业用水效率的主要措施,对于保障中国粮食安全、水安全及生态安全具有重要意义。节水灌溉规划中需要的作物需水量、灌溉管理中作物灌水控制指标以及效益评价的水分利用效率等基础数据需要精准地进行灌溉试验才能确定。灌溉试验结果受外部环境因素影响较大,为了经济准确地获取相关参数,除了对相关监测设施在时间和空间上进行必要的优化外,还要求选取的试验小区规格必须具有一定的代表性,因此科学合理地确定试验小区规格不仅直接关系到试验误差的控制[1],还可节省大量人力、物力和财力,提高工作效率,有利于灌溉试验的标准化。
冬小麦是中国北方的重要粮食作物,生育期内降水较少,不能满足其生长需要,对灌溉的依赖性较强。北方地区水资源较少,其他行业用水激增,使得农业用水资源量逐年缩减,滴灌设施以及相应技术的发展使得冬小麦滴灌成为可能。目前冬小麦滴灌试验主要集中于灌水量、灌水时间的合理分配以及提高水分利用效率等模式的研究[2-4],其试验小区规格多参照灌溉试验规范执行[5]。灌溉试验规范中仅根据作物的高矮和灌溉方法界定了一个范围,没有给出该范围提出的依据,同时,在实际操作中通常是根据试验区总面积和处理数随机确定,这使得试验结果的统一性较差,缺乏代表性。
目前,确定试验小区最优面积的方法可分为最大曲率法和Hatheway法2种。最大曲率法是根据田间试验数据的变异系数(coefficient of variation,CV)与试验小区面积大小的关系曲线来确定试验小区面积。当试验小区面积增大时,CV最初下降快,之后下降速度逐渐减慢,CV与小区面积的关系曲线在曲率最大处的小区面积为试验小区的适宜面积[6-11]。由于此方法确定的小区面积为最小面积,对应的CV随着面积增加还有较大的下降空间。因此,又有学者提出了采用CV的相对减少值作为衡量曲线趋于平缓的标准来确定适宜面积[12]。Hatheway法是由Hatheway[13]基于Cochran等[14]的数理统计公式结合Smith[15]的关于土壤异质性经验公式提出的通过土壤异质性指数、土壤含水率变异系数、两处理间真实差异来确定试验小区面积及重复数的一种方法。2种方法各有优缺点,最大曲率法简单易行,但所考虑的影响因素比较单一。Hatheway法可以在考虑土壤异质性的条件下确定试验的重复数和适宜小区面积,较最大曲率法考虑因素更为全面,是目前最为提倡的一种方法[16-20]。国内外学者在试验小区适宜规格的确定中已做了大量工作,但所确定的规格大多只考虑作物及产量的影响[21],考虑滴灌等局部灌溉造成的土壤水分空间变异对试验小区适宜规格的研究尚未见报道。
对于试验小区形状,小区土壤水分分布如果是各向同性的,小区形状不会对试验结果造成影响,但滴灌是局部灌溉,并且实际中试验小区土壤特性也多是各向异性的[22],试验小区的布设规则一般是在小区长边沿着土壤特性差异大的方向布设,使得试验小区能够包含更多的空间变异,试验小区所得数据更具有代表性,减少小区重复间差异[23-25]。对于小区适宜长宽比的具体布设范围,大都是引入Smith异质性指数,由于试验小区横向、纵向上的土壤水分异质性指数是不同的,土壤水分变异程度大的方向土壤水分异质性指数大,因此可通过土壤水分异质性指数研究各向异性土壤相较于各向同性土壤不同规格下试验小区对试验结果产生的影响[26-27],确定试验小区适宜规格。
本研究的主要目的是通过研究试验小区土壤水分变异性、土壤水分异质性指数与试验小区面积间的关系来确定试验小区适宜面积、重复数以及形状,从而确定灌溉试验小区适宜规格。这对灌溉试验标准化及提高试验数据的代表性具有重要意义。
1 材料与方法
1.1 研究区概况
试验于2016年3月—2017年5月在中国农业科学院农田灌溉研究所七里营试验基地进行,该试验点位于河南省新乡市(35°19′N、113°53′E,海拔73.2 m)。多年平均气温14.1 ℃,无霜期210 d,日照时数2 398.8 h,光热资源丰富,以一年两熟耕作制度为主;多年平均降水量为582 mm,7-9月占全年降水量的70%~80%;多年平均蒸发量2 000 mm。供试土壤质地为粉壤土,地下水埋深大于5 m,试验地为常年耕作地,由于常年进行深翻、平整,水平方向土壤质地变化较小。1 m土体内土壤性质见表1。
1.2 试验设计
试验设置30、45 mm共2个灌水定额处理,各处理试验地长50 m(沿滴灌带方向),宽10 m(图1),每条滴灌带间隔0.5 m,共20条滴灌带,每米滴灌带上3个滴孔。成熟期以前,根据计划湿润层(0~60 cm)的土壤含水率下限来确定灌水时间,以灌水定额45 mm处理(即田持的65%)作为灌水下限控制因素,当灌水定额45 mm处理达到田持的65%后2个处理同时灌水。试验期间共灌水4次,灌水日期分别为3月19日、4月13日、4月26日、5月8日。参考当地传统的施肥管理模式,在冬小麦返青期(3月19日)、拔节期(4月13日)进行追肥,每处理追施滴灌专用尿素225 kg/hm2。
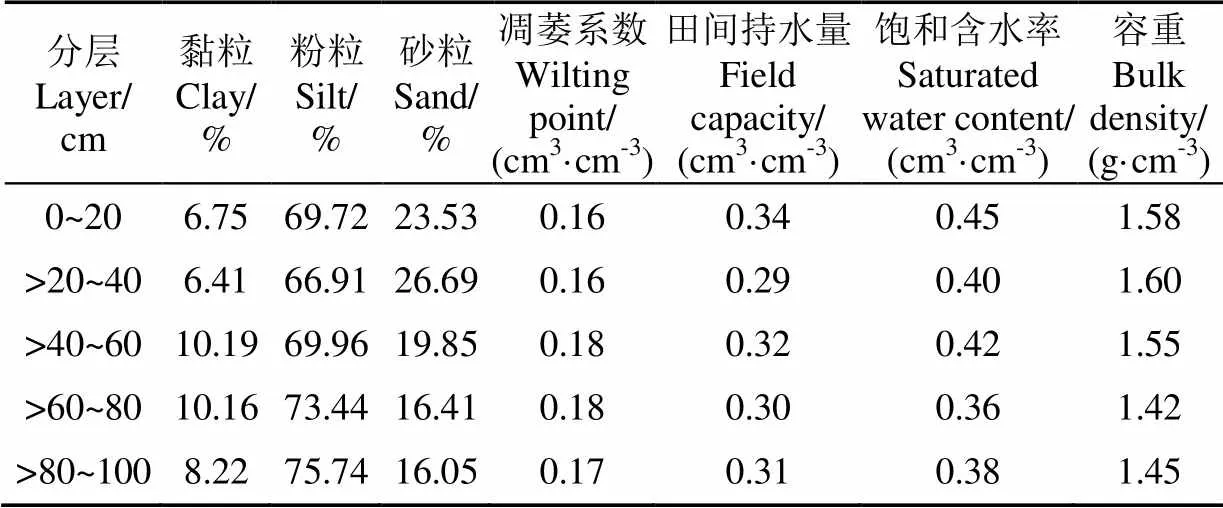
表1 试验区土壤性质
采样点取土位置的优化选取:为了研究土壤水分空间变化需要计算小区内每m2单元格土壤含水率,对于滴灌土壤含水率的计算,一般采用9点平均值计算,试验地面积500 m2,如果仍采用9点法计算必将对土壤结构产生破坏,影响空间上土壤的采样,且工作量较大实施困难。因此选用误差分析法[28]对每条滴灌带与试验地对角线相交处采用9点法测量得土壤含水率(20条滴灌带,共40个取土点)对采样点取土位置进行优化,取土点布设如图1所示。
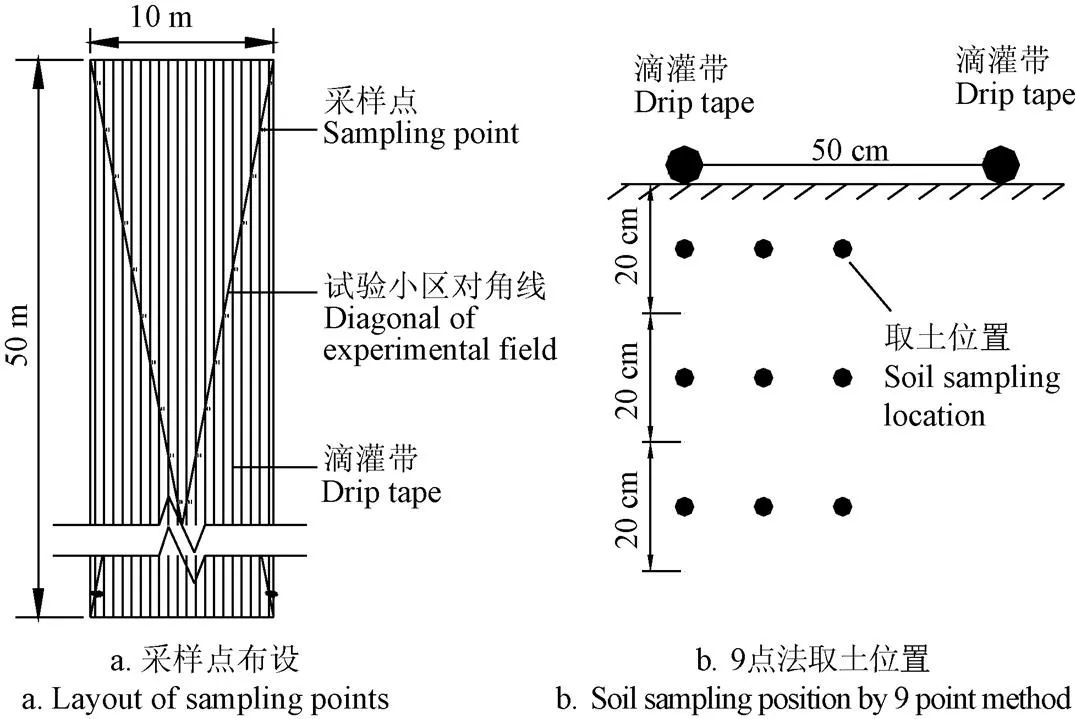
图1 采样点及其取土位置布设
采样点空间布设:确定过采样点取土的优化位置后,对试验地采用网格化均匀划分为500个1 m2单元格(横向隔行选取滴灌带,纵向沿滴灌带方向每1 m划分,即每个单元格为2行×1 m=1 m2)每个单元格内采样点围绕优化选取后的取土位置(距滴灌带12.5 cm,深20~30 cm处)进行9点取样取土研究小区内土壤水分异质性,土壤含水率用烘干法测定。
1.3 试验方法
1.3.1 采样点取土位置优化分析

1.3.2 土壤水分异质性指数的确定
根据试验小区面积将小区平均划分为相同面积的单元格,即将500 m2的试验小区按1、2、4、5、10、20、25、50、100、125、250、500 m2分别划分为500、250、125、100、50、20、10、5、2、1个田块。通过计算田块土壤质量含水率方差与田块面积之间的关系,计算试验小区的土壤水分异质性。异质性指数由Smith[15]经验公式得出
V=V1/S(3)
式中为小区所划分田块的面积;V为田块面积为的田块间方差;1是最小田块(面积为1 m2的基本田块)间的方差;土壤异质性指数,表示土壤水分之间的相关性,如果1则构成试验小区的基本田块完全不相关;相对地,如果=0,则小区基本田块间完全相关且V=V1,小区面积增加不会对试验结果造成影响。通常情况下在0和1之间,对于土壤异质性指数不为0的试验小区,小区面积越大则所包含的数据变异越多,较大的试验小区面积有利于提高试验精度。1个田块时方差为0。
1.3.3 小区面积与重复数的确定
试验小区的适宜面积不仅与土壤水分异质性相关,还应考虑到重复数等影响因素,通过Hatheway公式[13]来估算试验小区适宜的面积与重复数:
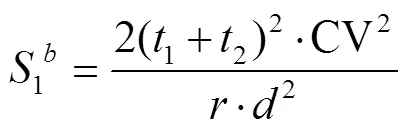
式中1指适宜小区大小;为土壤异质性指数,由Smith方程得出;1显著水平所对应的值,取=0.05;2指2(1-)所对应的值,指试验处理间真实差异能被鉴别出的概率,取=80%;CV指基本田块(1 m2田块)间的变异系数;指重复数;指期望通过试验检测出的处理间真实差异,%。
1.3.4 小区形状的确定
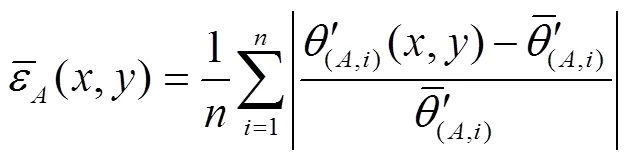
对于试验小区形状,不同方向上的土壤水分异质性影响试验小区试验结果的变异性与代表性,小区不同方向上的土壤水分异质性、试验小区规格与试验小区间方差的关系可由下式表示

2 结果与分析
2.1 采样点取土位置优化分析

图2 不同灌水定额土壤含水率平均相对误差(RE)分布
由图2可见,灌水定额为45 mm的处理误差在5%和4%下的区域明显小于灌水定额为30 mm处理的相同误差区域。2个处理的最优区域(RE≤4%的区域)纵向均分布于地表以下20~30 cm处。相比灌水定额为30 mm,灌水定额为45 mm处理的最优区域横向远离滴灌带,灌水定额为30 mm处理最优区域位于距滴灌带8~15 cm处,灌水定额为45 mm处理的位于距滴灌带12~16 cm处。由于2个灌水定额最优区域的纵向位置相近(20~30 cm),横向位置接近,为方便田间操作,结合9点法取土分布,以距滴灌带横向距离为12.5 cm,地表下20~30 cm处为采样点取土的最优位置,认为此位置土壤含水率能代表该取土点处9点法所得的平均土壤含水率。
2.2 土壤异质性指数的确定
根据相同面积下田块土壤含水率平均数之间的方差,通过方差与田块面积大小之间的幂函数关系,计算得到试验小区的土壤异质性指数。结果及其变化规律如图3所示。

注:500 m2方差为0。
由图3可知,灌水定额30 mm方差大于灌水定额45 mm方差,土壤水分的方差与田块面积成反比,田块面积增大方差减小,反之田块面积缩小方差增大,即随着试验田块面积的增加,土壤含水率数据的离散程度降低,所得试验数据更加准确,但不同面积区间试验方差降低的幅度有所不同,面积由1 m2增大到50~100 m2,灌水定额45 mm处理田块间土壤含水率方差降低78.6%~83.7%,灌水定额30 mm处理降低77.4%~82.6%,之后田块面积从100 m2增加到500 m2,灌水定额45 mm方差仅降低16.3%,灌水定额30 mm方差降低17.4%,对误差的影响较小。即小区面积大于100 m2之后面积的增大对提高试验数据的准确性是有限的。对方差与小区面积进行幂函数拟合,方程见图3。由图中方程可以得出,灌水定额30、40 mm试验地块的土壤异质性指数分别为0.380和0.396,表明2个水分处理的土壤水分异质性指数相差不大,基本单元间土壤水分相关性较强。
2.3 重复数及试验小区面积的确定
处理数的不同影响处理间真实差异值,土壤质量含水率处理数增多,处理间真实差异减少。值和重复数共同影响试验小区适宜面积,以灌水定额30 mm处理试验数据为例(=0.380,CV=0.104),由Hatheway经验公式得试验在处理数为2(=2),不同重复数(=2、3、4)下值与适宜小区面积之间关系如图4所示。由图4可知,值越小,试验小区面积越大,当其面积增大到一定程度后,单纯依靠增加试验小区面积来提高识别处理间差异的能力是有限的,还需要配合增加试验重复数来增加对处理间差异的区分能力。当重复数增加时,相同面积下可以提高试验精度,区分出处理间土壤含水率更小的真实差异,试验小区面积在50~100 m2重复数由2增加到3能检测出的处理间土壤含水率差异由23.2%~26.5%提高到13.1%~15.0%,重复数由3增加到4时,提高到10.3%~11.7%,不如重复数由2增大到3显著。当试验处理间真实差异较小时需要更大的试验小区面积或者更多的试验重复数。对于滴灌试验水分处理通常分为2水平或3水平,若试验前预期要达到的希望通过试验能够鉴别出统计意义上的各处理间真实差异的目标值即值为15.0%(2水平时)和12.0%(3水平时),不同处理数、重复数下适宜试验小区面积(灌水定额30 mm:=0.380,CV=0.104;灌水定额45 mm:=0.396,CV= 0.066)计算结果如表2所示。

注:灌水定额30 mm。
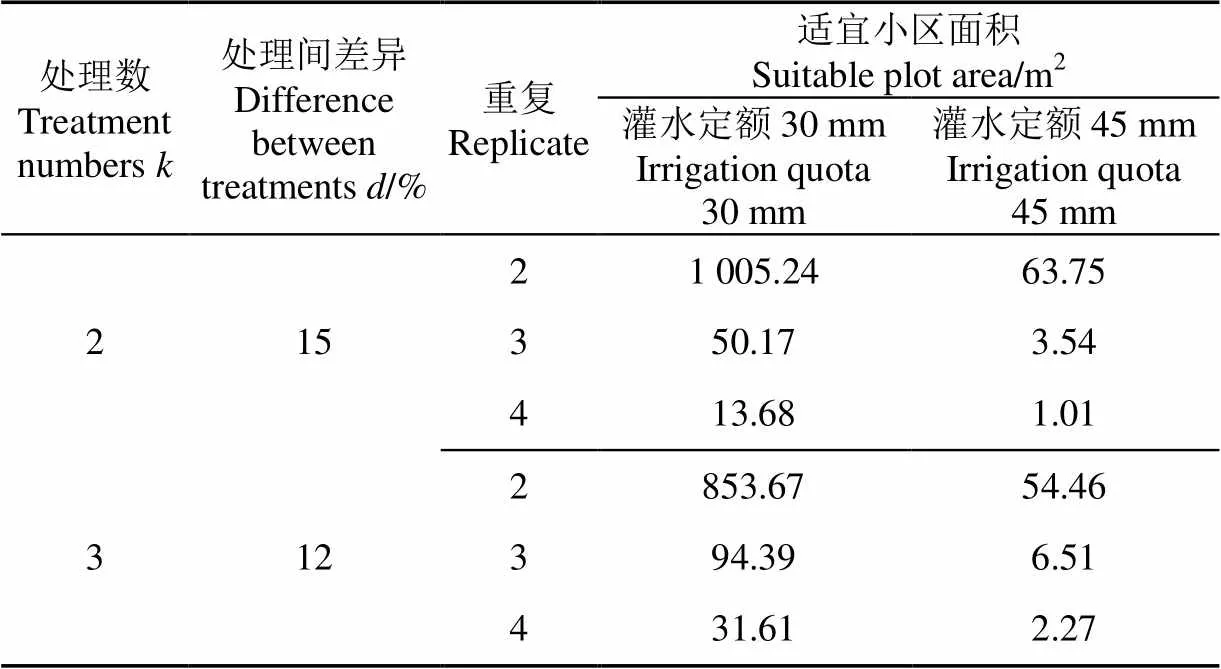
表2 不同处理数和重复数下适宜小区面积
由表2可知,对于灌水定额30 mm处理的试验小区,2次重复要达到理想的试验效果,由于土壤水分自身较大的变异性需要的小区面积较大。又重复为4次时所需小区面积较小,考虑到在土壤水分方差与试验小区面积关系曲线中小区面积大于50 m2后方差降低70%以上,舍弃了面积较小的试验布设方案,且面积太小不利于田间试验设施的布设。综合考虑,对于土壤含水率的监测适宜的试验设计方案为3重复,每个重复试验小区大小为50 m2。对于灌水定额45 mm处理,由于土壤水分变异系数较小,所需的试验小区面积也较小,2重复即可满足试验精度要求,每个重复试验小区大小为70 m2(63.75 m2取整)。当处理数增多,各处理间真实差异减少,应选取较大的试验小区面积或较多的重复数。小区布设时,对于低水处理可以选择3重复,每个重复100 m2(94.34 m2取整),或4重复,每个重复40 m2(31.61 m2取整),但是考虑到在土壤水分方差与试验小区面积关系曲线中小区面积大于50 m2后方差降低70%以上,因此选择3重复,每个重复100 m2。对于高水则可选择2重复,每个重复60 m2(54.64 m2取整)。
2.4 适宜小区形状的确定


图5 不同灌水处理下方差与试验小区面积间关系
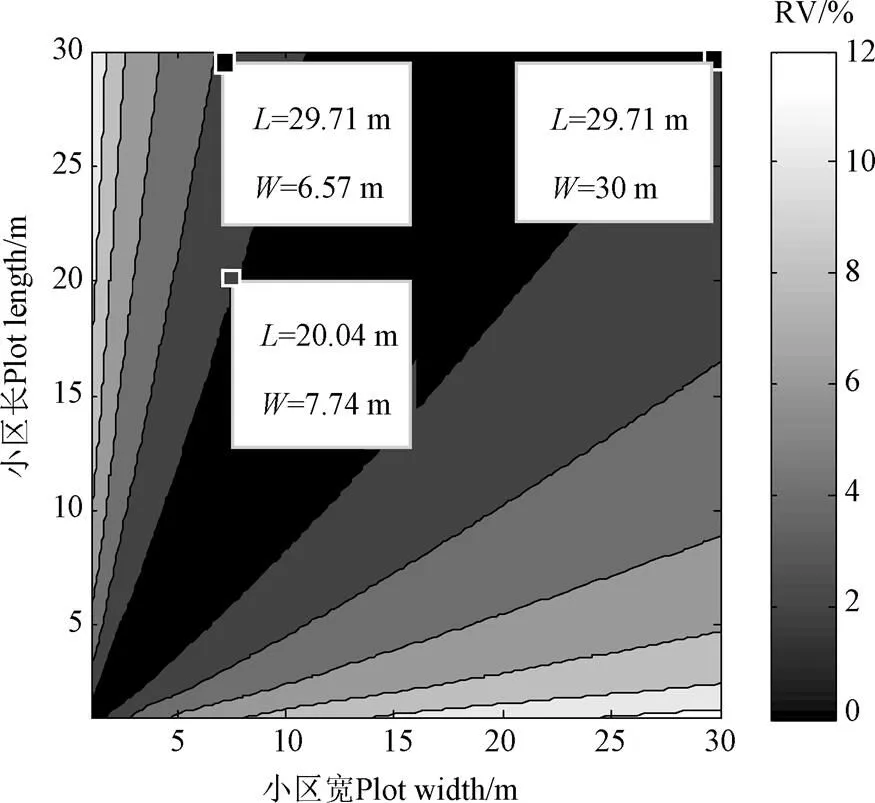
图6 不同小区形状下方差相对偏差RV的绝对值
由图6可知当试验小区、的比值过大或过小时试验数据偏差均较大,因为b>b,所以方向(沿滴灌带铺设方向)上的异质性指数大于方向(垂直于滴灌带方向)上的异质性指数,所以沿土壤异质性指数较的大的方向布设的试验小区较其他形状的试验小区有更准确的结果(偏差更小)。当、比值在1∶1到3∶1之间时,偏差值较小,在0~2%之间,比值在1∶1到5∶1之间时,偏差值在0~4%之间,即在此比例下形状对试验数据的准确性影响较小,因为在此比例下,试验小区能够根据试验小区不同方向上的变异程度均衡地包含地块、方向上的土壤水分特性的变异,使试验小区更具有代表性。
3 讨 论
同产量数据一样,滴灌土壤含水率数据方差与小区面积大小之间同样存在幂函数关系,求得的值可以用来表征土壤含水率间的连续性,且通过土壤水分求得的值小于通过产量求得的值[16,27],这是因为滴灌土壤含水率数据相较于产量在空间分布上更为连续,随着田块面积的增大,田块间土壤含水率方差减小,即随着试验小区面积的增加,土壤含水率数据的离散程度降低,所得试验数据更加准确。对于试验重复数,相同小区面积下增大重复数可提高试验精度,区分出处理间土壤含水率更小的差异。增大试验小区面积和试验重复数均能提高试验数据的准确性,增加试验对处理间差异的区分能力。这与基于产量的研究是一致的[6-8],滴灌试验处理数不同,水分处理不同时所需的重复数和试验小区面积不同,处理数增多,各处理间真实差异减少,需要更大的试验小区或更多的重复数来检测出更小的试验差异。高水处理与低水处理土壤水分异质性指数相差不大,但是低水处理土壤水分变异系数大,所以需要的小区面积较大或重复数较多。
对于小区形状,试验小区土壤水分分布是各向异性的,所以沿变异较大的方向布设的长方形试验小区能包含更多的变异,使试验小区更具代表性,重复间差异更小,此外为了让试验小区内数据更为稳定偏差更小,又要求试验小区在适宜的长宽比下所包含数据变异系数较小[29-30],对于滴灌试验沿滴灌带铺设方向土壤水分变异性大于垂直于滴灌带方向土壤水分变异性,由表征两方向上土壤水分变异性的异质性指数确定的试验小区形状能够均衡的包含两方向上的变异性使得试验小区土壤含水率数据更加准确。。
4 结 论
研究结果表明,不同规格的试验小区对滴灌试验结果的准确性有很大影响,通过研究滴灌试验小区土壤水分变异性、土壤水分异质性指数与滴灌试验小区规格之间的关系得出以下结论:
为了试验小区的统一布设,以低水处理的规格为统一标准,当试验分为高低水2个处理时试验布设宜为3个重复,各重复50 m2,可在80%的概率下检测出15%的真实差异;当试验为高中低3个处理时试验布设宜为3个重复,各重复100 m2,可在80%的概率下检测出12%的真实差异。
滴灌试验小区适宜的形状为沿滴灌带方向布设的长方形,长宽比在1∶1到5∶1之间可使试验小区所得数据更具代表性。
[1] 孔繁玲. 田间试验与统计方法[M]. 北京:中央广播电视大学出版社,1991.
[2] 王建东,龚时宏,高占义,等. 滴灌模式对农田土壤水氮空间分布及冬小麦产量的影响[J]. 农业工程学报,2009,25(11):68-73.
Wang Jiandong, Gong Shihong, Gao Zhanyi, et al. Effects of drip irrigation mode on spatial distribution of soil water and nitrogen and winter wheat yield[J]. Transactions of the Chinese Society of Agricultural Engineering (Transactions of the CSAE), 2009, 25(11): 68-73. (in Chinese with English abstract)
[3] 谢小清,章建新,段丽娜,等. 滴灌量对冬小麦根系时空分布及水分利用效率的影响[J]. 麦类作物学报,2015,35(7):971-979.
Xie Xiaoqing, Zhang Jianxin, Duan Lina, et al. Effect of drip irrigation amount on temporal spatial distribution of root and water use efficiency of winter wheat[J]. Journal of Triticeae Crops, 2015, 35(7): 971-979. (in Chinese with English abstract)
[4] 张娜,张永强,仵妮平,等. 滴灌量对冬小麦籽粒灌浆特性的影响研究[J]. 水土保持研究,2015,22(5):271-275.
Zhang Na, Zhang Yongqiang, Wu Niping, et al. Study on grain filling characteristic of winter wheat under different amounts of drip irrigation[J]. Research of Soil Water Conservation, 2015, 22(5): 271-275. (in Chinese with English abstract)
[5] 中华人民共和国水利部. 灌溉试验规范:SL13-2015[S]. 北京:中国水利水电出版社,2015.
[6] Viana Anselmo Eloy S, Sediyama Tocio, Cecon Paulo Roberto, et al. Estimativas de tamanho de parcela em experimentos com mandioca estimates of plot sizes in experiments with cassava[J]. Horticultura Brasileira, 2002, 20(1): 58-63.
[7] Feijó, Sandra Storck, Lindolfo Lúcio, et al. Heterogeneity index of zucchini yield on a protected environment and experimental planning[J]. Horticultura Brasileira, 2008, 26(1): 1314-1377.
[8] José Lopes Sidinei. Plot size and experimental unit relationship in exploratory experiments[J]. Scientia Agricola, 2005, 62(6): 585-589.
[9] Lúcio Alessandro D, Haesbaert Fernando M, Santos Daniel, et al. Tamanhos de amostra e de parcela para variáveis de crescimento e produtivas de tomateiro Sample size and plot size for growth and productivity characteristics of tomato[J]. Horticultura Brasileira, 2012, 30(4): 660-668.
[10] 唐龙,郝文芳,孙洪罡,等. 黄土高原四种乡土牧草群落种-面积曲线拟合及最小面积的确定[J]. 干旱地区农业研究,2005,23(4):83-88.
Tang Long, Hao Wenfang, Sun Honggang, et al. Fitting and assessment of species-area curves of four native pasture communities on Loess Plateau[J]. Agricultural Research in the Arid Areas, 2005, 23(4): 83-88. (in Chinese with English abstract)
[11] Mello R M, Lucio A D, Storck L, et al. Size and form of plots for the culture of the Italian pumpkin in plastic greenhouse[J]. Scientia Agricola, 2004, 61(4): 457-461.
[12] 李永宁,马凯,黄选瑞. 金莲花产量抽样调查的样地最小面积与形状研究[J]. 草业学报,2011,20(4):61-69.
Li Yongning, Ma Kai, Huang Xuanrui. A study on the plot minimum area and shape for sampling Trollius chinensis yield[J]. Acta Prataculturae Sinica, 2011, 20(4): 61-69. (in Chinese with English abstract)
[13] Hatheway W H. Convenient plot size[J]. Agronomy Journal, 1961(4): 279-280.
[14] Cochran G, Cox Gertrude M. Experimental designs: 2nd ed[J]. Soil Science, 1957, 84(5): 164.
[15] Smith H Fairfield. An empirical law describing heterogeneity in the yields of agricultural crops[J]. Journal of Agricultural Science, 1938, 28(1): 1-23.
[16] Martin Thomas Newton, Storck Lindolfo, Lúcio Alessandro Dal’Col, et al. Bases genéticas de milho e alterações no plano experimental maize genetic variability and modifications on the experimental plan[J]. Pesquisa Agropecuária Brasileira, 2005, 40(1): 35-40.
[17] Lorentz L H, Boligon A A, Storck L, et al. Plot size and experimental precision for sunflower production[J]. Scientia Agricola, 2010, 67(4): 408-413.
[18] Vallejo R L, Mendoza H A Plot technique studies on sweetpotato yield trials[J]. Journal of the American Society for Horticulturalence, 1992, 117(3): 508-511.
[19] Neto Henriques, Diolino Sediyama, TocioSouza, et al. Tamanho de parcelas em experimentos com trigo irrigado sob plantio direto e convencional[J]. Pesquisa Agropecuária Brasileira, 2004, 39(6): 517-524.
[20] 季兰,骆建霞,苗保兰,等. 苹果田间试验最适小区大小的初步研究[J]. 山西农业大学学报:自然科学版,1993,13(3):263-266.
Ji Lan, Luo Jianxia, Miao Baolan, et al. Study on estimating the optimum plot size of applefield experiment[J]. Journal of Shanxi Agricultural University: Natural Science Edition, 1993, 13(3): 263-266. (in Chinese with English abstract)
[21] Boyhan G E, Langston D B, Purvis A C, et al. Optimum plot size and number of replications with short-day onions for yield, seedstem formation, number of doubles, and incidence of foliar diseases[J]. Journal of the American Society for Horticultural Science American Society for Horticultural Science, 2003, 128(3): 409-424.
[22] 雷志栋. 土壤水动力学[M]. 北京:清华大学出版社,1988.
[23] Sangeda A Z, Malende Y H M B, Nzunda E F, et al. Determination of suitable plot shape and plot size for estimation of off-forest tree resources in Machame, Moshi-Tanzania[J]. Acta Facultatis Forestalis, 2002, XLIII(20): 287-294.
[24] Donou Hounsode Marcel T, Kakaï Romain Glélé, Azihou Akomian Fortuné, et al. Efficiency of inventory plot patterns for the estimation of woody vegetation recruit density in a tropical dense forest in Bénin[J]. African Journal of Ecology, 2015, 53(3): 355-361.
[25] Polson David Ernest. Estimation of Optimum Size, Shape,and Replicate number of Safflower Plots for Yield Trials[D]. Utah:Utah State University, 1964.
[26] Meier V D, Lessman K J. Estimation of optimum field plot shape and size for testing yield in crambe abyssinica hochst1[J]. Cropence, 1971, 11(5): 648-650.
[27] Zhang R, Warrick A W, Myers D E. Heterogeneity, plot shape effect and optimum plot size[J]. Geoderma, 1994, 62(1/2/3): 183-197.
[28] 王峰,孙景生,刘祖贵,等. 膜下滴灌棉田测墒点布设位置试验研究[J]. 灌溉排水学报,2016,35(2):29-34.
Wang Feng, Sun Jingsheng, Liu Zugui, et al. Sensor placement of soil water monitoring in cotton filed using drip irrigation under plastic film mulch[J]. Journal of Irrigation and Drainage, 2016, 35(2): 29-34. (in Chinese with English abstract)
[29] Masood M A, Raza Irum, Yaseen Muhammad. Estimation of optimum field plot size and shape in paddy yield trial[J]. Pakistan Journal of Agricultural Research, 2012, 25(4): 280-287.
[30] Oliveira Gabriel Marcos Vieira, Mello José Márcio De, Lima Renato Ribeiro De, et al. Size and shape of experimental plots for Eremanthus erythropappus[J]. Cerne, 2011, 17(3): 327-338.
王鹏翔,宋 妮,陈智芳,王 峰,申孝军,王景雷. 基于土壤水分异质性的小麦滴灌试验小区布设方法[J]. 农业工程学报,2017,33(22):112-118. doi:10.11975/j.issn.1002-6819.2017.22.014 http://www.tcsae.org
Wang Pengxiang, Song Ni, Chen Zhifang, Wang Feng, Shen Xiaojun, Wang Jinglei. Plot layout method of wheat drip irrigation experiment based on soil water heterogeneity[J]. Transactions of the Chinese Society of Agricultural Engineering (Transactions of the CSAE), 2017, 33(22): 112-118. (in Chinese with English abstract) doi:10.11975/j.issn.1002-6819.2017.22.014 http://www.tcsae.org
Plot layout method of wheat drip irrigation experiment based on soil water heterogeneity
Wang Pengxiang1,2, Song Ni1, Chen Zhifang1, Wang Feng1, Shen Xiaojun1, Wang Jinglei1※
(1.453002;2100081)
The objective of this research was to improve the accuracy and representativeness of the experimental plot date by determining the optimum plot area and the replication number for the wheat drip irrigation. The heterogeneity of soil moisture in experimental plots was provided by Smith heterogeneity index. The relationship between the plot area and the repetition number of the wheat drip experimental plot was measured by Hatheway method. The effect of shape on the accuracy of experimental data was determined by studying the soil moisture heterogeneity index in the horizontal direction of drip tape and the vertical direction of drip tape in experimental plot. The results showed,when the plot area was increased, the variance of soil water in the field was reduced and the relationship between them was in power function . For the plot form 1 m2to 50-100 m2, the variance decreased significantly. The full irrigation treatment variance was decreased by 0.79-0.84, and the deficit irrigation treatment variance was reduced by 0.79-0.84. For the plot more than 100m2, the increase of plot area had a limited effect on the variance reduction. To determine the optimum size of the experimental plot you need take the factors as below into consideration, as the number of treatments increased, the real difference between treatments decreased, and the required size for the experimental increased. When the size of the plot increased to a certain value, improving the identification ability of test difference by increasing the area of experimental plot was limited and adding the repetition number to improve the distinguishing ability of the difference between treatments was necessary. For 50-100 m2of experimental plots, when the repetition was increased, the experimental accuracy could be improved with the same area to distinguish the smaller real difference between treatments. By increasing the number of repeats from 2 to 3, the differences of soil moisture between the treatments could be detected which increased from 23.2%-26.5% to 13.1%-15.0%. The recognition ability of the real difference among the treatments could be significantly improved. Hatheway method was used to calculate the optimal experimental plot of the full and deficit irrigation treatment. Due to its larger coefficient variation of soil moisture and heterogeneity index, the deficit irrigation treatment required larger testing area. In order to facilitate the layout of the field experiment, the unified standard of the plot was set up with the optimum specification of deficit irrigation treatment. When the experiment was divided into full and deficit irrigation treatment, the testing plot should be 3 replicates, and the size of each repeat plot should be 50 m2.When the irrigation experiment was divided into three treatments, the experiment layout should be 3 replicates, and the size of each replicate plot was 100 m2. For the experimental plot shape, according to the relationship between the variance of field block and the size of experimental plot, the Power function was fitted by whether the length is greater than the width to calculate the soil moisture heterogeneity index in horizontal the direction of drip tape and the vertical direction of drip tape. About the difference between two directions, the heterogeneity index of deficit irrigation treatment was greater than that of full irrigation treatment. The heterogeneity index in the horizontal direction of drip tape was greater than that in the vertical direction of drop tape. Therefore, the result of rectangular area arranged along the direction of the drip tape was more accurate (smaller deviation) than other shapes. The rectangular experimental plot with aspect ratio between 1:1 and 5:1 could balance the variability of both directions and made the experimental plot more representative. This paper provided a scientific basis for determining the specifications of drip irrigation experimental plot and the theoretical support for the standardization of irrigation experimental layout.
soil moisture; heterogeneity; layout; optimum plot area and shapes; number of replications; drip irrigation; wheat
10.11975/j.issn.1002-6819.2017.22.014
S3-33; S275.6
A
1002-6819(2017)-22-0112-07
2017-07-07
2017-10-10
水利部公益性行业科研专项(201501016);国家重点研发计划(2016YFC0400208);国家自然科学基金项目(51609245);河南省基础与前沿技术研究(16230010168);中央级科研院所基本科研业务费专项(FIRI2017-07)
王鹏翔,河南安阳人,主要从事作物水分生理与高效利用。 Email:798695991@qq.com
王景雷,河南开封人,研究员,主要从事新理论新技术在节水农业中的应用研究。Email:firiwjl@126.com
中国农业工程学会会员:王景雷(E041200185S)
