长江口及其邻近海域表层沉积物粒径及生源要素分布特征
2017-11-21程芳晋俞志明宋秀贤
樊 鑫, 程芳晋, 俞志明, 宋秀贤
长江口及其邻近海域表层沉积物粒径及生源要素分布特征
樊 鑫1, 2, 3, 程芳晋4, 俞志明1, 2, 3, 宋秀贤1, 2, 3
(1. 中国科学院海洋研究所海洋生态与环境科学重点实验室, 山东青岛 266071; 2. 中国科学院大学, 北京 100049; 3. 青岛海洋科学与技术国家实验室海洋生态与环境科学功能实验室, 山东青岛 266071; 4. 青岛市环境监测中心站, 山东青岛 266003)
针对2015年长江口及其邻近海域所采集的43个表层沉积物样品, 通过粒径分析以及生物硅(BSi)、总有机碳(TOC)和总氮(TN)等生源要素参数的测定, 系统探讨了长江口表层沉积物粒径及生源要素的时空分布特征以及各要素的相互关系。结果表明: (1)长江口及其邻近海域表层沉积物组成以黏土质粉砂、粉砂质砂和砂为主。研究区域内, 粒径组成呈现明显的“南细、北粗, 近岸细、离岸粗” 的分布特征, 长江口及浙江近岸泥质区的表层沉积物粒度最细, 中值粒径(Φ)在5以上; (2)调查海域表层沉积物中BSi含量在0.22%~1.82%之间, 沉积物中粉砂、黏土含量及平均粒径(Φ)均与BSi含量呈显著正相关(<0.01), 黏土矿物和粉砂较多的细颗粒沉积物更易累计和保存BSi; (3)TOC和TN的含量分别在0.04%~1.17%和0.01%~0.26%之间, 其分布特征与沉积物中值粒径(Φ)和BSi的分布也有明显的正相关性, 说明细颗粒沉积物更有利于有机质保存, 表层沉积物中的硅藻可能是有机物的来源之一。
长江口; 沉积物; 粒度; BSi; 有机质
长江口是我国第一大河口, 独特的地理位置、季风和环流条件使其成为一个结构复杂、条件多变、功能多样的河口生态系统[1], 是河口和海洋研究的热点区域之一。长江每年输入河口海域的泥沙达到4.7亿t[2], 泥沙携带着大量的陆源有机质, 经过水动力分选、分解、矿化和混合作用后沉降, 其反应的环境信息也在沉积物中得到保存, 因此通过分析和研究沉积物中生物、化学等指标, 能够帮助我们了解沉积环境以及上层水体的变化情况。
国内外对于长江口及其邻近海域表层沉积物研究较多, 研究方向较为广泛, 大多研究侧重于表层沉积物中某一要素进行分析。如刘红等[3]对长江口表层沉积物粒度时空分布特征进行了研究, 得到了长江口表层沉积物中值粒径和类型分布; 于培松等[4]报道了长江口和东海海域沉积物粒径对有机质分布的影响, 发现粒径和有机质分布有很好的相关性; Kao等[5]对东海陆架至南冲绳海槽表层沉积物有机质的含量及其稳定同位素的组成分布特征进行了研究; 李浩帅等[6]对长江口及邻近海域表层沉积物中的生物硅分布特征进行研究, 并探究了影响生物硅保存的因素; 亢振军等[7]研究了长江口南部赤潮区域春季表层沉积物中色素的组成、含量以及分布状况。针对长江口及其邻近海域表层沉积物多种特征要素之间相互关系的研究报道有限, 本文对长江口及其邻近海域表层沉积物的粒度、BSi和有机质的空间分布特征和各要素之间的相互关系进行了系统分析, 为了解主要生源要素在长江口及其邻近海域的生物地球化学过程提供科学依据。
1 材料与方法
1.1 样品采集
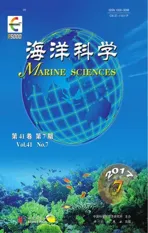
2015年8月和11月, 借助“科学3号”科考船在长江口及其邻近海域, 使用箱式采泥器共采集表层沉积物样品(表层1~3 cm)43个(图1), 其中8月采集样品12个、11月采集样品31个。样品采集后置于封口袋中于–20℃条件下冷冻保存, 带回实验室测定各种参数。

图1 采样站位
1.2 分析方法
1.2.1 粒度组成分析
使用MalvernMastersizerA3000激光粒度仪对表层沉积物样品进行粒度分析。具体分析步骤参照海洋底质调查技术规程: 沉积物样品经冷冻干燥, 取约50 mg于烧杯中, 先后加入过量的1 mol/L的HCl 和30%的H2O2溶液去除碳酸盐和有机质, 用超纯水反复清洗至中性, 经超声波震荡分散后上机测试, 测量范围为0.05~2 000 μm, 重复测量相对误差<2%。参照Shepard沉积物分类方法[8]对沉积物进行类型划分命名。
1.2.2 生物硅的分析
生物硅参考Mortlock等[9]和DeMaster等[10]的方法进行测定。沉积物样品经冷冻干燥后, 称取100~150 mg于100 mL聚乙烯离心管中, 加入10%的H2O2和1mol/L的HCl去除碳酸盐和有机物, 促进沉淀物分解, 使蛋白石表面暴露, 易于溶解。加入超纯水反复清洗、离心3次, 弃上清液, 置于烘箱中60℃干燥, 后加入40 mL的Na2CO3(2 mol/L)溶液在85℃水浴中连续提取8 h, 每次提取0.2 mL上清液测定, 取完样混匀后重新放回水浴中。提取液采用硅钼蓝分光光度法测定吸光值, 经计算后绘制硅含量随时间的变化曲线, 其直线部分的反向延长线与y轴的交点即为沉积物中生物硅的含量。每个样品设置3个平行, 测量结果相对误差<10%。
1.2.3 TOC和TN分析
TOC和TN使用varioMACRO cube 元素分析仪进行测定。沉积物样品经冷冻干燥后, 准确称取30.0~40.0 mg, 加入5~10 mL的HCl(1mol/L)溶液去除无机碳[11], 加入超纯水反复清洗、离心3次, 弃上清液, 置于烘箱中60℃干燥后上机测定。每个样品设置3个平行, 测量结果相对误差<3%。
2 结果
2.1 沉积物粒度分布特征
图2是研究区域表层沉积物类型图。通过图2a可见, 长江口及其邻近海域表层沉积物类型包括粉砂(T)、砂(S)、砂质粉砂(ST)、粉砂质砂(TS)、黏土质粉砂(YT)和混合组分(STY), 其中以黏土质粉砂(YT)、粉砂质砂(TS)和砂(S)为主。研究区域内各粒径组分有明显的区域性特征, 黏土质粉砂(YT)主要分布在杭州湾南端(约30°N)以南海域, 平均粒径平均值为64.46 μm; 而砂(S)和粉砂质砂(TS)则主要分布在北部海域, 平均粒径平均值达到132.93 μm (图2b)。
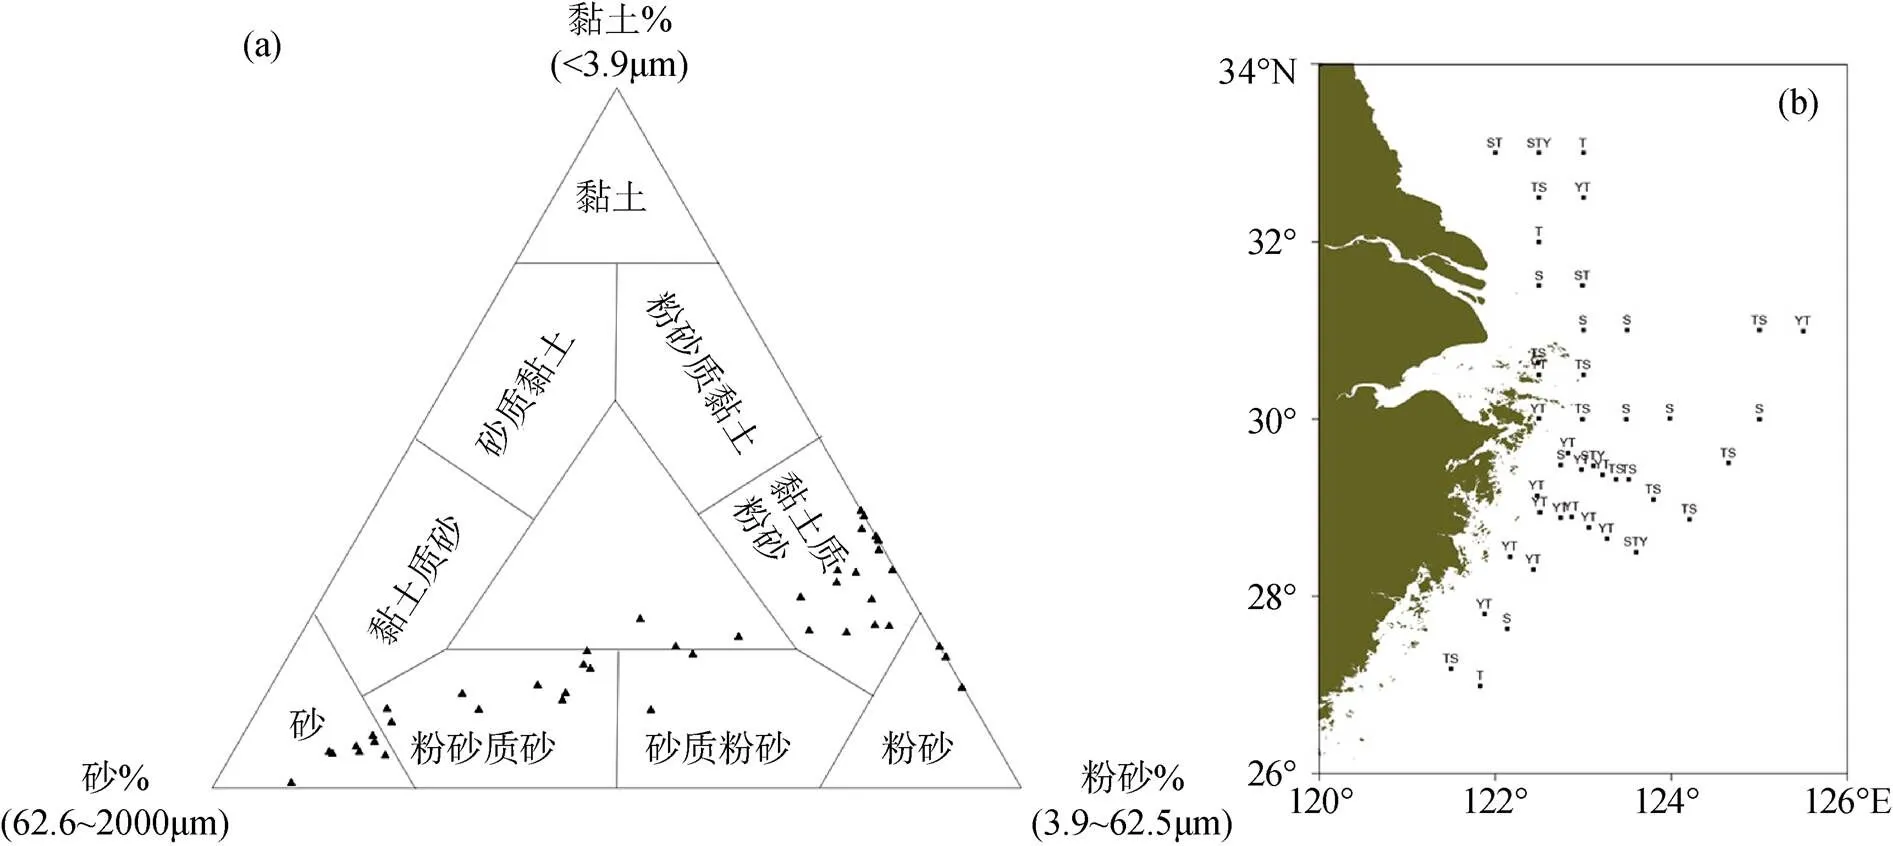
图2 表层沉积物类型
在研究区域中, 表层沉积物组成以砂和粉砂组分为主, 黏土含量整体较低, 在0.71%~39.63%之间(图3c), 这是由于长江口及其邻近海域水流强度较大, 水动力较强[12]所致。研究区域中, 以30°N为界, 表层沉积物中粒径组成差异明显, 主要表现为: 30°N以北区域, 表层沉积物中砂含量表现为近岸到外海先升高后降低的趋势, 而其南部表层沉积物中砂含量呈现从近岸到外海升高的单一趋势。砂含量在长江水下三角洲东北和东南部最高, 可达80%以上(图3a); 同样, 粉砂和黏土含量变化趋势一致, 在30°N以北, 近岸最高, 向外海逐渐降低, 后再升高; 在30°N以南, 从近岸到外海逐渐降低。其百分含量最高值均出现在浙江近岸海域, 粉砂含量(9.41%~ 85.53%)明显高于黏土含量(3b和3c)。

图3 表层沉积物各组分含量(a)砂、(b)粉砂、(c)黏土和(d)中值粒径(Φ)分布
表层沉积物中值粒径在0.83Φ~7.64Φ之间, 平均值为5.14Φ。长江口和浙江近岸海域的泥质区域表层沉积物中值粒径的Φ值较高, 在5以上, 浙江近岸海域则达到7以上; 中值粒径最小的区域出现在长江口水下三角洲东北部以及东海陆架中部和外部的砂质海域, Φ值在3左右(图3d)。
总体而言, 长江口及其邻近海域表层沉积物组分呈现“南细、北粗, 近岸细、离岸粗”的分布特征, 这与前人的研究结论相符, 即东海陆架表层沉积物砂质组分为背景, 长江口和闽浙沿岸是东海陆架表层沉积物的两个泥质亚区[13-16], 表层沉积物以细颗粒物质为主。
2.2 表层沉积物中BSi分布
本研究43个表层沉积物样品的BSi含量在0.22%~1.82%之间, 平均值为1.19%(表1), 本文结论与之前长江口及其邻近海域的BSi研究结果(0.19%~1.64%)[6, 17-18]基本一致, 有所偏高。BSi的最高值出现在浙江近岸海域的33号站位, 而最低值出现在最北部的3号站位。从图4可见, 表层沉积物BSi的分布趋势和中值粒径的分布类似, 即在近岸的泥质区含量较高, 在30°N以北区域向外海先降低后升高, 在30°N以南区域呈现向外海单一降低的趋势。
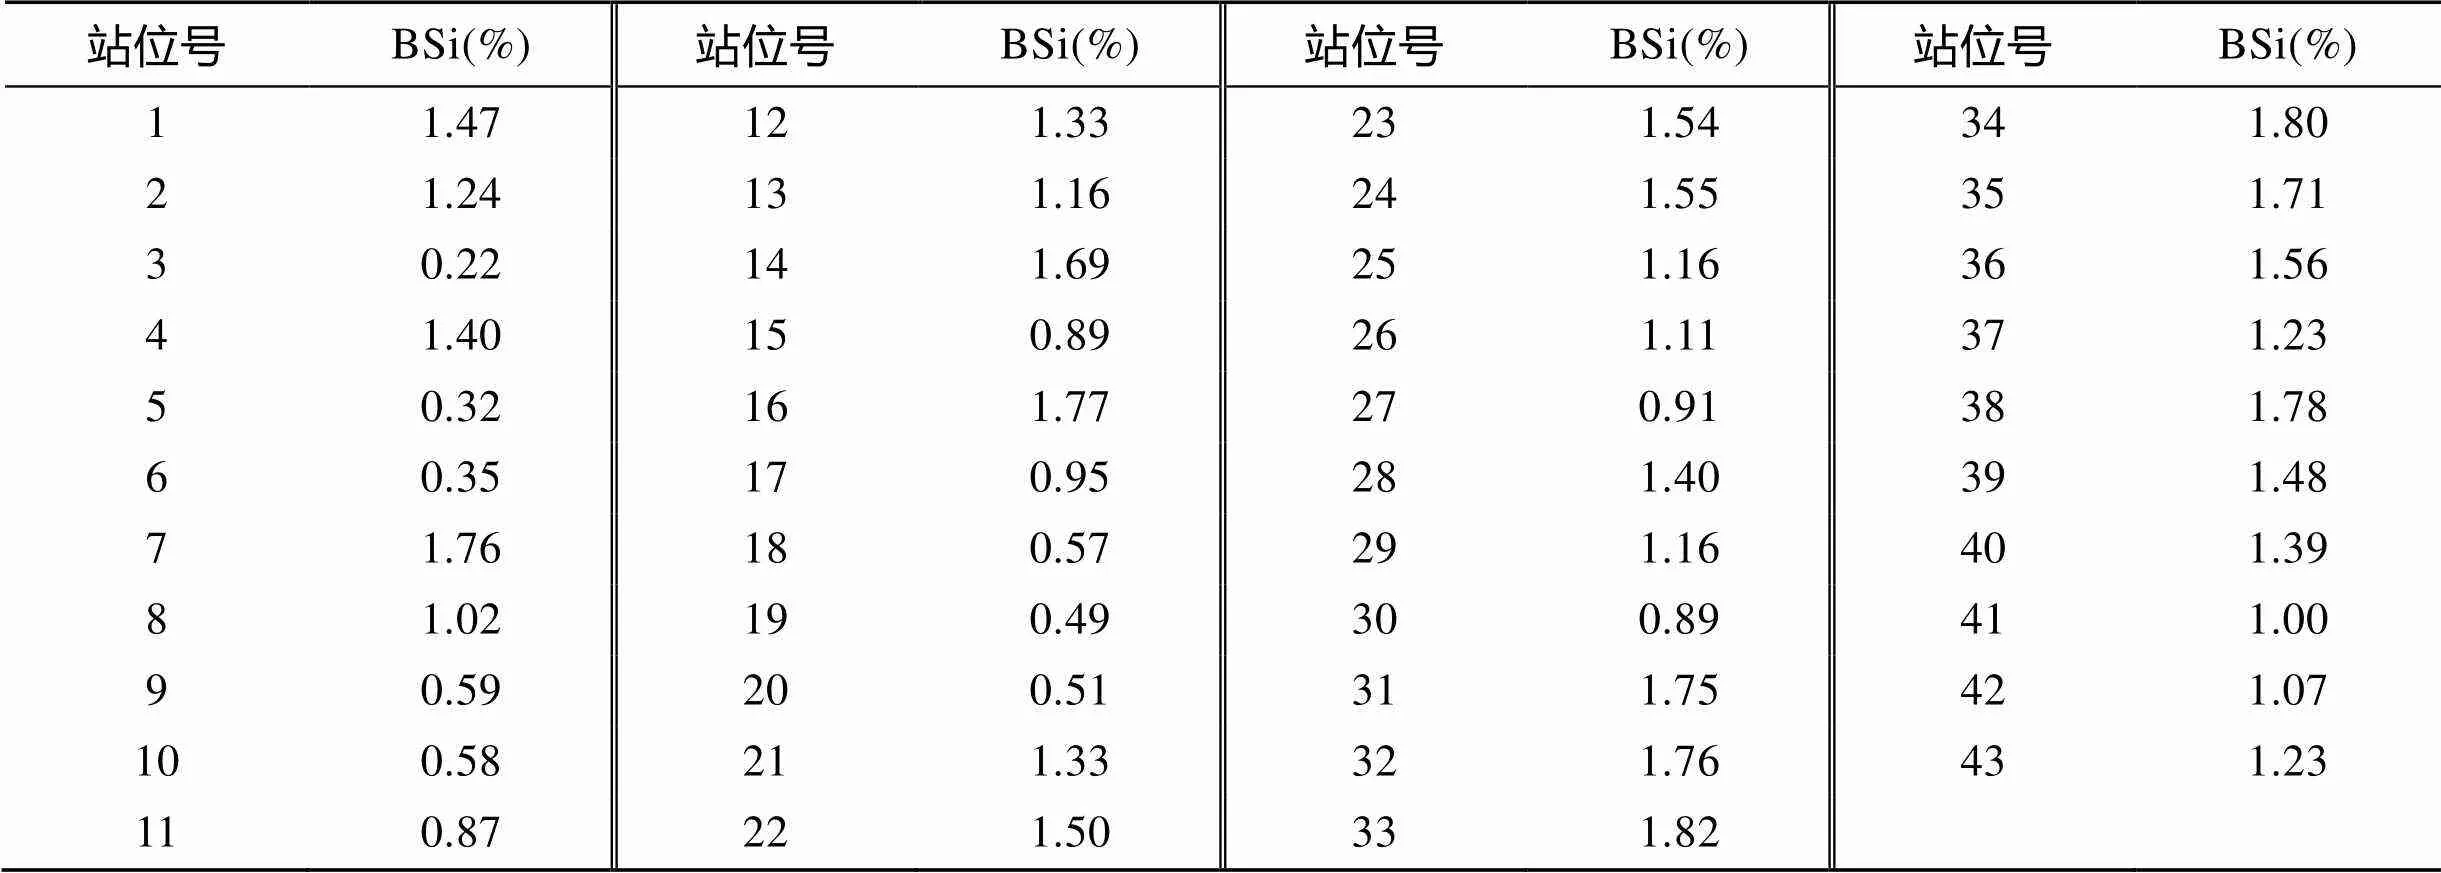
表1 表层沉积物BSi含量
图4 表层沉积物BSi含量分布
2.3 表层沉积物TOC和TN分布
研究区域内表层沉积物TOC和TN含量分别在0.04%~1.17%和0.01%~0.26%之间, 平均值分别为0.58%和0.09%。从图5a、5b可见, 长江口及其邻近海域表层沉积物中TOC和TN分布趋势与沉积物中值粒径的分布类似(图3d), 均从近岸到外海陆架呈现明显的梯度分布, 长江口及浙江沿岸海域表层沉积物中值粒径较大(>5Φ), TOC和TN含量较高(TOC>0.45%, TN>0.08%)。在30°N以北区域, 随着中外陆架区域沉积物中值粒径Φ值先减小后增大, TOC和TN含量也先降低(TOC<0.25%, TN<0.02%)后升高; 而在在30°N南部研究区域, TOC和TN含量从近岸向外海逐渐降低即沉积物颗粒越细, 对有机质的累积富集能力越强[19]。TOC和TN含量与中值粒径(Φ)具有显著的相关性(<0.01), 相关系数分别为0.74和0.70。众多研究表明, 长江口沉积物粒径组成和有机质分布有着密切的相关性[4, 20-21], 本文研究也证实了该观点。
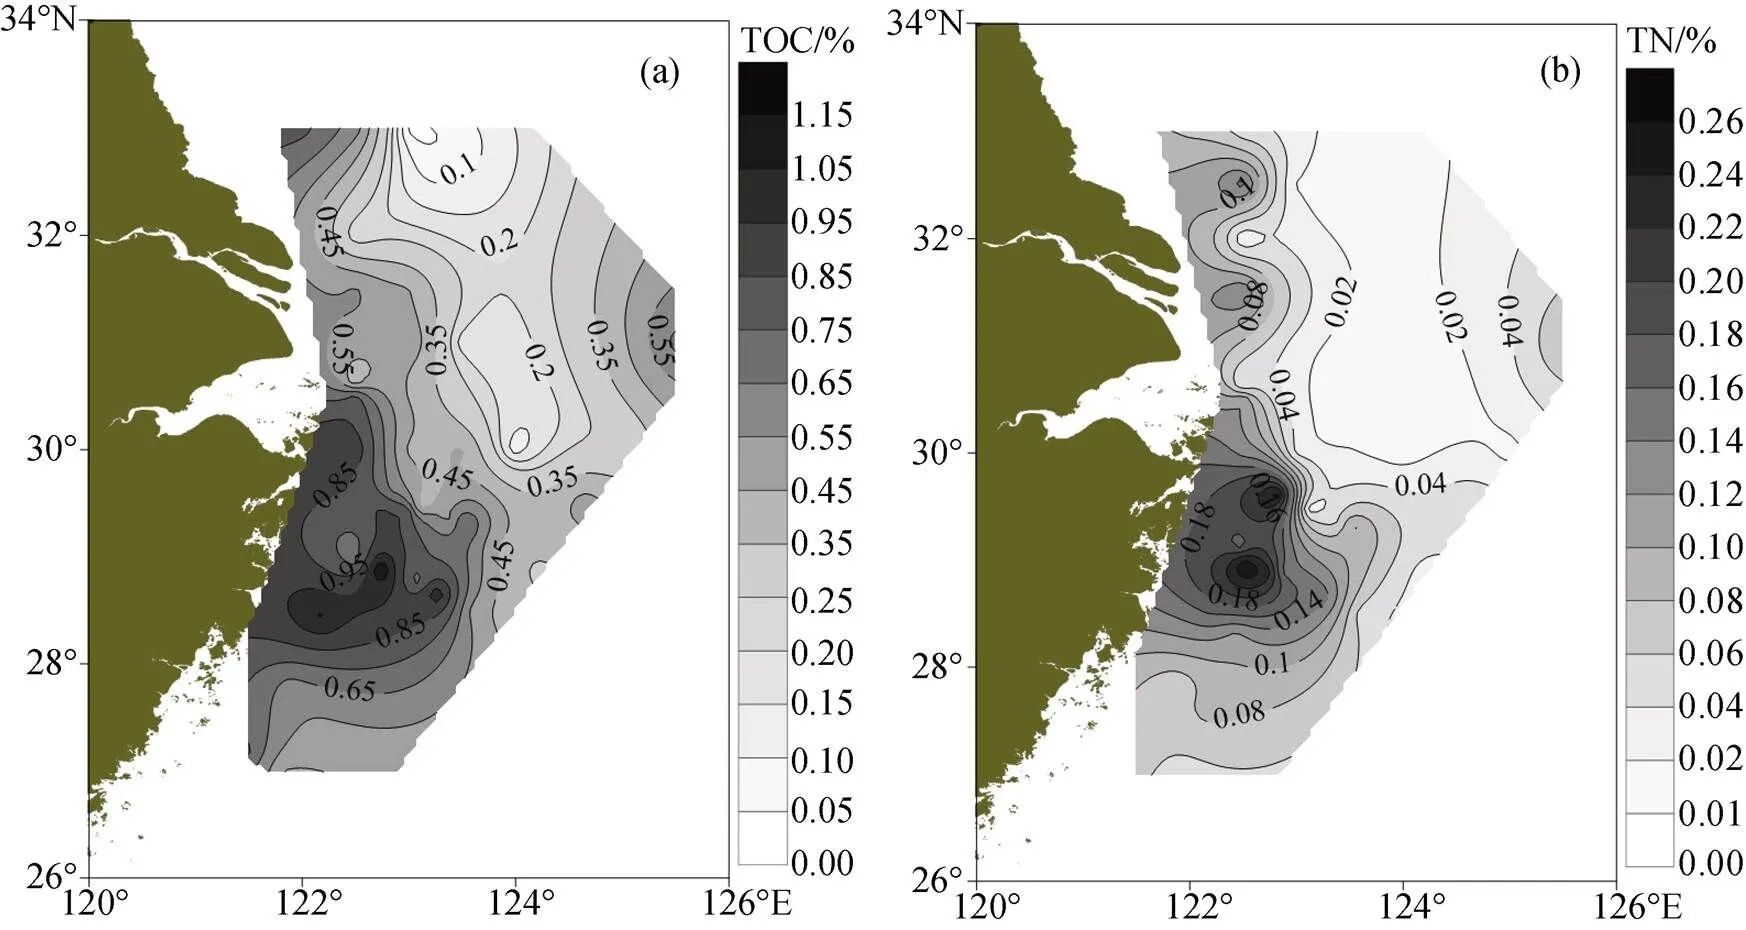
图5 表层沉积物(a)TOC和(b)TN分布
研究区域中表层沉积物的TOC和TN含量具有显著的相关性(=0.72,<0.01)。大多表层沉积物C/N质量比高于海洋浮游植物的Redfield比值(5.7) (图6), 除个别站点外, C/N质量比均在7以上, 平均值为10.18, 说明研究区域受到陆源有机质输入的影响较大[22-23]。
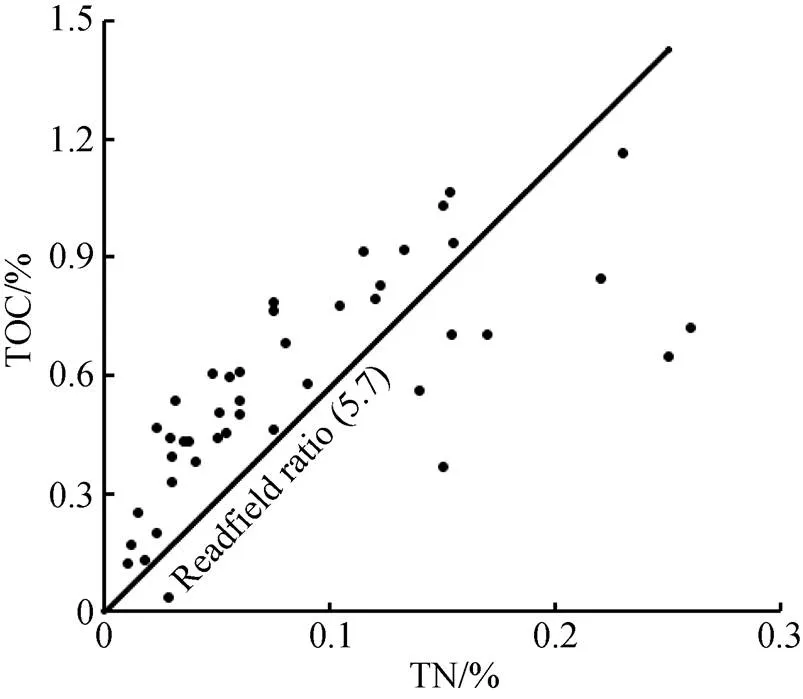
图6 表层沉积物中TOC和TN关系(实线为Redfield质量比)
3 讨论
3.1 表层沉积物粒径对BSi分布的影响
通过分析表层沉积物BSi含量和砂(a)、粉砂(b)、黏土(c)和平均粒径(Φ)(d)的相互关系可知, 长江口及其邻近海域表层沉积物中BSi累积量和粒径各组分之间都存在显著的相关性(<0.01), 其中BSi与砂含量呈负相关, 相关系数= –0.83; 与粉砂、黏土和平均粒径(Φ)呈正相关, 相关系数分别为0.77、0.75和0.86(图7)。说明沉积物的粒径组成是影响BSi保存的重要因素, 相比于砂质, BSi更易保存于粉砂和黏土质沉积物中。前人研究结果表明, BSi在粗颗粒沉积物中的溶解速率要高于在细颗粒中的溶解速率[24], 长江口及其邻近海域表层沉积物中的细颗粒物质(2~20 μm)有一部分是沉降的硅藻碎屑[25-26], 这可能也是BSi在细颗粒沉积物中含量较高的原因之一。
3.2 沉积物TOC、TN与BSi的相互关系
Romero O等[27]的研究表明, 沉积物有机质的含量分布与BSi的保存和累积密切相关; 而DeMaster D J等[28]的研究也显示, 有机质可以降低沉积物中BSi的溶解速率, 起到保存BSi的作用。本文的研究结果显示, BSi%与TOC%、TN%均存在显著的正相关性(<0.01), BSi%与TOC%、TN%回归方程相关系数分别达到0.84和0.80(图8)。可以推断硅藻可能是长江口及其邻近海域表层沉积物有机质的主要贡献者之一。
侯立军等[29]通过对长江口潮滩沉积物BSi的研究表明, 在潮滩沉积物中, BSi的溶解难度远高于有机质的分解。在本研究中, TOC和BSi的摩尔比值在0.36~2.13之间, 平均值为1.12, 远低于Redfield比值(TOC/BSi=6.63)[30], 进一步证明在长江口及其邻近海域表层沉积物中, BSi的溶解速率要远远低于有机质的分解速率。
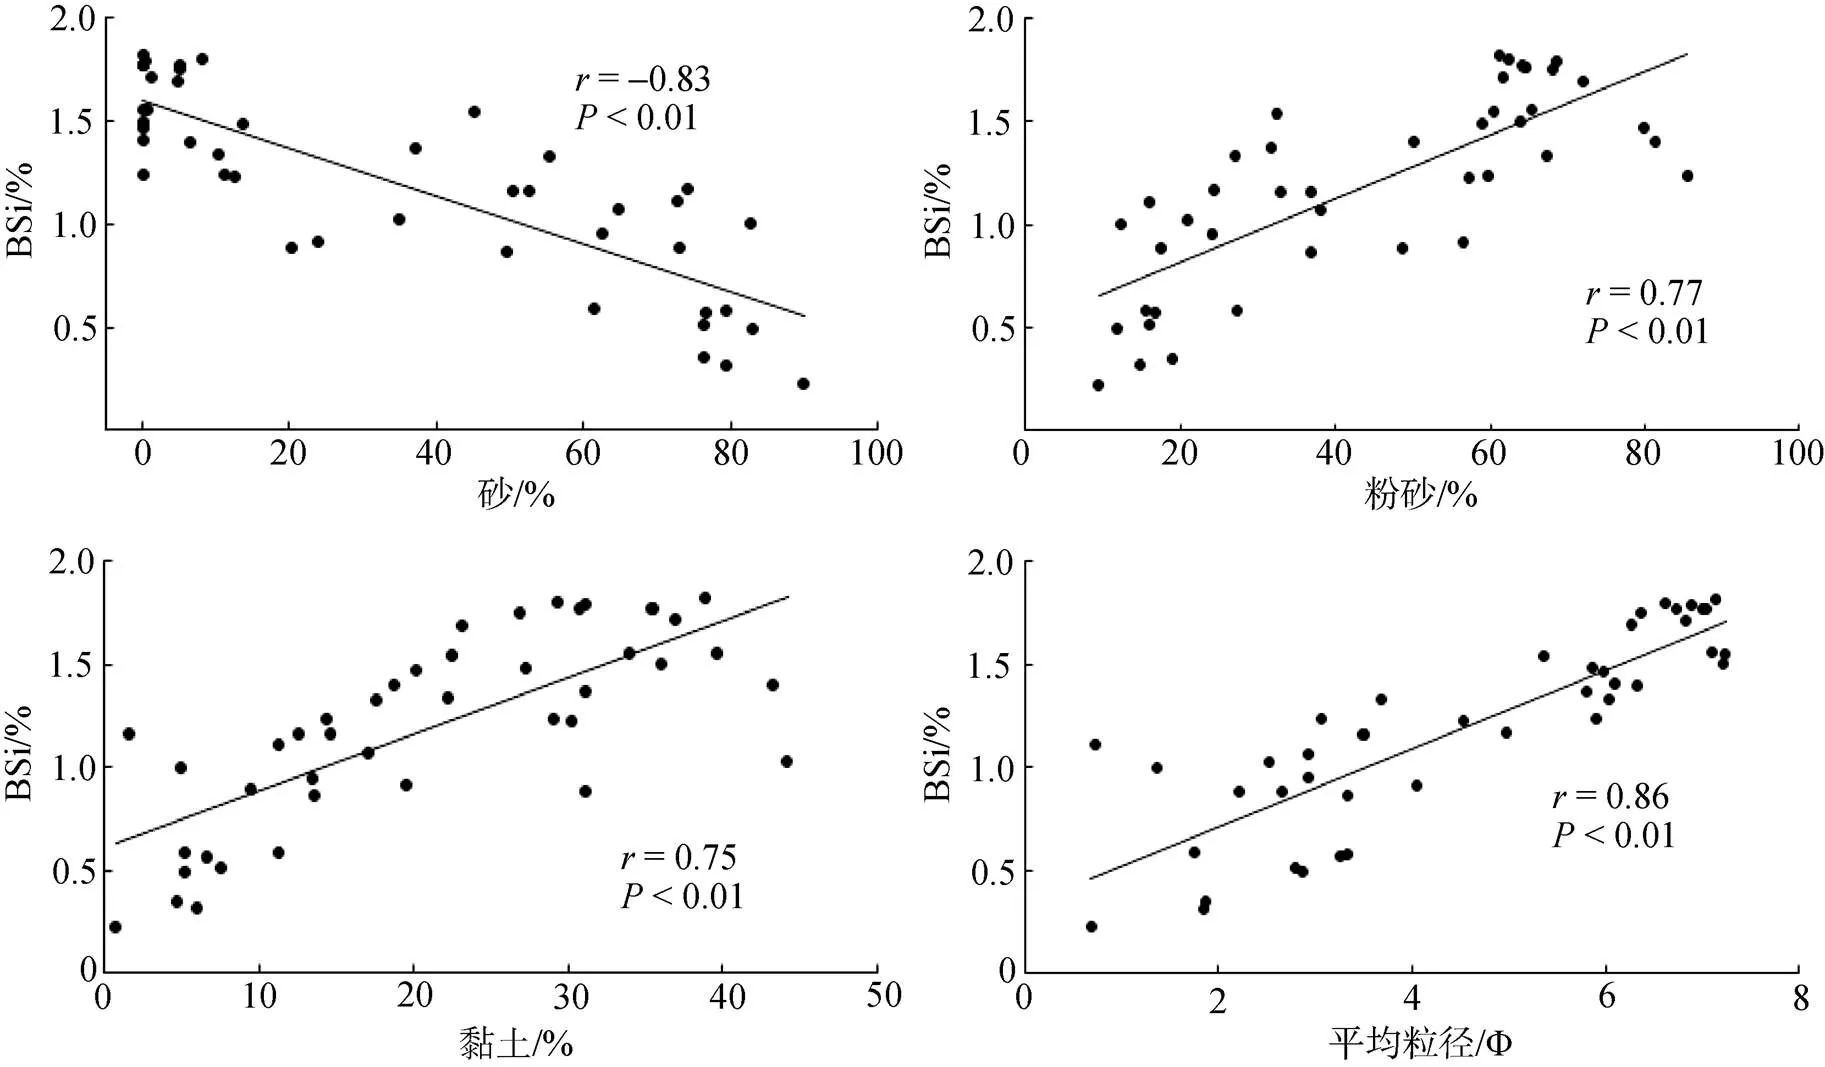
图7 表层沉积物中BSi和各组分、平均粒径(Φ)的关系
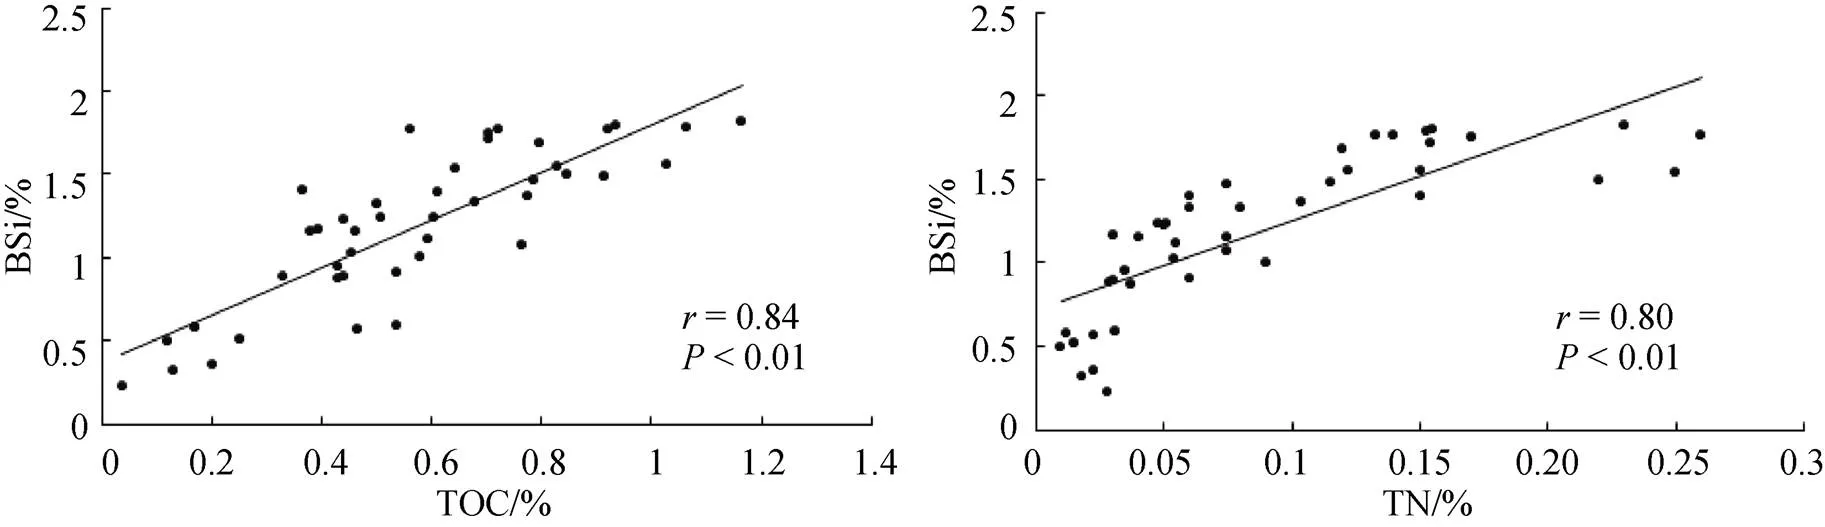
图8 表层沉积物BSi和TOC.TN的关系
4 结论
(1) 长江口及其邻近海域表层沉积物类型以黏土质粉砂、粉砂质砂和砂为主。以杭州湾南端(约30°N)为分界, 北部区域以砂组分为主, 平均粒径的平均值达到132.93μm; 而南部海域多为粉砂质组分, 平均粒径的平均值为64.46μm; 近岸到外海粒径组成由细变粗, 长江口及浙江近岸泥质区中值粒径(Φ)在5以上, 向中外陆架逐渐减小, 粒径组成总体上呈现明显的“南细、北粗, 近岸细、离岸粗”的分布特征。
(2) 表层沉积物中BSi含量在0.22%~1.82%之间, 平均为1.19%。BSi与砂、粉砂和黏土组分间都存在显著的相关性(<0.01), 相关系数分别为–0.83、0.77和0.75, BSi更易保存于粉砂和黏土中。
(3) 表层沉积物中TOC和TN含量分别在0.04%~1.17%和0.01%~0.26%之间, 沉积物颗粒越细, 对有机质的富集能力越强; TOC、TN分布和BSi分布均有显著的相关性(<0.01), 相关系数分别为0.84和0.80, 说明硅藻可能是长江口及其邻近海域表层沉积物有机质的主要贡献者之一。
[1] 卢继武. 长江口鱼类群聚结构、丰盛度及其季节变化的研究[J]. 海洋科学集刊, 1992, 39: 303-340. Lu Jiwu. Study on Cluster Structure, Fullness and Seasonal Change of fish Group in the Yangtze River Estuary[J]. Studia Marine Sinica, 1992, 39: 303-340.
[2] Milliman J D, Meade R H. World-wide delivery of river sediment to the oceans[J].Journal of Geology, 1983, 91(1): 1-21.
[3] 刘红, 何青, 孟翊, 等. 长江口表层沉积物分布特征及动力响应[J]. 地理学报, 2007, 62(1): 81-92. Liu Hong, He Qing, Meng Yu, et al. Characteristics of surface sediment distribution and its hydrodynamic responses in the Yangtze River Estuary[J]. Acta Geographica Sinica, 2007, 62(1): 81-92.
[4] 于培松, 薛斌, 潘建明, 等. 长江口和东海海域沉积物粒径对有机质分布的影响[J]. 海洋学研究, 2011, 29(3): 202-208. Yu Peisong, Xue Bin, Pan Jianming, et al. Impact of sediment grain size on the distribution of organic matter in Changjiang River Estuary and East China Sea[J]. Journal of Marine Sciences, 2011, 29(3): 202-208.
[5] Kao S J, Lin S, Wong C H, et al. Sedimentary organic carbon and nitrogen contents and theirisotopic compositions along two transect on the East ChinaSea shelf[J]. Geochemical Journal, 2001, 35, 237-244.
[6] 李浩帅, 刘淑民, 陈洪涛, 等. 长江口及邻近海域表层沉积物中的生物硅[J]. 中国海洋大学学报, 2015, 45(12): 72-79. Li Haoshuai, Liu Shumin, Chen H T, et al. Biogenic silica in surface sediments of Yangtze River Estuary and adjacent waters[J]. Periodical of Ocean University of China, 2015, 45(12): 72-79.
[7] 亢振军, 于仁成, 孔凡洲, 等. 长江口南部赤潮区春季表层沉积物中色素组成、含量与分布状况[J]. 海洋科学, 2014, 38(10): 30-39. Kang Zhenjun, Yu Rencheng, Kong Fanzhou, et al. pigment composition, content and distribution in surface sediment of the red-tide zone south to the Changjiang River Estuary in spring[J]. Marine Sciences, 2014, 38(10): 30-39.
[8] Shepard F P. Nomenclaturebased oil sand-silt-clay ratios[J]. Journal of Sedimentary Petrology, 1954, 24: 151-158.
[9] Mortlock R A, Froelich P N. A simple method for the rapid determination of biogenic opal in the pelagic marine sediments[J]. Deep-Sea Research, 1989, 36(9): 1415-1426.
[10] Demaster D J. The supply and accumulation of silica in the marine environment[J]. Geochemica et Cosmochimica Acta, 1981, 45: 1715-1732.
[11] 孙萱, 宋金明, 于颖, 等. 元素分析仪快速测定海洋沉积物TOC和TN的条件优化[J]. 海洋科学, 2014, 38(7): 14-19.Sun Xuan, Song Jinming, Yu Ying, et al. A rapid method for determing the total organic carbon and total nitrogen in marine sediments with an Elemental Analyzer[J]. Marine Sciences, 2014, 38(7): 14-19.
[12] Pejrup M. Thetriangular diagram used for classification of estuarine sediments: a new approach. In: Tide-influencedSedimentary Environments and Facies. Dordrecht. D. Reidel Publishing Company, 1987. 298-300.
[13] 胡敦欣, 杨作升.东海海洋通量关键过程[M].北京: 海洋出版社, 2001, 25-30. Hu Dunxin, Yang Zuosheng. Key process of ocean flux in East China Sea[M].Beijing: Ocean press, 2001, 25- 30.
[14] 王可, 郑洪波, Maarten P, 等. 东海内陆架泥质沉积反映的古环境演化[J]. 海洋地质与第四纪地质, 2008, 28(4): 1-10. Wang Ke, Zheng Hongbo, Maarten P, et al. High-resolution paleoenvironmental record of the mud sediments of the East China Sea inner shelf[J]. Marine Geology & Quaternary geology, 2008, 28(4): 1-10.
[15] 王中波, 杨守业, 张志珣, 等. 东海陆架中北部沉积物粒度特征及其沉积环境[J]. 海洋与湖沼, 2012, 43(6): 1039-1049.Wang Zhongbo, Yang Shouye, Zhang Zhixun, et al. The grain size compositions of the surface sediments in the East China Sea: indication for sedimentary environments[J]. Oceanologia Et Limnologia Sinica, 2012, 43(6): 1039-1049.
[16] 秦蕴珊.中国陆架海的地形及沉积类型的初步研究[J]. 海洋与湖沼, 1963, 5(1): 71-86. Qin Yunshan. A preliminary study on the terrain and sedimentary types of China shelf sea[J]. Oceanologia Et Limnologia Sinica, 1963, 5(1): 71-86.
[17] 叶曦雯, 刘素美, 赵颖翡, 等.东、黄海沉积物中生物硅的分布及其环境意义[J]. 中国环境科学, 2004, 24(3): 265-269. Ye Xiwen, Liu Sumei, Zhao Yingfei, et al. The distribution of biogenic silica in the sediments of the East China Sea and the Yellow Sea and its environmental signification[J]. China Environmental Science, 2004, 24(3): 265-269.
[18] Hou L J, Liu M, Xu S Y, et al. Distribution and accumulation of biogenic silica in the intertidal sedimentsof the Yangtze Estuary[J]. Journal of Environmental Sciences, 2008, 20: 543-550.
[19] Mayer L M. Surface area control of organic carbonaccumulation in the continental shelf sediments[J]. Geochemicaet Cosmochimica Acta, 1994, 58(4): 1271-1284.
[20] 高建华, 汪亚平, 潘少明, 等. 长江口外海域沉积物中有机物的来源及分布[J]. 地理学报, 2007, 62(9): 981-991. Gao Jianhua, Wang Yaping, Pan Shaoming, et al. Source and distribution of organic matter in seabed sediments of the Changjiang River Estuary and its adjacent sea area[J]. Acta Geograohica Sinica, 2007, 62(9): 981-991.
[21] 王华新, 线薇微. 长江口表层沉积物有机碳分布及其影响因素[J]. 海洋科学, 2011, 35(5): 24-31. Wang Huaxin, Xian Weiwei. Distribution of the total organic carbon of surface sediment and its influence factors in the Yangtze River Estuary[J]. Marine Sciences, 2011, 35(5): 24-31.
[22] Aitkenhead J A, McDowell W H. Soil C/N ratiosas a predictor of annual riverine DOC flux at localand global scales[J]. Global Biogeochemical Cycles, 2000, 14(1): 127-138.
[23] Perdue E M, Koprivnjak J F. Using the C/N ratio to estimate terrigenous inputs of organic matter to aquatic environments[J]. Estuarine Coastal and Shelf Science, 2007, 73: 65-72.
[24] Bernárdez P, Francés G, Prego R. Benthic-pelagic coupling and post depositional processes as revealed by the distribution of opalin sediments: The case of the Ríade Vigo (NW Iberian Peninsula)[J]. Estuarine, Coastal and Shelf Science, 2006, 68: 271-281.
[25] Song S Q, Sun J, Luan Q S, et al. Size-fractionated phytoplankton biomass in autumn of the changjiang (Yangtze) River Estuary and its adjacent waters after the Three Gorges Dam construction[J]. Chinese Journal of Oceanology and Limnology, 2008, 26(3): 268-275.
[26] 周伟华, 霍文毅, 袁翔城, 等.东海赤潮高发区春季叶绿素a和初级生产力的分布特征[J]. 应用生态学报, 2003, 14(7): 1055-1057. Zhou Weihua, Huo Wenyi, Yuan Xiangcheng, et al. Distribution features of chlorophyll a and primary productivity in high frequency area of red tide in East China Sea during spring[J]. Chinese Journal of Applied Ecology, 2003, 14(7): 1055-1057.
[27] Romero O, Hebbeln D. Biogenic silica and diatom thanatocoenosis in surface sediments below the Peru- Chile Current: controlling mechanisms and relationship with productivity ofsurfacewaters[J]. Marine Micropaleontology, 2003, 48: 71-90.
[28] DeMaster D J. The accumulation and cycling of biogenic silica in the Southern Ocean: revisiting the marine silica budget[J]. Deep-Sea Research Ⅱ, 2002, 49: 3155-3167.
[29] 侯立军, 刘敏, 闫惠敏, 等. 长江口潮滩沉积物生物硅的分布及其影响因素[J]. 中国环境科学, 2007, 27(5): 665-669. Hou Lijun, Liu Min, Yan Huimin, et al. Distribution of biogenic silica in tidal flat sediments of Yangtze Estuary and its influence factors[J]. China environmental science, 2007, 27(5): 665-669.
[30] Tréguer P, Nelson D M, van Bennekom A J, et al. The silicabalance in the world ocean: a reestimate[J]. Science, 1995, 268: 375-379.
Research on surface sediment grain size and biogenic elements distribution in Yangtze Estuary and adjacent waters
FAN Xin1, 2, 3, CHENG Fang-jing4, YU Zhi-ming1, 2, 3, SONG Xiu-xian1, 2, 3
(1. Key Laboratory of Marine Ecology and Environmental Sciences, Institute of Oceanology, Chinese Academy of Sciences, Qingdao 266071, China; 2. University of Chinese Academy of Sciences, Beijing 100049, China; 3. Laboratory of Marine Ecology and Environmental Science, Qingdao National Laboratory for Marine Science and Technology, Qingdao 266071, China; 4. Environmental Monitoring Center of Qingdao, Qingdao 266003, China)
In 2015, we collected surface sediment samples from 43 stations in the Yangtze Estuary and its adjacent waters. We then analyzed the grain size and biogenic elements of the surface sediments, including biological silicon (BSi), total organic carbon (TOC), and total nitrogen (TN). In this paper, we discuss the spatial distributions and mutual relationships of the above features. The results show that the surface sediment in the Yangtze Estuary and adjacent waters is mainly composed of clayey silt, silty sand, and sand. In the investigated area, the grain size of the surface sediment appeared to have obvious distributions: fine in south and near shore area and coarse in the north and offshore area. We found the finest surface sediment in the Yangtze Estuary and Zhejiang coastal mud area, which had a median diameter (Φ) greater than 5. In addition, the BSi content of the surface sediments in the investigated waters ranged from 0.22%–1.82%, and was positively correlated with the surface sediment clay, silt content, and average particle size (<0.01). Clay minerals and fine silt sediment readily accumulate and retain BSi. The contents of TOC and TN ranged from 0.04%–1.17% and 0.01%–0.26%, respectively, and their distributions showed a significant positive correlation with the median diameter (Φ) and BSi content, which suggests fine-grained sediments are more favorable for the preservation of organic matter, and that in these surface sediment samples diatoms are likely to be a source of organic matter.
Yangtze Estuary; sediment; grain size; biological silicon; organic matter.
(本文编辑: 康亦兼)
P736; P76
A
1000-3096(2017)07-0105-08
10.11759/hykx20170109001
2017-01-09;
2017-04-27
长江口及其邻近海域沉积硅藻记录与定量富营养化历史重建(41506142); 联合基金项目“海洋生态与环境科学”资助项目(U1406403); 国家自然科学基金资助项目(41276115)
[Sedimentary record of diatoms and quantitative reconstruction of eutrophication history in the Changjiang Estuary and the adjacent sea areas, No.41506142; Joint project of NSFC and Shandong province (Grant No. U1406403); National Natural Science Foundation of China, No.41276115]
樊鑫(1989-), 男, 江苏泰州人, 博士研究生, 主要研究方向为海洋生态学, E-mail: fxpositivity@163.com; 宋秀贤, 通信作者, 研究员, 博士生导师, E-mail: songxx@qdio.cn
Jan. 9, 2017