Modeling the pressure drop of wet gas in horizontal pipe☆
2017-05-29PeiningYuYiLiJingWeiYingXuTaoZhang
Peining Yu ,Yi Li,*,Jing Wei,Ying Xu ,Tao Zhang
1 Graduate School at Shenzhen,Tsinghua University,Shenzhen 518055,China
2 CFHI Tianjin C-E Electrical Automation Co.Ltd,Tianjin 300457,China
3 School of Electrical Engineering and Automation,Tianjin University,Tianjin 300072,China
1.Introduction
As a specific subsetofgas-liquid two-phase flow,wetgas widely exists in various manufacturing processes in industry.According to the de finition of the technical report released by International Organization for Standards(ISO/TR11583)[1],wet gas refers to the two-phase flows ofgas and liquid in which the flowing fluid mixture consists ofgas in the region of more than 95%volume fraction.This de finition is adopted in this study and all the experiment conditions were within this scope.
The simplestapproach to flows involving a gasand a liquid isto treat the mixture the same as a single phase.By assuming there is no slip between the phases and the two kinds of medium form a uniform flow,this typical method,namely homogeneous model,attracted numerous researchers at the early stage of the research history of multiphase flow.Obviously there are a number of problems in using the homogeneous model.The assumption of a homogeneous distribution of the phases is sometimes a poorapproximation.Furthermore an appreciable slip can existbetween the phases,so the equating of the void fraction to the quality can be incorrect and lead to errors in calculating the contribution of the pressure drop associated with hydrostatic head.These deficiencies lead the research workers to search for new model which can describe the movement of the gas-liquid flow in details.Different from the homogeneous model,a package of proposals recognizing that the velocities of the two phases are usually different was proposed by Lockhart and Martinelli in a landmark paper[2].It is a special onedimensional version of the two- fluid model,which pictures the phases to be two separate streams.The application of this correlation has been thoroughly discussed by Hewitt[3]and by Wallis[4].A simple fit to their correlations by Chisholm was developed in 1967[5].This type of model actually ignores the shear stress between the two phases and replaces it with the stress between the single phase and the pipe wall,so there also are some procedures of it that can lead to errors.
In 1989,taking the conversion between the potentialand kinetic energies of the liquid phase into account,Hartet al.[6]modeled the wetted perimeter in the local cross section of horizontal pipes successfully.In 1997,Grolman and Fortuin[7]improved Hart's modeland developed a set of methods for calculating the pressure drop of wet gas in the horizontaland inclined pipes which were entitled MARS model.The factors that affect the static pressure drop of the two phases in the straight pipes were considered in MARS model,and the predicted results were verified by the data collected from different experimental conditions satisfactorily.The research from Amsterdam University provides a more detailed approach to describe the real gas-liquid flow in stratified and annular flow patterns than otherprevious models.However,unfortunately,the effects of entrainment have not been considered in these two models perhaps since the phenomenon cannot be quantitatively measured in these researches.Even though a number of empirical or semi-empirical models for measuring the gas flow rate of the twophase flow by using the throttle flow meters have been developed[8-11]and some of them are applied in the pilot plan test[12],some critical problems including the mechanism of the interaction between the two phases and the prediction of void fraction are not clear at present.As a result the mechanism analysis of the wet gas flow should be discussed thoroughly and unquestionably,the experimental study is more suitable to be implemented in the simple straight pipe.
In this study,based on the hydrokinetics theory of the wet gas twophase flow,the factors that affect the pressure loss of gas phase are discussed in the straight pipe with the inner diameter of 50 mm.A more objective iteration procedure is developed for determining that the void fraction is proposed.In addition the performance of the new modeland other representative models for predicting the totalpressure drop is discussed.Compared with the experimental results,the deviation of pressure loss predicted by the model was within an acceptable range.This study forms the foundation for establishing the measurement model which can be further applied to wider conditions.
2.Wet Gas Pressure Drop Model
Given the inherent complexity of the two-phase flow,it is necessary to propose an assumption for simplifying the research subject before the model was developed,namely there is only one static pressure value that exists in each individual cross-section of the pipe.This study is limited to the analysis of the gas phase and it is assumed that the static pressure is one of the cross-sections of the pipe.According to the assumption,it can be identified that this model belongs to the typical one-dimensional model.
For a stable horizontal two-phase flow,the momentum equations of the two phases can be expressed respectively as follows in which the effects offriction and entrainmenthave been considered.In this equation,WGdenotes the mass flow rate of gas phase andA,is the actual circulation area of gas.UGandUDrepresent the local velocities of the gas and the entrained droplet,respectively.τGWand τidenote the shear stress between gas and walland the one between gas and liquid film.SGWrepresents the portion of the pipe perimeter in contact with the gas phase,andSiis the contacted length between the two phases on the local cross section.Some of the parameters are described in Fig.1.

What should be clarified is that since the entrained phenomenon is seemed as a dynamic equilibrium and the entrained droplets are considered as a part of the gas core,the entrainment factor was considered justin the equation of gas phase.As there is only one pressure tap in the cross-section of the pipe and the single pressure hypothesis in multiphase pipe flow has been accepted by many researchers[6,8],the static pressure of the two phases in the same cross-section seems to be identical which can be expressed as Eq.(3).Based on this hypothesis and eliminating the friction between the two phases,the pressure drop of wetgas flow is shown as Eq.(4)which is used to determine the pressure drop in this model.

From the above derived equation,the pressure drop gradient of wet gas is affected by the three factors at the right side including the friction between the gas and the pipe wall,the friction between the water and the pipe wall,and the entrainment.The correlations for solving the three terms on the right side of the equation will be created in the proceeding sections.Obviously there is not any terms with respect to the inter-phase friction in Eq.(4),but this factor is also discussed in this model in detail since it is one of the crucial factors in void fraction correlation.
2.1.Correlation for the perimeters
Before solving the two frictional pressure drops,there is a need to obtain the two perimetersSGandSL,in addition the correlations of the perimeter between the two phasesSishould be addressed as well(see Fig.1).MARS model[7]proposed a series of correlations for calculating the detailed flow parameters and this model has been verified by some different data sets.Given that,in this study,the approach for determiningSiin MARS model is adopted.

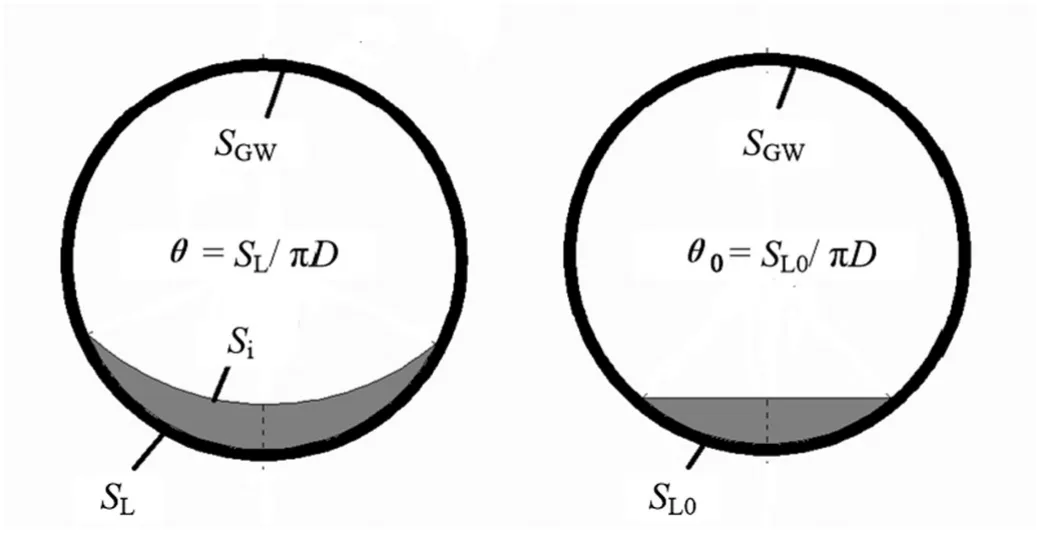
Fig.1.Schematic representation of wet gas in the cross-section of the pipe.(The left and right schematics represent the cross-section with the actual wetted perimeter and the minimum attainable wetted perimeter,respectively.)
In Eq.(5),θ0and θdenote the minimumattainable wetted perimeter fraction and the actualone respectively.αis the localvoid fraction andDis the diameter of the pipe.In MARS model,θ0can be approximated without generating significant accuracy loss by using Eq.(3)and θ can be calculated using Eq.(4)after θ0is determined.The gas phase Froude numberFrGand the liquid-phase Weber numberWeLSwhich correlate with θ are represented by Eqs.(5)and(6),respectively.

In Eq.(4),WeLSandFrGare liquid phase Weber number and gas phase Froude number,respectively,and their de finitions are given in Eqs.(8)and(9).

Since the gas phase just contacts with the liquid film and the wall of tube in stratified flow and uncompleted annular flow conditions,SGandSLcan be expressed as

2.2.Correlations for the shear stresses
Base on the discussion above,there are three majorshear stresses including the one between the gas and wall,the one between the water and wall,and the stress between the two phases which will affect the total pressure drop of the wet gas in horizontal pipes at the stratified and annular flow patterns.In order to calculate the three shear stresses the relevant drag coefficients should be addressed as well.
According to the classical single phase fluid dynamics theory,the shear stress between the medium and pipe wall is commonly depicted by Fanning equation[13]which has been testified by numerous test data in industries[14].The drag coefficient,in Fanning equation,is the crucial factor which is mainly affected by the roughness of the pipe and the Reynolds number of the flow.Since the research of single phase flow has a long history and the theory of it is much more mature than that of multiphase flow,many researchers would like to follow the basic form of Fanning equation when depicting the drag coefficient in two-phase flow.However some new elements have been considered in the expression ofshearstress in wetgas flow as the dynamics motion of it is more complicated.
As represented in Eq.(12),the stress between gas core and wall of the tube is shown by the form of Fanning equation in which the density and velocity of the medium are replaced by that of gas core.

fGWis the frictional factor between the gas core and the tube wall,Chrepresents the extra quantity of density resulting from the liquid entrainment quantityWLE.

As the entrainment liquid would exist in the gas phase,the form of velocity of gas coreUGC,is expressed as

In order to obtainfGWin the testoperating conditions accurately,before the wet gas test,the pressure drops of the dry gas flow are measured at every gas super ficial velocity test point.As these tests belong to the single phase flow condition,the reliable Blasuis form[15]can be used to fit the correlation offGWaccurately by using the direct pressure drop data.By this way the correlation offGWis fit as follows.

For the same reason,In Eq.(15),the Reynolds number has been replaced with the gas phase Reynolds numberReGwhich can be determined by using the empirical conclusion identified by Eck.

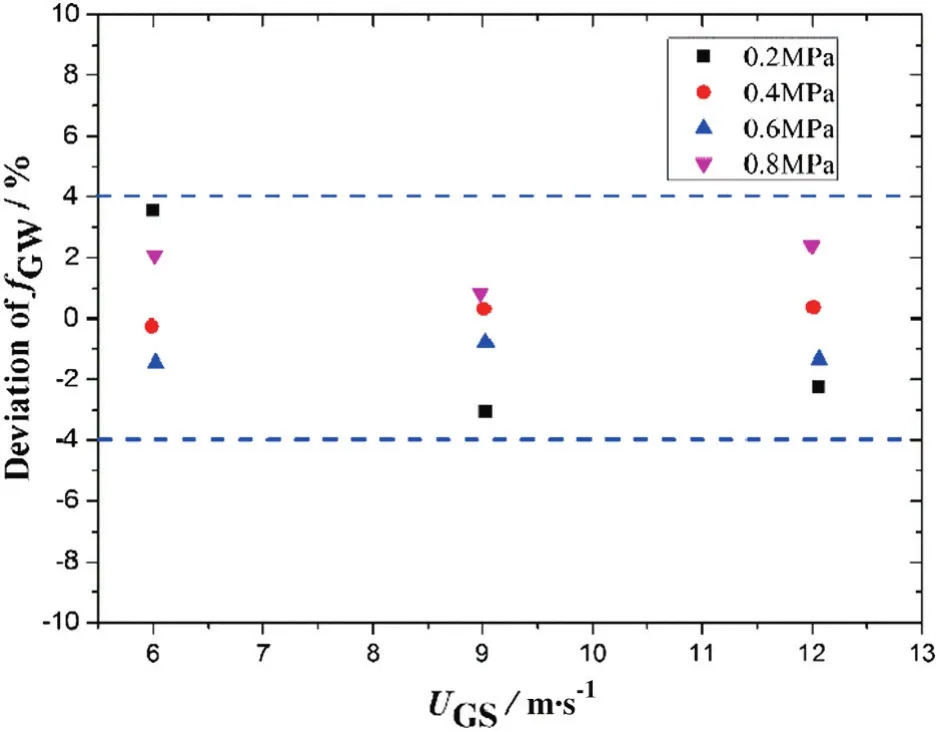
The relative deviations of the fit drag coefficientfGW,for different pressures,are plotted in Fig.2.For all four static pressures and three super ficial velocities,the test points drop in the error band of±4%which can represent the applicability of this fit correlation.
Substituting Eq.(16)into Eq.(15),fGWcan be solved,and similarly,substituting Eqs.(13)and(14)into Eq.(12),τGWcan be calculated.The shear stress between the liquid and pipe wall is simply represented by Eq.(17)in which the real liquid velocity can be expressed by using the super ficial velocity and void fraction.

Since the research of water flow in pipes has been conducted for decades,the drag coefficientfLWwhich denotes the stress between the liquid and pipe wall can be calculated by using the research achievement of the water pressure loss.Colebrook Equation[16]is one of the most important equations for studying the friction factor in single phase flow.It applies to all turbulent flow conditions.Values of friction factor that it predicts are generally accurate to within 10-15%of experimental data[14].The Colebrook Equation is used to describe the friction factorfLW.However the iteration method has to be added in this solving procedure due to the implicit expression of Eq.(18).

In Eq.(18)kdenotes the absolute roughness ofthe pipe line.The materialof the pipe used in these experiments is stainless steel,and the result of detection of it indicates that the absolute roughness is 5.98 μm.The Reynolds number for liquid can be depicted by means of the traditional formation and wetted perimeter fraction as follows.

As discussed above,by using Eqs.(17)to(19)the shear stress between liquid flow and pipe wall can be determined when the void fraction is known.
The friction between the two phases has been considered as one of the most complicated factors in two-phase flow by many researchers[17-19]and the most solutions of it still belong to the empirical or semi-empirical methodology at present.There is no doubt that people are used to reference the existed theories and methods which have been proved rightwhen they encounter the new phenomenon or problems.Wallis[4]is one of the early researchers who determined the friction coefficient between liquid film and gas by referring to Nikuradse's research on single phase flow[20].This approach has been adopted and modified by other researchers in the following decades[6,7,21].The similar method in which the mean height of the surface wave was regarded as the roughness of the pipe wall is adopted.
In 2003,Werven and his co-workers[22]constructed a type of modelfor measuring the static pressure ofwetgas flow when itthrough the convergentand divergentsections of Venturi meter.The model was validated by using the experimental data within the pressure range of 1.5 to 9 MPa and the estimated results were considered to be acceptable.In this model,the effect of liquid entrainment is considered when the correlation of shear stress between gas core and liquid film is developed.

In Eq.(20),fiis the frictional factor between the two phases.As the entrainment liquid would exist in the gas phase,in Ref.[22],the form of velocity of gas coreUGC,is expressed as

In this study,considering the difference between the velocities ofgas core and liquid film,Eq.(20)has thus been modified.Replacing the velocity of gas coreUGCin Eq.(20)with the difference between the velocities of gas core and liquid film,the shear stress can be expressed by Eq.(22).
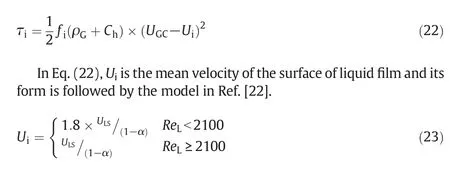
As depicted in Eq.(23),Uirelates to the liquid phase super ficial velocity and void fraction of the pipe.The form of liquid phase Reynolds number is identified by Eq.(24).

The Colebrook equation would also be used here to predict the drag coefficient between the two phases.However,since the calculation difficulty induced by its implicit expression,the Colebrook correlation is replaced by a more convenient one,Haaland correlation(Eq.25)[23],in which the conventional Reynolds number has been substituted by the corresponding one in the gas core.

When the formation offiand τiare obtained,in this package program,most of the in fluential factors of the inter-friction motion will be affected by the last unknown parameter,the relative roughness.In single phase pipe flow the roughness is just the essential property of the pipe wall,but when it denotes the mean height of the film wave in two-phase flow,there is no theoretical method that can model it accurately.As a result,the relative roughness is fit based on the experimental data by using the relevant non-dimensional parameters includingsi,UGS/(gD)0.5,Xand ρG/ρLas follows.

The performance and deviation of the fit correlation in the whole model will be discussed in the subsequent section and the deviations will not induce an unacceptable result in static pressure calculation which can be proved in the proceeding sections.According to the statement before,the three shear stresses correlated to the frictional pressure drop of wet gas and their components are distinguished and clarified.
2.3.Correlation for the entrainment
Firstly,the momentum equation for entrained droplets should be obtained.Assume that the mean diameter of a single droplet isdD,and the volume of the single droplet can be expressed by Eq.(28).

Ifthe velocity ofthe entrained dropletisUDandψis the volume fraction of the droplet to the entire gas core,the total volume of the droplet through the gas core section per unit time isAUDψ.In this study,by using the resistance equation for flow around a sphere,the drag force on a single droplet can be depicted in Eq.(29),in whichCDis the drag coefficient of the sphere resistance.

MultiplyingFDby the totalnumber ofdroplets in the controlvolume,i.e.AUDψ/VD,while taking into consideration the relative velocities between the gas phase and droplet,the total force on the control volume can be presented by Eq.(30).

When the flow field is steady,the differential equation for the momentum of the total control volume can be expressed as

According to the momentum theorem,Eq.(30)should be equal to Eq.(31).Thus,the momentum equation for the entrained droplet is

The mean diameter of a single dropletdD,in the equation above,can be estimated by using the correlation as recommended by Azzopardi and Govan[24].

Based on the above analysis,ifWLEandWGare identified,the local value of dUD/dycan be calculated using Eq.(32).The de finition of entrainment is dividingWLEby the total liquid flow rateWL.

In 2001,Lei Pan and Hanratty[25]indicated that entrainment is resulted from a balance between the rate ofatomization ofthe liquid layer flowing along the pipe wall and the rate of drop deposition.Al-Sarkhi and Sarica[26]proposed a model to predict the droplet entrainment in gas-liquid annular flow in 2013 and this model has been validated by some kinds of test data from the pipes with different orientations.Therefore the model is applied in this study and the entrainment(E)can be expressed by Eq.(35)in whichEmdenotes the asymptotic orlimiting value of the maximum entrainment fraction.

In last equationWeGS*is a constant which should be obtained by using the experimental data available in the literature.In horizontal flow data,the correlation for determiningWeGS*was proposed in Ref.[26]as follows and that is also used in this work.

The entrainmentratio and the localentrained liquid flow rate can be calculated successfully by using Eqs.(35)and(34),respectively.
2.4.Correlation for the void fraction
Void fraction has been considered as one of the most complicated elements in two-phase flow by a couple of researches.In 2006,Woldesemayatet al.analyzed the 68 existing representative void fraction models in the research area of two-phase flow history[27].These models were classified and verified by different sets of experimental data.The conclusions indicated that the deviations of these models which are proposed in different flow patterns are more than 30%,which demonstrate that the intrinsic disadvantages of these fit void fraction correlations are mainly due to theirsubjectivities.Consequently a more objective method for determining the void fraction in the horizontal pipe is proposed and used in this study.
As discussed above,the hypothesis used in this study indicates that there is only one static pressure(or pressure drop)in the local crosssection of the pipe.However,pressure drop of gas and liquid phase can be obtained by solving their momentum equations respectively and,most of the time,they may not be completely equal.There is a critical phenomenon that the momentum equations of both phases are sensitive to the void fraction,so adjusting the void fraction until the requirements of the hypothesis is met can be a method to determine this crucialfactor.Substituting Eq.(2)into Eq.(1)and eliminating dp/dy,the correlation may seem as the constraint equation of the void fraction is obtained as Eq.(37).Iterating the local void fraction until Eq.(37)is met,the final value of the iteration can be adopted without using any empirical or semi-empirical correlations.

For this equation,there is a situation that should be explained.It seems a little strange that the term regarding to the shear stress between the two phases did not appear in Eq.(37)which was used to calculate the pressure drop of the wet gas,but the solution algorithm of τiis stilldiscussed in Section 2.2.The reason is thatthe iteration method of the void fraction makes the inter-shear stress to be one of the necessary factors in this model.
2.5.Summary of the model
Integrating the models presented above,a setof models for calculating the axialstatic pressure ofwetgasin horizontalpipe was developed.When the two phase flow rates and the inlet pressure are known,considering the factors related,the static pressure in localcross sections can be obtained by solving the derived equation from the momentum equations of the two phases.The interfacial perimeter is determined by Eq.(5)and the shear stresses are calculated from Eqs.(12)to(22).The pressure drop term of friction can be determined by using these two parameters.The pressure loss of acceleration is obtained by determining the void fraction which can be calculated from an iteration method.For the pressure drop of entrainment,the related parameters including the local entrainment and the velocity of the droplets are calculated using Eqs.(34)to(36)and Eq.(32),respectively.Upon obtaining the above three majorpressure loss factors,the static pressure of wet gas in the local step can be calculated from Eq.(1)accordingly.The procedures were implemented iteratively by taking the results of the previous step to be the initial conditions of the next one.The detail of the calculation procedure is plotted in Fig.3 and this model was compiled into a Matlab computer program.Since the model is less dependent on the specific empirical apparatus and data,it provides the basis for further establishing a flow measurement model of wet gas which will produce fewer biases when it is extrapolated.Fig.3 is the flow chart for the calculation of wet gas static pressure.
3.The Experiment Setup
The experiments were conducted on the Dual-closed recirculating loop wet gas test facility which was shown in Fig.4.The test mediums of fluids were airand water.The gas flow is produced by a Roots blower,and is capable of delivering volumetric flow rates of 1-1000 m3·h-1at the line-pressures ranging from 0.1 to 1.6 MPa gauge.With the uncertainty of1%,a 100 mm turbine meter was used to measure the reference dry gas flow rate.The liquid(water)was injected into the streamviaan injector nozzle placed on the axis of the pipe,facing downstream.A water pump was used to deliver liquid to the nozzle at the flow rate up to 8 m3·h-1.The liquid flow rate through the nozzle was controlledviaa 25 mm ball valve,which was located on the liquid recirculating loop.The reference liquid flow rate is measured by an electromagnetic meter,for which the uncertainty was 0.5%.The horizontal mixture test section was located on the downstream of the injector nozzle,the inner diameter of which is 50 mm.By using the gas-liquid separation tank,the two-phase fluids were circulated back to their own loop.
The experiments were implemented at four different line pressures,which were 0.24,0.4,0.6 and 0.8 MPa.The gas flow rates,expressed by the super ficial velocity(UGS),were selected in the range between 6 and 12m·s-1.In Lockhart-Martinelli terms,the liquid flow rates correspond to 0-0.35.The range of the liquid mass fraction(LMF)of the two-phase flow is 0 to 79%.The flow conditionsofthe experiments are summarized in Table 1.
Due to the widespread use in petroleumindustry,the Mandhane flow pattern map(Fig.5)[28]was used in this study to identify the flow regimes appearing in the experiments.The abscissa and ordinate of this map are super ficialvelocity ofthe gas phase and liquid phase,respectively,which make this flow pattern map more convenient to be used than the other ones.Mandhane map is constructed in the liquid density range of 705 to 1009 kg·m-3and the gas density range of 0.8 to 50.5 kg·m-3,which can cover the test condition in this study completely.From the distribution of the test points in Fig.5,it can be demonstrated that most of the flow regimes occurring in the experiments are annular and wavy flow and only severalpointsdrop within the scopes ofstratified and dispersed flow pattern which is consistentwith the entrainmentprediction performed in the proceeding paragraphs.
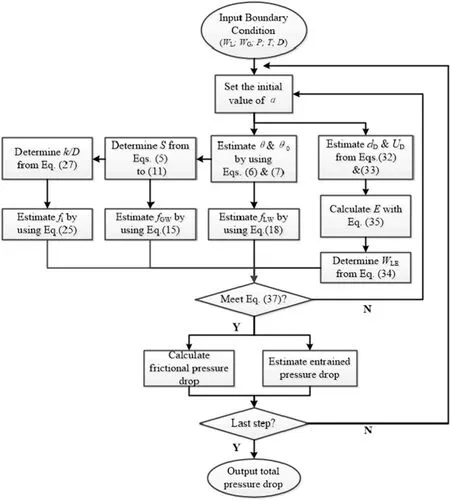
Fig.3.Flow chart of the model for static pressure distribution calculation of wet gas.

Fig.4.Schematic diagram of the experimental setup.
4.Results and Discussion
The horizontal distances between the pressure taps of the pipe are 3000 mm.Since the step length was set to be 1 mm in stream-wise,the total numbers of steps for this tube is 3000.Assuming that the pipe diameter is constant within a step length,the boundary condition of the model can be determined.By using the calculation procedures discussed previously,the flow parameters can be obtained in the first step.By setting the results of the previous step to be the initial conditions of the next one,the calculation procedures was continued until the static pressure of the second tap was obtained.
According to Eq.(4)in which the friction between the two phases seemed as the inter-action of this two-phase system,the total pressure drop is consisted by three components including the friction betweengas and pipe,the friction between liquid and pipe,and the effect of entrainment.The percentage of these factors in the whole pressure drop can be seen as one of the crucial characters in wet gas pipe flow therefore the distribution of it in different test conditions should be addressed.Fig.6 depicts the variation of the three factors'proportions in different Lockhart-Martinelli parameter(liquid loading)at the constant line pressure(0.2 MPa)and the constant gas super ficial velocity(9 m·s-1).The proportions marked in the left ordinate denote the segmental pressure drops divided by the total pressure loss.WhenXequals 0,there is no liquid in the pipe,the totalpressure drop completely consists of the friction between the gas and the pipe wall.However,when the liquid phase added the friction between water and pipe dramatically increased and,in the meantime,the friction between gas and pipe declined.The reasons of that mainly lie in two aspects:(1)the increment of the wetted perimeter reduced the proportion of the dry perimeter of which variation trend can be watched clearly in this figure and(2)the viscosity of water is far higher than that of gas.With the different trends of the two phases'frictions during the increment of the liquid volume fraction,the proportion of the liquid friction effect must exceed that of gas phase at certain point and this point appears whenX≈0.024 in this test condition(the position near the dot line marked in Fig.6).What should be noticed is that after a sharp increase(or decrease)stage between the two dash lines in Fig.6,the tendency of the liquid friction(or gas friction)element became slow gradually.This phenomenon can be accounted for the less increment of wetted perimeter after the liquid volume fraction reaches a certain standard in this condition of line pressure and gas flow rate.Though its quantity is much less than other elements,the pressure drop due to entrainmentexists in the totalpressure loss as well when there is liquid in the testloop.The distribution ofthe three pressure drop elements in Fig.6 demonstrates that the vast majority of the static pressure loss comes from the friction of gas and liquid phaseversusthe pipe's wall,and the proportion of liquid fiction would surpass that of gas phase whenXincreased.

Table 1Scope of the experiments
The similar distribution of the three pressure drop elements at the test condition of 0.6 MPa andUGS=9 m·s-1is depicted in Fig.7.Compared with Fig.6,there are two major differences in the figure below.The first one is that the surpass phenomenon of the liquid and gas frictions appears at an earlier stage of the liquid fraction.The liquid friction increases so rapidly that the critical surpass point marked with the dot line cannotbe captured exactly in this test(the criticalposition drop between the second and the third test points).This change can be explained as the more rapid increment of the wetted perimeter owing to the addition of the line pressure of which tendency can be identified in this figure as well.The effect of the line pressure to the wet gas flow is demonstrated clearly because the chosen gas super ficial velocity and Lockhart-Martinelliparameter in Fig.7 are identicalto thatoffig.6.In fact,the increment of the static pressure would induce more gas(mass flow rate)through the test loop at the same super ficial velocity condition therefore the liquid at the bottom of the pipe is more forced to creep up the wall.The second change in Fig.7 is that the proportion of the gas friction would drop to zero under certain circumstances(whenXis more than 0.09)and the liquid friction almost equals the total pressure drop accordingly.It can be simply accounted for that the local wall of the pipe has been completely wetted so the flow pattern becomes annular and the gas phase did not contact the pipe wall atall.The percentage ofthe entrainmenteffectis stillrelatively low nevertheless the absolute quantity of the entrainment friction is far more than the preview condition.
In order to testify the performance of the pressure drop prediction model,the deviation ofthis model and other two representative models including MARS model and Power-Law model in every test point is depicted and discussed,respectively.
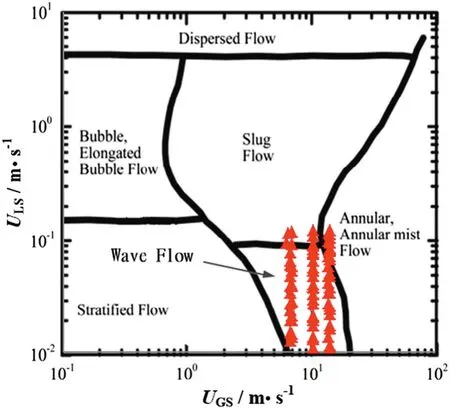
Fig.5.Distribution of test points in Mandhane flow pattern map.
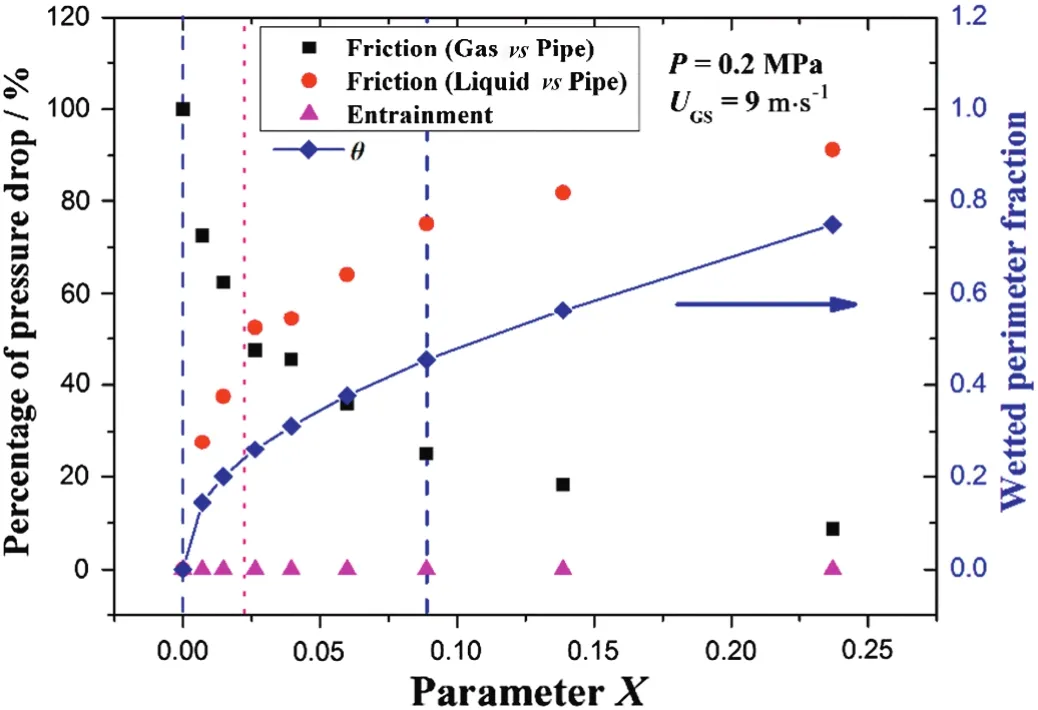
Fig.6.Distribution of the pressure drop terms and wetted perimeter fraction with different liquid fractions(P=0.2 MPa).
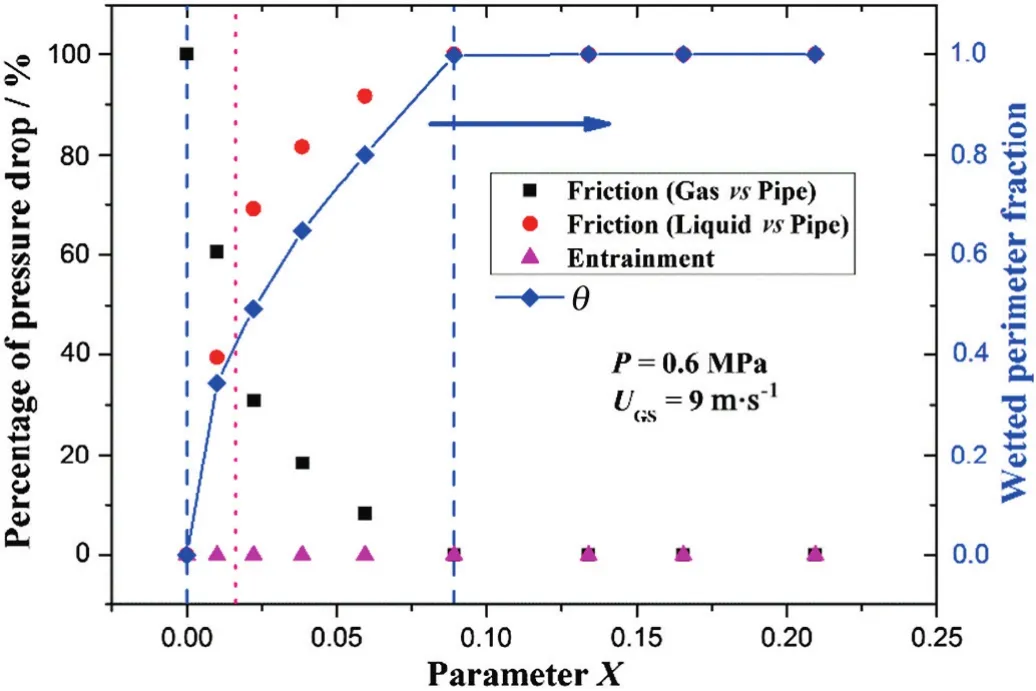
Fig.7.Distribution of the pressure drop terms and wetted perimeter fraction with different liquid fractions(P=0.6 MPa).
Fig.8(left)reveals the relative deviation of the predicted wet gas pressure drop by using MARS model in which the abscissa represents the liquid fraction by means of the Lockhart-Martinelli parameter.MARS model can be attributed to one of the models in which the flow details such as flow pattern and wetted perimeter have been considered.Compared with the homogeneous model an entirely differentperformance is expressed in Fig.8(left).Except the test points nearX=0,the error of the vast majority test data fall in the boundaries of-20%and-80%.The deviation of the dry gas indicates that even the correlation for single phase friction prediction cannot ensure its applicability for the all working conditions including the flow medium and the roughness of the pipe.Fortunately this errors appearing in the dry gas flow could be modified and this work has been finely conducted and shown in the previous section.The apparently negative tendency of the deviation with the increasingXdemonstrates that there are some affects inducing the friction or dissipation due to the incrementofliquid fraction have been underestimated in this model.Moreover the consistent trend of data in different line pressures shows that this model can more easily be modified than the homogeneous one.Owing to this crucial advantage,many procedures proposed in MARS model are chosen to be improved in this study.
A Power-Law correlation for gas-liquid flows in horizontal pipelines was proposed by Al-Sarkhi and Sarica in 2010[29].By using the dimensionless groups ofthe flow parameters,the correlations for the two specific flow patterns(stratified and annular)which can predict the pressure drops were developed as follows.In Eq.(38)allthe parameters with a superscript asterisk denote the dimensionless form of their original ones.

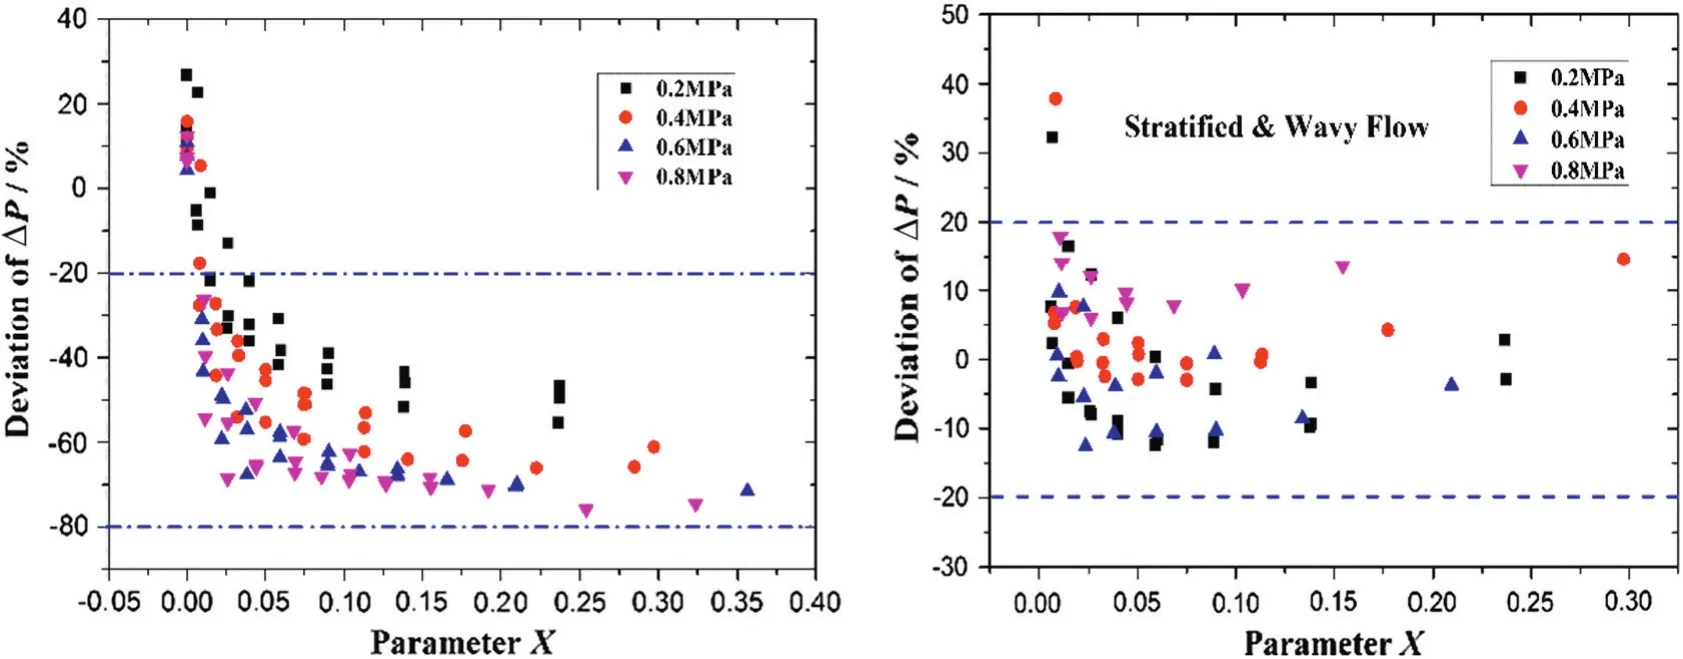
Fig.8.Deviation of the predicted pressure drop by MARS model(left)and Power-Law model(right)with different line pressures.
The correlation above has also been testified by using the test data proposed in this study.Since the methodsforobtaining the flow parameters such as perimeters(SL,SG,Si)and drag coefficients(fL,fG)have not been mentioned in Ref.[29],these parameters are determined by using the methods proposed in this work.The test data are testified by using the Power-Law correlation in stratified and annular flow conditions,respectively.In stratified and wavy flows,the predictive performance of the Power-Law correlation is depicted in Fig.8(right)which shows that except the two test points in low pressure and liquid ratio,most data distributed in the error band of±20%.This demonstrated that,to a certain extent,the correlation is applicable for the test data in these flow patterns.However,all the calculated pressure drops from the Power-Law annular correlation resulted in a deviant negative value.This phenomenon can be mainly accounted for the test condition does not firmly meet the hypothesis of this correlation which assumes thatUGis far higher thanUL.According to the calculated void fractions and the inlet flow rates of the gas and water,at annular condition,the real gas velocity range is 6.8-12.9 m·s-1and the real water velocity range is 1.58-2.8 m·s-1in this experiment.Therefore the Power-Law correlation can be partially applied in this test data with a certain deviation degree.
Considering the features and hypothesis of the representative models and their test performance,some procedures and improvements have been conducted in this paper.In order to describe the motion of the wet gas flow more specifically,the correlations related to the flow details including the wetted perimeter and the interface of the two phases are developed.Furthermore an iteration procedure is proposed to determine the void fraction which,to the same extent,is more objective than any other fitcorrelations fromsome specific experimental data.The effects of the entrainment on the pressure loss are discussed quantitatively as well.As the factors mentioned above are considered and the relevant procedures have been added in this model,the performance of the relative deviation represented in Fig.9 is much improved.Primarily all the relative deviations of the testpoints are within 20%and the fitcorrelation for the dry gas pressure loss estimation successfully limits the error of single gas within±5%.It is also worth mentioning that more than 83%deviation of the test data distributed evenly within the band of±10%which demonstrates the extensive applicability of the model on the experimental data.On the other hand,there also are some estimation deviation existing in this combined correlation.Unfortunately owing to the combined mechanism of the in fluential factors on the total pressure drop,more specific experiments need to be conducted to identify which factor(or factors)should be responsible for these deviations.
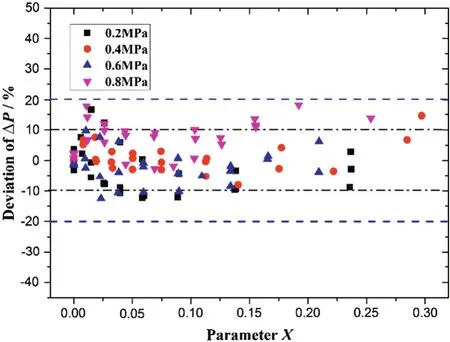
Fig.9.Deviation of the predicted pressure drop with different line pressures.
In regard to the whole model and the wet gas flow in horizontal pipe,there are same issues that should be discussed thoroughly.The whole model is constructed based on the hypothesis that the twophase flow is in the stable stage,however the real wet gas flow could not meet the requirements of the ‘stable flow’accurately even though in the horizontal pipe.Thus the stable flow can be understood as an approximate conceptand the measurable elements such as wetted perimeter and void fraction should seem as the mean values of their fluctuations.It is well-reasoned to use the traditional methods and procedures which have been testified in single phase flow tests extensively to solve the problems encountered in multiphase flow,and this methodology has been adopted by a number of researchers.Actually the mechanism of interaction between gas and liquid in pipe line with different directions is too complicated to be understood completely in the near future,since there is no suitable experimental method at present.As a result,before the more theoretical model for describing the mechanism of the wet gas is constructed,the researchers have to believe in the previous methodology and that is the frustrating reality encountered in this study.
5.Conclusions
By using the theory of hydrodynamics,the wet gas flow in the horizontal pipe was analyzed.The model for calculating the axial distribution of the wet gas static pressure in the straight pipe has been developed,which takes into consideration the factors including the void fraction,the friction between the two phases and the entrainment.In addition a more objective approach to determine the local void fraction was proposed.For validating the developed model,the wet gas experiments were carried out under the pressure range of 0.1-0.8 MPa.The predicted results,in comparison to the corresponding experimentaldata,fallinto a reasonable range.As the mechanism ofthe wet gas flow in horizontal pipe was discussed,this study provides the basis for further establishing a flow measurement model of wet gas which will produce fewer biases when it is extrapolated.
[1]I.ISO,TR 11583,Measurement of Wet Gas Flow by Means of Pressure Differential Devices Inserted in Circular Cross-Section Conduits,ISO,Switzerland,2012.
[2]R.Lockhart,R.Martinelli,Proposed correlation of data for isothermal two-phase,two-component flow in pipes,Chem.Eng.Prog.45(1949)39-48.
[3]G.F.Hewitt,Measurement of Two Phase Flow Parameters,Nasa Sti/Recon Technical Report a,79,1978 47262.
[4]G.B.Wallis,One-dimensional Two-phase Flow,McGraw-Hill Companies,1969.
[5]D.Chisholm,A theoretical basis for the Lockhart-Martinelli correlation for twophase flow,Int.J.Heat Mass Transf.10(1967)1767-1778.
[6]J.Hart,P.Hamersma,J.Fortuin,Correlations predicting frictional pressure drop and liquid holdup during horizontal gas-liquid pipe flow with a small liquid holdup,Int.J.Multiphase Flow15(1989)947-964.
[7]E.Grolman,J.M.Fortuin,Gas-liquid flow in slightly inclined pipes,Chem.Eng.Sci.52(1997)4461-4471.
[8]P.Yu,Y.Xu,T.Zhang,Z.Zhu,X.Ba,J.Li,Z.Qin,A study on the modeling of static pressure distribution of wet gas in Venturi,AIChE J61(2015)699-708.
[9]J.Murdock,Two-phase flow measurement with orifices,J.Basic Eng.84(1962)419-432.
[10]D.Chisholm,Flow of incompressible two-phase mixtures through sharp-edged orifices,J.Mech.Eng.Sci.9(1967)72-78.
[11]R.De Leeuw,Liquid correction of Venturi meter readings in wet gas flow,North Sea Flow Measurement Workshop,1997.
[12]R.N.Steven,Wet gas metering with a horizontally mounted Venturi meter,Flow Meas.Instrum.12(2002)361-372.
[13]J.T.Fanning,A Practical Treatise on Hydraulic and Water-supply Engineering,Ripol Classic,New York,1892.
[14]J.B.Franzini,E.J.Finnemore,R.L.Daugherty,Fluid Mechanics with Engineering Applications,McGraw-Hill College,1997.
[15]H.Blasius,Communication on Research in the Field of Engineering,Springer,Berlin,1913.
[16]C.F.Colebrook,T.Blench,H.Chatley,E.Essex,J.Finniecome,G.Lacey,J.Williamson,G.Macdonald,Correspondence.Turbulent flow in pipes,with particular reference to the transition region between the smooth and rough pipe laws.(Includes plates),J Ins Civ.Eng.12(1939)393-422.
[17]W.Shi,W.Huang,Y.Zhou,H.Chen,D.Pan,Hydrodynamics and pressure loss of concurrent gas-liquid downward flow through sieve plate packing,Chem.Eng.Sci.143(2016)206-215.
[18]C.A.Konishi,W.Qu,Toward a generalized correlation for liquid-vapor two-phase frictional pressure drop across staggered micro-pin- fin arrays,Int.Commun.Heat Mass75(2016)253-261.
[19]M.Abdel-Aziz,M.El-Abd,M.Bassyouni,Heat and mass transfer in three phase fluidized bed containing high density particles at high gas velocities,Int.J.Therm.Sci.102(2016)145-153.
[20]J.Nikuradse,Laws of flow in rough pipes,National Advisory Committee for Aeronautics,Washington,1950.
[21]D.Schubring,T.Shedd,A model for pressure loss, film thickness,and entrained fraction for gas-liquid annular flow,Int.J.Heat Fluid Flow32(2011)730-739.
[22]M.Van Werven,H.Van Maanen,G.Ooms,B.Azzopardi,Modeling wet-gas annular/dispersed flow through a venturi,AIChE J49(2003)1383-1391.
[23]S.E.Haaland,Simple and explicit formulas for the friction factor in turbulent pipe flow,J.Fluids Eng.105(1983)89-90.
[24]B.Azzopardi,A.Govan,The modelling of Venturi scrubbers,In:Filtech Conference 1983,pp.274-285.
[25]L.Pan,T.J.Hanratty,Correlation of entrainment for annular flow in horizontal pipes,Int.J.Multiphase Flow28(2002)385-408.
[26]A.Al-sarkhi,C.Sarica,Modeling of the droplet entrainmentfraction in adiabatic gasliquid annular flow,Multiph.Sci.Technol.25(2013)1-23.
[27]M.A.Woldesemayat,A.J.Ghajar,Comparison of void fraction correlations for different flow patterns in horizontal and upward inclined pipes,Int.J.Multiphase Flow33(2007)347-370.
[28]J.Mandhane,G.Gregory,K.Aziz,A flow pattern map for gas-liquid flow in horizontal pipes,Int.J.Multiphase Flow1(1974)537-553.
[29]A.Al-sarkhi,C.Sarica,Power-law correlation for two-phase pressure drop ofgas/liquid flows in horizontal pipelines,Soc.Petrol.Eng.5(2010)176-182.
杂志排行
Chinese Journal of Chemical Engineering的其它文章
- Suppression of gold nanoparticle agglomeration and its separation via nylon membranes☆
- Effects of solubility parameter differences among PEG,PVP and CA on the preparation of ultra filtration membranes:Impacts of solvents and additives on morphology,permeability and fouling performances
- Experimental detection of bubble-wall interactions in a vertical gas-liquid flow☆
- Horizontal gas mixing in rectangular fluidized bed:A novel method for gas dispersion coefficients in various conditions and distributor designs
- Synthesis of clay-supported nanoscale zero-valent iron using green tea extract for the removal of phosphorus from aqueous solutions
- Hydrodynamic dispersion ofreactive solute in a Hagen-Poiseuille flow of a layered liquid
