Experimental measurement of tip vortex flow field with/without cavitation in an elliptic hydrofoil *
2017-03-14XiaoxingPeng彭晓星LianghaoXu徐良浩YuwenLiu刘玉文GuopingZhang张国平
Xiao-xing Peng (彭晓星), Liang-hao Xu (徐良浩), Yu-wen Liu (刘玉文), Guo-ping Zhang(张国平),
Yan-tao Cao (曹彦涛), Fang-wen Hong (洪方文), Kai Yan (颜开)
National Key Laboratory on Ship Vibration and Noise, China Ship Scientific Research Center, Wuxi 214082, China,E-mail: henrypxx@163.com
Introduction
Tip vortex can be generated in lifting surfaces with finite wingspan. For marine propeller and hydrofoil tip vortex frequently induce the tip vortex cavitation (TVC) due to the low pressure in the vortex core.In propeller design TVC is one of the important factors that should be considered carefully. The reason are that TVC often appears earlier than other types of cavitation in propeller and the dynamic behavior of TVC is responsible for hull vibration and noise,though in some situations TVC may be observed alone or in combination with attached cavitation[1,2].Study on the flow structures of tip vortex flow without cavitation is of fundamental importance in understanding the mechanism and prediction of TVC inception.On the other hand obtaining the information of flow field of tip vortex with cavitation is helpful in understanding the instability of TVC.
Many theoretical, experimental and numerical studies have been focused on the prediction of tip vortex cavitation inception. Lowest mean pressure in the flow field, the water quality and pressure fluctuation are considered as the main factors in affecting the TVC inception[1]. In order to find TVC inception number σi, the minimum pressure in the vortex should be determined. McCormick[3]first found that the core radius of tip vortex correlated with the boundary layer thickness. From a theoretical point of view, establishment of vortex model to describe the vortex flow field is very important[4]. Usually the vortex model proposed by Batchelor[5]and other simple 2-D vortex models, such as Rankine vortex model and Burgers vortex model, are used to describe the structure of the trailing vortex flow. But these models only valid far downstream of the wing tip.Moore and Saffman[6]developed a more sophisticated model, valid in the intermediate region between the completion of roll-up and the far field. Unfortunately in practice the tip vortex is not an ideal line vortex and vortex of strength and viscous core radius may vary with vortex trajectory. The vortex of strength and viscous core radius are still needed to obtain from the experiments.
In fact the formation of tip vortex is a complicated process which may include the interaction among the circulation flow from pressure side to suction side, leading edge separation and the roll up of vortex sheet shedding from the trailing edge. To better understand the velocity field of tip vortex, the measurements around a tip vortex close to the viscous core without cavitation have been performed in numerous studies. In the early years laser Doppler velocimetry(LDV) based on single point measure- ment was used on a stationary wing tip vortex by many researchers,such as Higuchi et al.[7], Arndt et al.[8], Fruman et al.[9]and Boulon et al.[10]. Then the LDV method was applied to measure the tip vortex flow field in rotating propeller by Chesnakas and Jessup[11]and Felli’s research group[12-14]. These mea- surements clearly showed the tip vortex far from the tip position has typical two dimensional vortex flow structure and obey some of vortex models. In addition Arndt[1]indicated that the structure of the propeller-tip vortex has many similarities to the tip vortex structure on a fixed blade. But by LDV measurement method it is difficult to get the message of specific distribution and cannot deal with the wandering of the vortex core.
Recently stereo particle image velocimetry (SPIV)was applied in the tip vortex flow measurement. del Pino et al.[15]used SPIV to measure the 3-D velocity field in the tip vortex behind a foil without cavitation.The results showed better agreement with the model of Moore and Saffman than that of Batchelor. Chang et al.[16]used SPIV to measure the tip vortex flow field for the study of the effect of mass jet on the suppression of vortex cavitation. Dreyer et al.[17]applied SPIV on the measurement of tip leakage vortex behind the foil in no cavitation condition. Pennings et al.[18]obtained the velocity distribution around the tip vortex core by SPIV both with and without cavitation.However, as these SPIV measurement sections are quite far from the tip position, less information is provided in the formation of tip vortex.
On the other hand with the development of CFD and computation tools the numerical simulation plays an increasingly important role in the investigation of TVC, especially in the prediction of TVC inception[19,20]. At the same time the verification and validation are paid more attention in numerical simulation of cavitation inception and cavitation behaviors[21]. For this purpose the experimental data for tip vortex flow field, TVC inception and TVC behavior are urgently needed.
To understand more about the information of tip vortex and tip vortex cavitation, in the present study LDV was employed to measure the tip vortex flow field in some sections along the vortex trajectory in the conditions without cavitation. SPIV was adopted to measure the velocity and vorticity distributions with and without cavitation. To obtain the formation process of the tip vortex the measurement sections were set as close as possible to the tip position. In addition high speed cameras were also used to show the form variation and the size of tip vortex cavitation.Beside some discussions and conclusions presented in this paper, we hope these measurement data can provide source material for further analysis and numerical verification.
1. Experiment facility and test model
The experiments were conducted in Cavitation Mechanism Tunnel of China Ship Scientific Research Center (CSSRC) as shown in Fig.1. The tunnel has two exchangeable test sections of circular and square respectively. In present study the test section with a square cross section was used. The size of the test section is 1 600 mm (L) × 225 mm (W ) × 225 mm (H)and maximum incoming velocity can be up to 25m/s.The contraction ratio is 12.61 and the turbulence level of incoming flow is less than 0.5%.

Fig.1 (Color online) The sketch and photo of Cavitation Mechanism Tunnel in CSSRC
The tunnel is constructed of stainless steel and holds about 80 m3of water. There are some water quality control systems in the tunnel. Filtration system can wipe off the solid particles up to 10 micron and improve the transparency of the water. Fast degassing device using the ideal of “diffusion nuclei” can control the air content of water. The tunnel also equipped a nuclei seeding system to simulate the nuclei distri-butions. The large degassing tank is installed following the diffuser and the free gas created in the test section will be escaped from the free surface of the tank through the several rows of screens and honeycombs inside the tank.
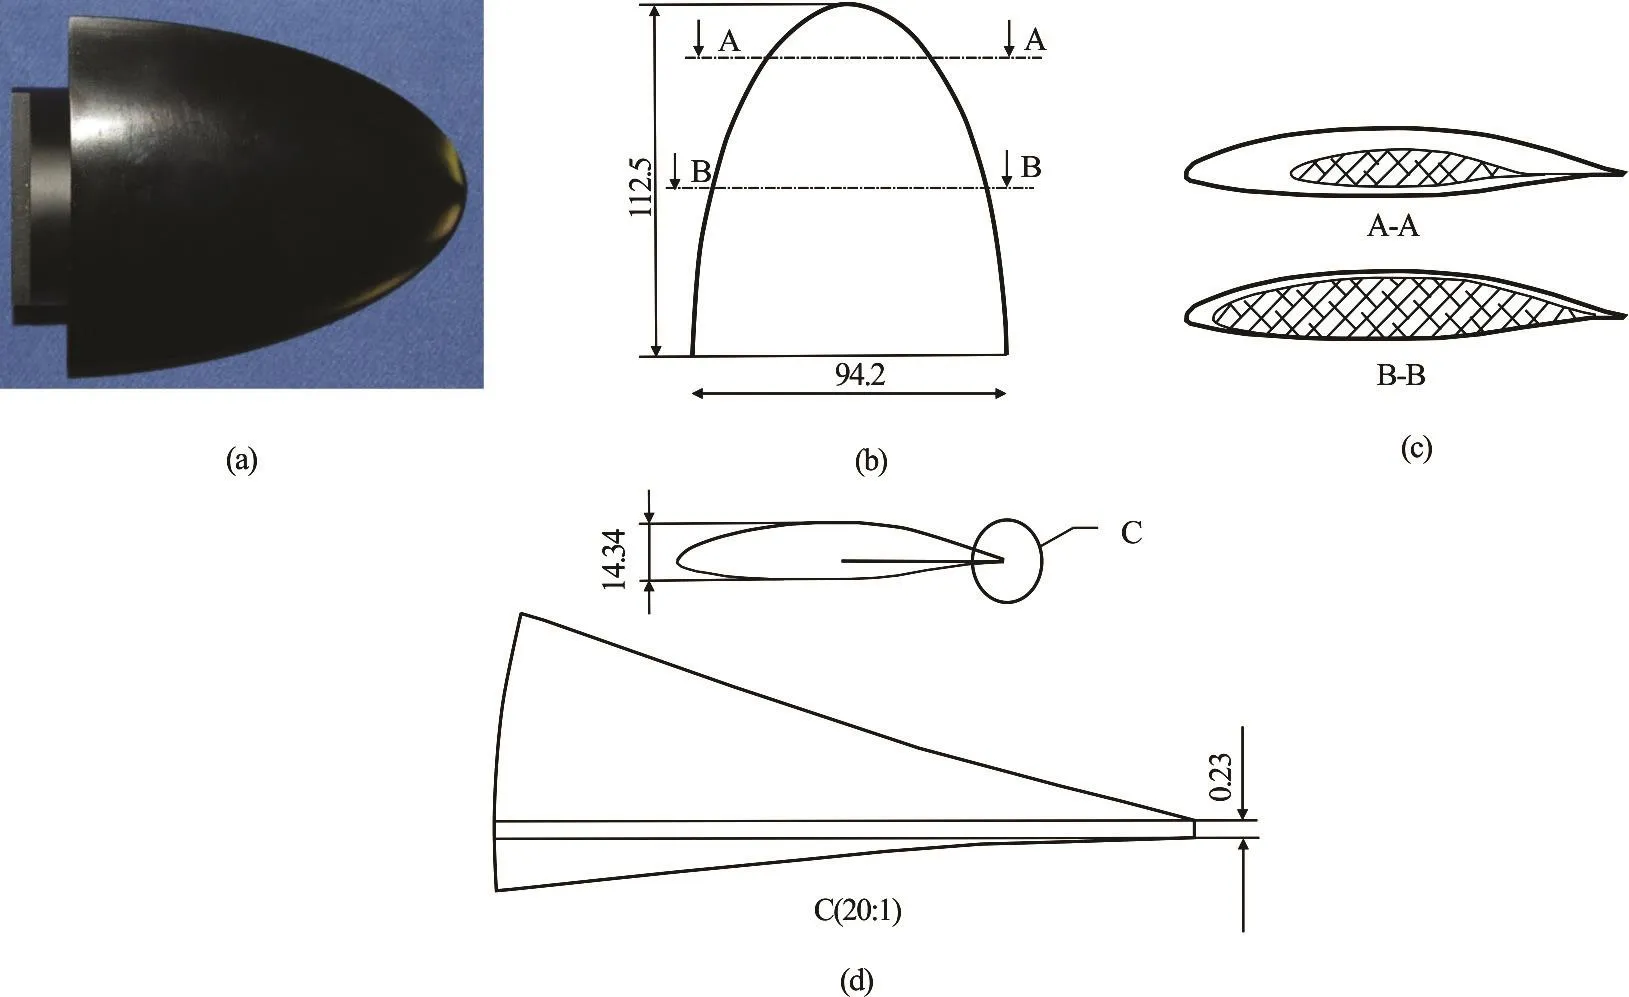
Fig.2 (Color online) Test model of elliptic hydrofoil NACA662-415

Fig.3 Experiment setup for LDV measurement

Fig.4 Experiment setup for SPIV measurement
The elliptic hydrofoil with section NACA 662-415 was chosen as test model shown in Fig.2. The blade has a finite wing with aspect ratio 3. The maximum chord and half span of the model are 94.2 mm and 112.5 mm respectively. Due to manufacturing limitations trailing edge truncated at 0.23 mm thickness perpendicular to the chamber line.
2. Measurement methods
The cavitation number of incoming flow is defined as

where0V and0p are the incoming velocity and the static pressure measured by two differential pressure transmitters respectively at the test section entrance,distance from the foil tip 290 mm upstream,vp saturation vapor pressure determined by the test water temperature, which was measured by a temperature sensor placed submerged in the tunnel water. ρ water density. The type of two differential pressure transmitters are EJA110A with accuracy 0.065% of full scale pressure (600 kPa). The static pressure was based on the pressure different with atmosphere. The tunnel inlet velocity was based on the pressure drop over the upstream of contraction. A temperature sensor (type ETW 51) with accuracy 0.2% of full scale temperature (100oC) was placed in a tube submerged in the tunnel upstream of the honeycomb.In the experiments, the cavitation number was adjusted by changing the incoming velocity and the pressure.

Fig.5 Measurement results of lift coefficient
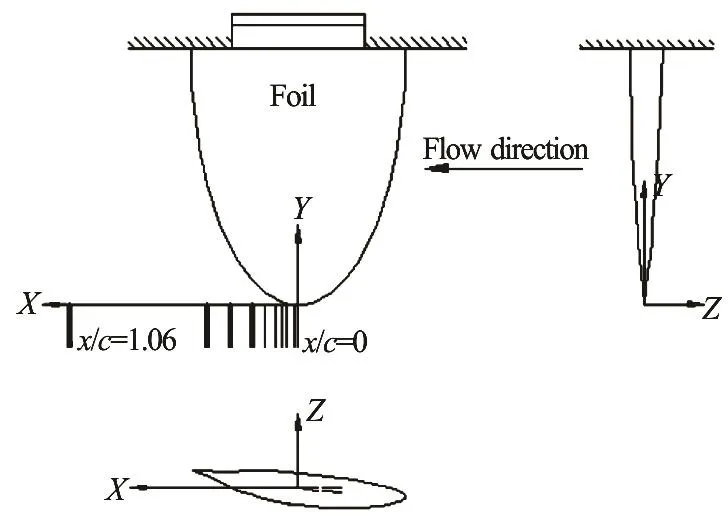
Fig.6 Coordinate system of the tests and the sketch of measurement positions

Fig.7 The trajectory of tip vortex cavitation at θ =7o

Fig.8 The trajectory and wandering of tip vortex core without cavitation at θ =7o
The test model was installed in the horizontal centre of test section while the suction surface of hydrofoil is on the bottom and the tip of the elliptic hydrofoil is in the centreline of test section. A mechanism was designed to support the model and adjust the attack angle of the hydrofoil with precisiono0.1.For study the effect of air content of water on TVC inception, the air content of water was measured by dissolved oxygen meter (Cole-Parmer polarographic of SN-05726-00), which was expressed as DO for the relative dissolved oxygen to the saturation case in this paper. The device was calibrated by two-point method, water saturated air with 100% saturation and fresh sodium sulfite solution with 0% saturation,before the experiment. A high-speed video (HSV) camera of type of Photron APX with resolution 2 048×2 048 pixels and 3 000 fps was set in the bottom of test section to visualize the inception and development of tip vortex cavitation, while a LED lamp as the source of light.
Two methods, LDV and SPIV, were used to measure the velocity distributions around the tip vortex. The LDV system is manufactured by TSI with a 2 W nominal laser (Innova 70c), beam splitter (model 9201), receiving optics (with focal length 1 139 mm),and detector (FSA 3500 and PDM 1000). The receiving optics is installed on the 3-D coordinate platform with regulation precision 0.02 mm. The wave length of the laser is 514.5 nm green light and 488.0 nm blue light. The accuracy of velocity measurement is 0.2%. The advantage of LDV is that it can get vortex flow field information very near the tip position. But LDV is difficult to obtain the information of whole section and the wandering of the vortex.So the SPIV method is also used in present study.

Fig.9 Velocity distributions around the vortex core for different positions along trajectory of tip vortex, measured by LDV at V0 =5 m/s , θ =7o
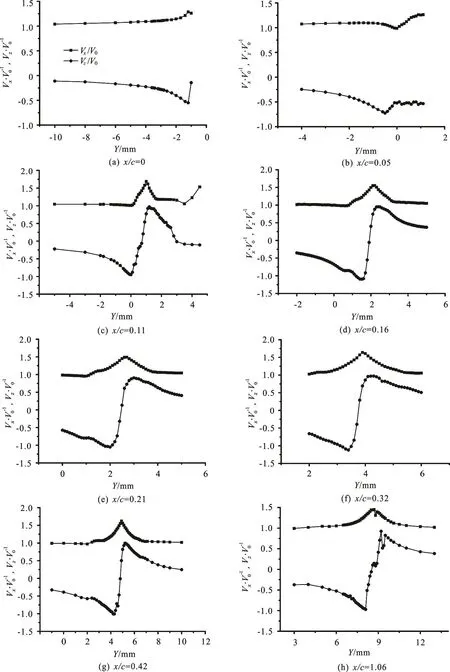
Fig.10 Velocity distributions around the vortex core for different positions along trajectory of tip vortex, measured by LDV at V0=13m/s , θ =7o
The stereo PIV system is used to measure the 3-D velocity field in cross-sections of the tip vortex. An approximate 2 mm wide laser sheet is generated by a double-pulsed YAG laser (solo 200XT, 200 mJ/pulse,and 532 nm wavelength) and a cylindrical lens from the bottom of test section. Image pairs are acquired using two CCD cameras (TSI 630159 4M) with a resolution of 2 048×2 048 pixels. The pixel size of the cameras is 7.4 μm. The cameras are mounted on both sides of the laser sheet with two water boxes ofo45 orientation. A 200×200 mm double-faced doted target(dots separated by 10 mm) is immersed in the test section and is imaged in several positions within the width of the laser sheet. During the measurement of SPIV 300 image pairs were captured in one measurement section for each test condition. The arrangements of the LDV and SPIV experiment were shown in Fig.3 and Fig.4 respectively.
3. Experimental results
3.1 Lift coefficient measurementThe lift of the test model was measured by a
threecomponent force/torque balance, of which the measuring range of lift, resistance and torque are 500 N,200 N and 40 Nm respectively, with the accuracy of 0.4%. The balance installed in support device with the function of attack angle adjustment, which mounted in the side window of the test section. As the suction side of hydrofoil faces to the bottom of test section, the direction of lift force points to vertically downward at a positive angle of attack. The result was shown in Fig.5. The lift coefficient is defined as

where L is the lift force measured by balance and A the surface area of test model. In the present study A=8.28× 1 0-3m2.
To avoid the elastic effect of balance, the balance was exchanged by a solid body in all other experiments including the flow field measurements and cavitation tests.
3.2 Trajectory and wandering of tip vortex core
To easy represent test results the coordinate system was shown first in Fig.6, where original point was set in the tip position, x in the direction of incoming flow, y toward the root of foil and z up to the pressure section of the foil. The measurement sections also showed in the Fig.6. The velocity distributions for ten sections, /=x c 0, 0.02, 0.04,0.07, 0.11, 0.16, 0.21, 0.32, 0.42, 1.06, were measured by LDV measurement, shown in short lines. Among these only four sections were measured by SPIV,x/ c = 0.21, 0.32, 0.42, 1.06, emphasized in thick lines in the figure.
Based on the observations of very weak tip vortex cavitation by HSV the trajectory of tip vortex core and its motion can be estimated, as shown in Fig.7. It showed that the trajectories of vortex tend to pressure suction and the root of hydrofoil. But the data in Fig.8 come from the measurement results by SPIV,which not only provide the mean position of vortex core but also indicated clearly the wandering of tip vortex. The average position of vortex center was obtained by identification from the mean flow field of 300 vector images for each measurement section. The motion characteristics of the vortex core were described both by standard deviation and extreme value in two directions in the Fig.7. The bar with long caps around vortex center represented the standard deviations of the vortex center position, while the bar short caps showed the extreme motion distance of the vortex center in each direction. The results demonstrated the offset trend of mean trajectory of tip vortex core was coincident with the observation of TVC by HSV. The magnitude of the wandering is different with different sections.
3.3 Velocity and vorticity distributions without cavitation
3.3.1 LDV results
The velocity distributions, Vxand Vz, along the y direction were measured by LDV in ten sections.Figures 9 and 10 showed the results of two incoming velocities as 5 m/s and 13 m/s respectively. Some characteristics of tip vortex formation and development can be seen from the measurement results. The distributions of circumferential velocity Vzbecome symmetric and showed nearly perfect vortex flow structure when x/ c greater than some value,x/ c ≥ 0 .07 for V0=5m/s and x/ c ≥ 0 .11 for V0=13m/s, it indicated that for different velocities the vortex formation distances were different. The formation distance of tip vortex will be increase with the increase of incoming velocity. The axis velocity Vxin the vortex core reached to maximum for nearly perfect tip vortex, but the feature of axis velocity during the formation of tip vortex was not clear.
It should be pointed out that due to the wandering of vortex core the LDV measurement only showed the average results in space position. The maximum circumferential velocity in present measurement may be lower comparing with the instantaneous circumferential velocity, but the effect on the size of vortex core was not so much.
3.3.2 SPIV results
SPIV system was used to measure the velocity distributions in four sections along the vortex trajectory with incoming velocity of 5 m/s, 7 m/s, 9 m/s, 11 m/s,and 13 m/s. Vorticity distributions were also obtained from the velocity distributions. The results of 5 m/s and 13 m/s were shown in Fig.11 and Fig.12 respectively.

Fig.11 (Color online) Flow field evolutions along the tip vortex trajectory measured by SPIV at V0 =5 m/s , θ =7o
The velocity diagram were shown in the left of the figures, where the resultant velocitywas the average of 300 measurement results in each section. It could be seen that the velocity in the vortex core was obviously lower than surroundings. From the measurement results of velocity distribution the vorticity was calculated as

It is clearly shown that the vorticities were almost concentrated around the vortex core. But due to the wandering of vortex core the most of concentrated vorticities were not perfect circle. In some cases the dispersion could be seen distinctly, such as in the section of x / c = 0.32, the analysis showed that in these situations the wandering of vortex were much stronger than other cases.

Fig.12 (Color online) Flow field evolutions along the tip vortex trajectory measured by SPIV at V0=13m/s , θ =7o
The effect of attack angle of hydrofoil also tested for some section and some incoming velocities. Figure 13 gave the results for the x/ c = 1.06 and V0=9 m/s with attack angle θ = 7o, 8o, 9o, 1 0o.
3.4 Radius of vortex core and circulation
From the measurement core radius, circulation as well as the turbulent kinetic energy around the vortex core were analyzed. But some gaps were found between the two different measurement methods.Among these three parameters there was only little difference for the circulation, and the turbulent kinetic energy was also in the same order of magnitudes.However the vortex core radius obtained by the SPIV was much larger than by the LDV method.Considering the difference of measurement accuracy and post-processing of the two methods, the results of LDV were presented here.

Fig.13 (Color online) Velocity and vorticity distributions around the vortex core measured by SPIV in x / c = 1.06 at V0=9 m/s
The turbulent kinetic energy obtained by LDV was computed by the formula

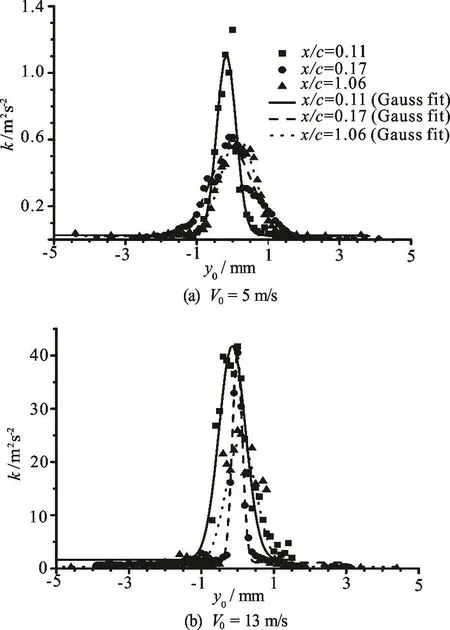
Fig.14 Turbulent kinetic energy distributions around the vortex core in different sections measured by LDV ( θ=7o)
where thexV′ andzV′ are mean square root velocity fluctuation in a space point. Figure 14 showed the results of turbulent kinetic energy along the y direction through the vortex center in some measurement sections for incoming velocity V0=5m/s and V0=13m/srespectively. From the results it could be seen that the turbulent kinetic energy demonstrated normal distribution and maximum value appeared at the center of vortex core for each section. The magnitudes of turbulent kinetic energy for every section were different. Moreover the magnitudes of turbulent kinetic energy were much larger in the high incoming velocity. Of course the effect of vortex wandering was included in the results.
Table 1 and Table 2 gave the vortex core radii(a), circulations around the vortex (Γ) and the turbulent kinetic energy (K ) in the vortex center in some measurement sections with incoming velocity V0=5m/s and V0=13m/s respectively. From the view of cavitation the position with smaller vortex core radium, larger circulation, as well as the stronger turbulent kinetic energy may easier to produce the cavitation.
3.5 Characteristics of TVC and its inception
HSV cam era was u sed to obse rve the TVCand its inceptionfordifferentcavitationnumbersunder theattack angle θ = 7owith the incoming velocity to be 5 m/s, 9 m/s, 13 m/s, 17 m/s and 21 m/s respectively.During the experiment the observation began with strong cavitation condition under low cavitation number. Then the cavitation number increased while the incoming velocity kept constant, until the cavitation disappeared. So a series of cavitation forms for different cavitation numbers, as well as the desinent cavitation number were obtained.
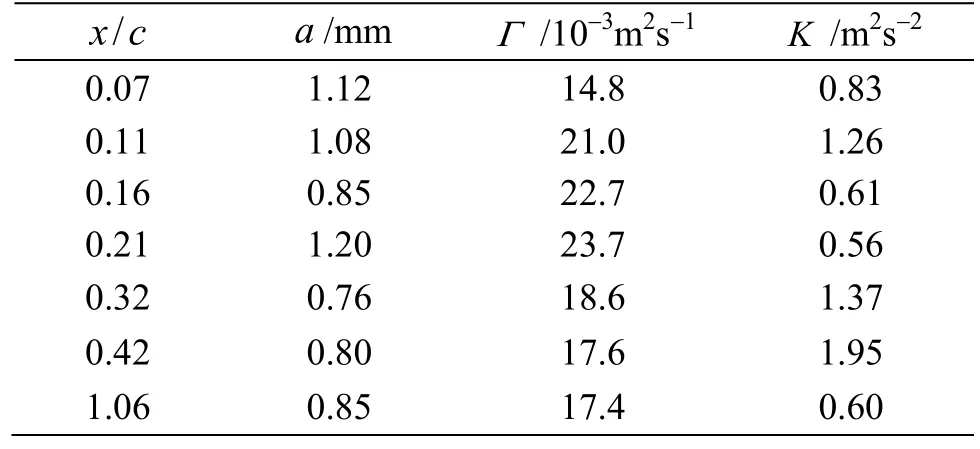
Table 1 Vortex core radii, circulations and turbulent kinetic energy different sections in V0 =5 m/s ,θ=7o

Table 2 Vortex core radii, circulations and turbulent kinetic energy different sections in V 0=13m/s , θ=7o
Figure 15 showed an example of cavitation forms under different cavitation numbers for V0=5m/s. In the lower cavitation number, the size of TVC is larger than the higher cavitation number and the form of TVC presented the apparent spiral. From the image analysis the vapor tube radii (Rc) of cavity was captured and the result with cavitation number was shown in Fig.16. It demonstrated that the cavity size mainly related to the cavitation number especially in the higher cavitation numbers. Some deviation in the lower cavitation number could be caused by the diffusion of air content of water to the cavity.
In fact tip vortex cavitation inception was strongly affected by the air content of water, especially in the low incoming velocity and higher air content of water.In present study the tests of TVC inception were carried out for different incoming velocities and different air contents in the case of attack angle θ = 7o. Same as normal way the desinent cavitation number was adopted to represent the inception number. Table 3 gave the measurement results of TVC inception number with three different air contents.It showed that the inception number was increased with the increase of air content in most of situations,especially in the case of low incoming velocity. But the effect of air content decreased with the increase of incoming velocity.

Fig.15 TVC forms for different cavitation numbers obtained by HSV in V0=13m/s , θ = 7o, DO=53%
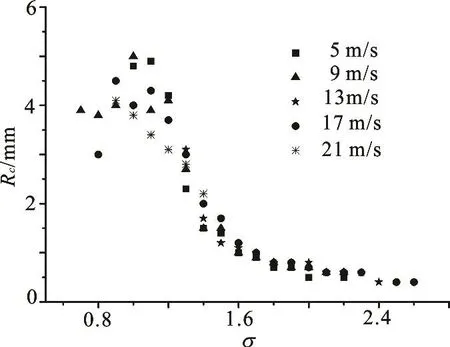
Fig.16 Cavity radii with cavitation numbers in V0=13m/s,θ= 7o , DO=53%

Table 3 Measurement results of TVC inception number for different air content and different incoming velocities, θ =7o
To investigate the relation between TVC inception and the average pressure of vortex center the measurement data of the vortex core radium and circulations, obtained in chapter 3.3, were used to calculate the vortex center pressure coefficients along the vortex trajectory. Burgers vortex model was adopted in the assessment, where the pressure coefficients of vortex core could be expressed as[3]

Table 4 showed the results and minimum pressure coefficient and its position could be clearly seen for the two different incoming velocities. The position of minimum pressure coefficient was around the /=x c 0.16, which was generally coincident comparing with the observation of cavitation inception, as the observation result shown in Fig.17. While comparing the absolute value of minimum pressure coefficient with the inception number in Table 3, it was very close in the case of high incoming velocity with low air content but very smaller than the value measured in low velocity and high air content. Considering the effect of air content the results signified that the measurement data of flow field were quite reasonable. The scale effect of air content should be paid a great attention in the prediction of TVC inception both for experiment and numerical simulation methods.
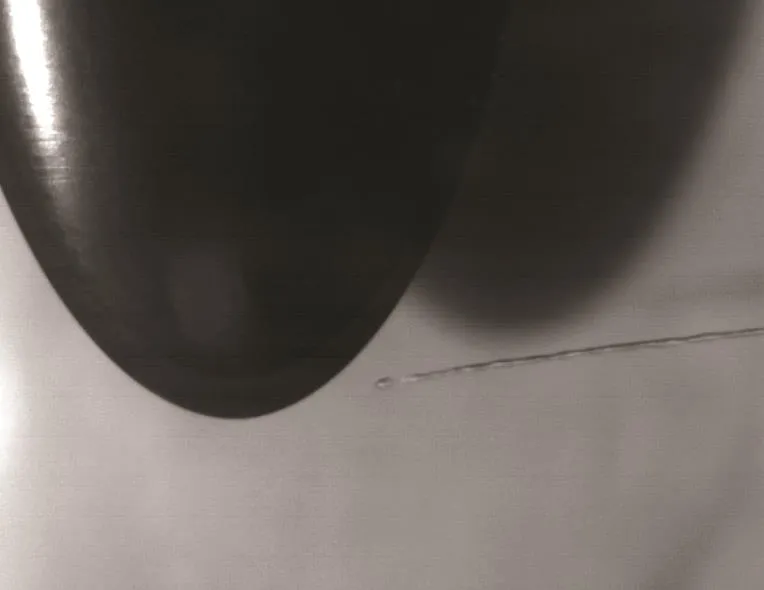
Fig.17 observation of TVC inception by HSV
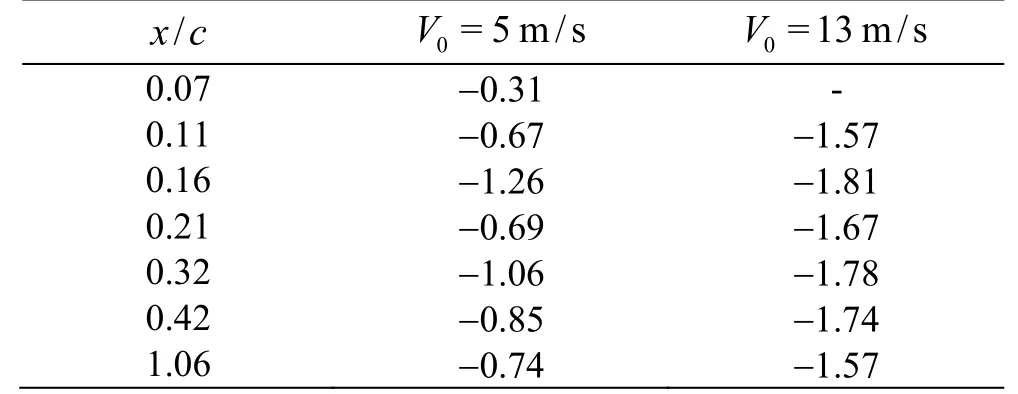
/x c 0=5 m/s V 0=13m/s V 0.07 -0.31 -0.11 -0.67 -1.57 0.16 -1.26 -1.81 0.21 -0.69 -1.67 0.32 -1.06 -1.78 0.42 -0.85 -1.74 1.06 -0.74 -1.57
3.6 Velocity and vorticity distributions around the TVC
SPIV measurement method of the flow field with cavitation was the same as that for cavitation free. The difficulty was the light reflection in the interface between vapor and water, which created shadows and local bright regions in the particle images. In the present study only few situations with weak and stable cavitation were measured. Figure 18 give the measurement results in two cases for the cavitation number 1.6 and 1.3, all in the section of x / c = 1.06,incoming velocity V0=5m/s , attack angle θ = 7o,and air content D O = 53%. The cavity was distinguished by distinct shadow from bright underside in the PIV image. Vectors inside the shadow were excluded from analysis shown as the white in the figure.
In Fig.18 the cavitation image obtained by HSV also presented for each case. Comparing with the measurement results without cavitation for the same position and the same incoming velocity shown in Fig.11, vortex flow also existed around the TVC and the vorticity concentrated in the surrounding of the TVC. Vorticity fluxes calculated by integrating the rangeofvorticityconcentration,say 10 times of vo rtex core,were 0.054m2/s,0.038 m2/s and 0.032 m2/sfor the case without cavitation, weak cavitation (σ =1.6)and stronger cavitation (σ = 1.3) respectively. It indicated that the cavitation should reduce the vorticity around the cavity.

Fig.18 (Color online) Velocity and vorticity distributions around TVC measured by SPIV in x/ c = 1.06 at V0=5m/s
4. Concluding remarks
LDV and SPIV were adopted to measure the tip vortex flow field both in the cases with and without cavitation. At the same time HSV camera was also used to observe the tip vortex cavitation. From the data processing a series of fundamental data of tip vortex flow and tip vortex cavitation were given in this paper, including the trajectory positions of tip vortex core, the vortex core radius, circulations and the turbulent kinetic energy around the vortex core in the case without cavitation, the velocity and vorticity distributions with and without cavitation, cavity sizes and cavitation inception numbers for different air contents. The main conclusions are as follows:
(1) The process of tip vortex formation is shown through the flow field measurement. The distance from the tip point to nearly perfect vortex flow structure was obtained, which is increasing with the increase of incoming velocity (Reynolds number).
(2) The radii of vortex core in different positions are given for two incoming velocities, which are deceasing with the increase of incoming velocity(Reynolds number).
(3) The inception of tip vortex cavitation often occurs in the position where the formation of tip vortex is not fully finished in our observation. Flow measurements show that the smaller vortex radii,larger circulation and stronger turbulent kinetic energy exist around the position.
(4) The TVC inception numbers are obtained for different air contents and different incoming velocities.The results show that the air content has a great effect on the cavitation inception of tip vortex, especially under low incoming velocity (Reynolds number).
(5) The vorticity measurement results with cavitation by SPIV indicate that the tip vortex cavitation can reduce the vorticities around the cavity comparing with the case without cavitation.
In addition, the minimum pressure coefficient in the vortex core, computed by flow field measurement results with vortex model, was quite coincident with the tip vortex cavitation inception number obtained under the condition of high incoming velocity and low air content. It demonstrates that the measurement accuracy of LDV in present study is acceptable. At the same time there are still some gaps for measurement results between the SPIV and LDV, the accuracy of the velocity and vorticity distributions obtained by SPIV may be not high enough. The measurement method should be improved to enhance the accuracy of SPIV in the future, especially in the tests with cavitation.
Acknowledgements
The authors would like to thank Prof. T. J. C. van Terwisga and Dr. P. C. Pennings from MARIN,Netherlands for providing the profile of test model used in this study and their experience in the measurement methods.
[1] Arndt R. E. A. Cavitation in vortical fl ows [J]. Annual Review of Fluid Mechanics, 2002, 34(1): 143-175.
[2] Zhang L. X., Zhang N., Peng X. X. et al. A review of studies of mechanism and prediction of tip vortex cavitation inception [J]. Journal of Hydrodynamics, 2015, 27(4):488-495.
[3] McCormock B. W. On cavitation produced by a vortex trailing from a lifting surface [J]. Journal of Basic Engineering, 1962, 84(3): 369-370.
[4] Franc J. P., Michel J. M. Fundamentals of cavitation [M].Rotterdam, The Netherlands: Fluwer Academic Publishers,2004.
[5] Batchelor G. K. Axial flow in trailing line vortices [J].Journal of Fluid Mechanics, 1964, 20: 645-658.
[6] Moore D. W., Saffman P. G. Axial flow in laminar trailing vortices [J]. Proceedinds of the Rocal Society of London,1973, 333(1595): 491-508
[7] Higuchi H., Quadrelli J., Farell C. Vortex roll-up from an elliptic wing at moderately low Reynolds numbers [J].AIAA Journal, 1987, 25(12): 1537-1542.
[8] Arndt R. E. A., Arakeri V., Higuchi H. Some observations of tip-vortex cavitation [J]. Journal of Fluid Mechanics,1991, 229: 269-289.
[9] Fruman D. H., Pugue C., Pauchet A. et al. Tip vortex roll-up and cavitation [C]. Proceedings of the 19th International Symposium On Naval Hydrodynamics. Seoul,Korea, 1992.
[10] Boulon O., Callenaere M., Franc J. et al. An experimental insight into the effect of confinement on tip vortex cavitation of an elliptical hydrofoil [J]. Journal of Fluid Mechanics, 1999, 390: 1-23.
[11] Chesnakas C. J., Jessup S. D. Propeller tip vortex measurements using a 3-component LDA [C]. Proceedings of the 22nd Symposium Naval Hydrodynamics. Washington DC,USA, 1998.
[12] Felli M., Roberto C., Guj G. Experimental analysis of the flow field around a propeller-rudder configuration [J].Experiments in Fluids, 2009, 46(1): 147-164.
[13] Felli M., Falchi M. Propeller tip and hub vortex dynamics in the interaction with a rudder [J]. Experiments in Fluids,2011, 51(5): 1385-1402.
[14] Felli M., Camussi R., Di Felice F. Mechanisms of evolution of the propeller wake in the transition and far fields[J]. Journal of Fluid Mechanics, 2011, 682: 5-53.
[15] Pino C., Parras L., Felli M. et al. Structure of trailing vortices: Comparison between particle image velocimetry measurements and theoretical models [J]. Physics of Fluids, 2011, 23(1): 013602.
[16] Chang N., Ganesh H., Yakushiji R. et al. Tip vortex cavitation suppression by active mass injection [J]. Journal of Fluids Engineering, 2011, 133(11): 111301.
[17] Dreyer M., Decaix J., Münch-Alligné C. et al. Mind the gap: A new insight into the tip leakage vortex using stereo-PIV [J]. Experiments in Fluids, 2014, 55(11): 1-13.
[18] Pennings P. C., Westerweel J., van Terwisga T. J. C. Flow field measurement around vortex cavitation [J]. Experiments in Fluids, 2015, 56(11): 206.
[19] Choi C. L., Chahine G. L. A numerical study on the bubble noise and the tip vortex cavitation inception [C]. 8th International Conference on Mumerical Ship Hydrodynamics. Busan, Korea, 2003.
[20] Choi C. L., Hsiao C. T., Chahine G. L. Tip vortex cavitation inception study usng the surface averaged pressure(SAP) model cobined with a bubble splitting model [C].25th Symposium on Naval Hydrodynamics. St. John’s,Canada, 2004.
[21] Long Y., Long X. P., Jin B. Verification and validation of URANS simulation of turbulent cavitating flow around the hydrofoil [J]. Journal of Hydrodynamics, 2017, 29(4):610-620.
杂志排行
水动力学研究与进展 B辑的其它文章
- Bubbly shock propagation as a mechanism of shedding in separated cavitating flows *
- A sharp interface approach for cavitation modeling using volume-of-fluid and ghost-fluid methods *
- On the numerical simulations of vortical cavitating flows around various hydrofoils *
- The effect of water quality on tip vortex cavitation inception *
- Novel scaling law for estimating propeller tip vortex cavitation noise from model experiment *
- Simulation of cavitation induced by water hammer *
