Novel scaling law for estimating propeller tip vortex cavitation noise from model experiment *
2017-03-14JisooParkWoojaeSeong
Jisoo Park, Woojae Seong
Department of Naval Architecture and Ocean Engineering, Seoul National University, Seoul, Korea, E-mail: online1616@snu.ac.kr
Introduction
Since tip vortex cavitation (TVC), usually the earliest type of cavitation to appear on a marine propeller, is related to cavitation inception speed (CIS)and underwater radiated noise (URN), the physical understanding of TVC is critically important in designing a propeller. In terms of URN, TVC noise is considered to be the most significant source of marine propeller noise because it occurs the earliest among other types of cavitation and significantly influences the noise spectrum over a broad frequency range[1].
Because of the complex flow and noise field around a marine propeller, a theoretical approach to TVC noise estimation is practically unrealizable. Thus,estimation of prototype noise level is realized through extrapolation of the model-scale measurement made in a cavitation tunnel. For this purpose, some scaling laws on cavitation noise have been suggested, which have been applied in many studies.
Levkovskii[2]initially proposed the cavitation noise scaling law, assuming cavitation as a single bubble. The derivation of the cavitation noise scaling law started from the fact that the ratio of radiated acoustic power to potential power of a single bubble is constant, which was based on experimental results.However, this scaling law could not be applied to the cavitation noise generated by a 3-D lifting surface since propeller parameters and boundary layer effect are not taken into account. For the cavitation attached to a propeller blade surface, such as sheet cavitation,the scaling law for propeller cavitation noise is well established by the ITTC noise estimation rule[3]. This scaling law has been applied to predict propeller cavitation noise from model tests in two studies[4,5]. In these studies, it was shown that the ITTC noise estimation rule had good agreement with the measured prototype cavitation noise level in the case of sheet cavitation developed on the blade surface.
It is known that TVC development is significantly affected by the boundary layer and propeller loading[6]. However, since the ITTC noise estimation rule does not include these effects properly, it would be inadequate to apply the ITTC noise estimation rule to cavitation occurring continuously at a distance from the propeller such as TVC. Latorre[7]measured the fully developed TVC noise of scaled hydrofoils and applied the cavitation noise scaling method of Bojorheden and Astrom[8]and the Levkovskii method[2]. Oshima[9]modified the ITTC noise estimation rule to incorporate the boundary layer effect using the Reynolds number, which significantly affects TVC occurrence. Prototype power spectral density (PSD)estimated with the modified ITTC noise estimation rule was compared with measured prototype PSD for verification. In this study, the scaling exponent determined from model and prototype experiments was 0.150, quite different from other experimental results(summarized in Shen et al.[10]). More importantly, the estimated prototype PSD did not match well with the measured data in the high frequency range above 6 kHz-7 kHz. From these analyses, it is ambiguous as to whether the model or prototype experiments are incorrect or the modified ITTC noise estimation rule gives incorrect estimation result. Since model and prototype experiments were conducted based on the visual inspection of TVC using an observation window (the method considered accurate), it could be considered that the experiments were performed correctly. Thus, it would be reasonable to re-examine the modified ITTC noise estimation rule that reflects only the boundary layer effect and suggest that such a treatment may be inadequate and incomplete.
To overcome this limitation of considering the boundary layer effect in applying the ITTC noise estimation rule for TVC noise, the scaling law for TVC noise is newly derived using the Rayleigh-Plesset equation, the Rankine vortex model, the lifting surface theory, and extra assumptions based on the physics of TVC, which will be detailed in Section 2.This will provide the broadband noise scaling law considering the hydro-acoustic basis of TVC. In Section 3, model-scale data are extrapolated with the modified ITTC noise estimation rule as well as the novel scaling law deduced in Section 2, and these two sets of extrapolated results are compared with the prototype measurements for verification. The causes of errors are also analyzed. Finally, the conclusions are provided in Section 4.
1. Derivation of the scaling law for TVC noise
TVC is a small bubble flume generated in the vortex core center and noise is emitted from the bubble growth, elongation, and collapse. Since it is impossible to consider the noise of each bubble when deriving the scaling law, derivation of the scaling law for TVC starts with consideration of the total power of the bubble flume as a whole. In addition, TVC results from nuclei that enter into a vortex trailing from the tip caused by crossover of fluid from the high pressure side to the low pressure side of the propeller. Therefore, to study this physical phenomenon it is necessary to bring all factors into play that underlying the physical basis of TVC, such as the bubble dynamics(Rayleigh-Plesset equation), vortex model (Rankine vortex model), the lifting surface theory, and the number of bubbles generated per unit time when deriving the scaling law for TVC noise. Since the novel scaling law derived in this study is generally based on Rayleigh-Plesset equation and the formulation for elongation of TVC is the same as that for initial radial growth of TVC (which can be identified in Arndt[11]), it can be normally applied to TVC noise estimation regardless of TVC development stage except for very long TVC.
1.1 Rayleigh-Plesset equation
The Rayleigh-Plesset equation, commonly used to describe the growth and collapse history of a bubble,is given for the bubble radius R in relation to time[12]as follows

where ρ denotes the density of fresh water, R radial displacement of bubble, R˙ radial velocity of bubble, R˙ radial acceleration of bubble,vp vapor pressure, p∞ambient pressure at infinity,0gp partial pressure of gas at the initial state, γ the ratio of the specific heat at constant pressure to that at constant volume,0R equilibrium radius, A surface tension force of bubble wall, and μ dynamic viscosity. As secondary terms such as gas pressure,surface tension, and viscosity can be ignored, the Rayleigh-Plesset equation can be simplified as follows

The above equation is integrated from initial time t = 0 to arbitrary time t and bubble wall velocity is expressed as
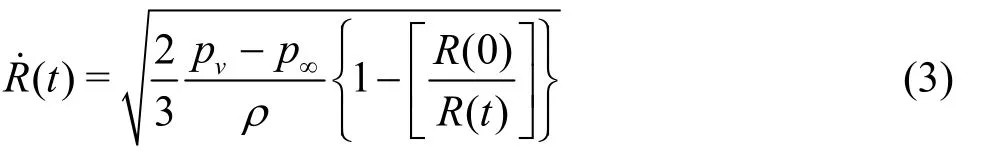
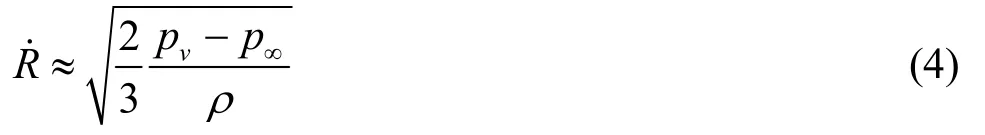
In the growth stage of a bubble, R ( 0)/R( t) is assumed to be zero except at the initial instant (t = 0).Thus, the bubble growth velocity becomes constant after the initial stage, that is
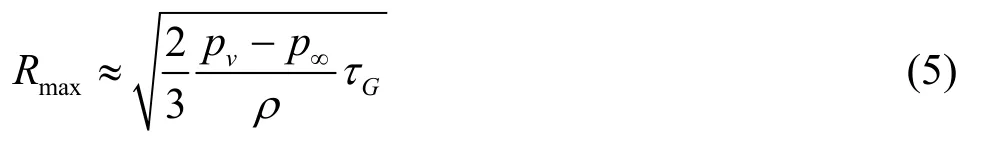
Denoting the time for the bubble to grow to its maximum size as τG, the maximum bubble radius,Rmaxbecomes
1.2 Rankine vortex model
TVC generally forms at the center of the vortex flow generated by the tip of a 3-D lifting surface. One of the simplest models that explains this vortex flow structure generated at the tip of a 3-D lifting surface is the Rankine vortex model[13]. In this model, the vortex flow is separated into two domains: the inside and outside of the core.
1.2.1 Core inner region (r ≤ac)
In the inner core region, vorticity is assumed to be constant and the viscous effect becomes dominant.The flow inside the core (r <ac) is considered as the rotational motion of a solid body. At distance r from the core’s center axis, tangential velocity, Vtis expressed as follows
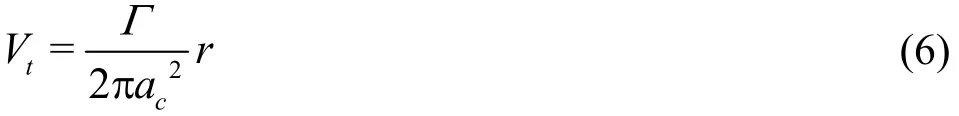
where Γ denotes circulation andca vortex core radius. Since the inner region of the vortex flow is rotational and viscous, Bernoulli’s equation cannot be applied. Euler’s equation for steady flow becomes
Pressure co-relation between the core center (r = 0,subscript 1) and core radius (r = ac, subscript 2) is derived from Euler’s equation as

Here, tangential velocity at the core center is zero(V1=0) since on the core axis the flow is considered irrotational.
1.2.2 Core outer region (r >ac)
In the outer core region, the flow is irrotational and inviscid. In this potential region (r >ac),tangential velocity is found from the circulation conservation (r Vt=constant) as follows
The pressure relation between the core radius (r = ac,subscript 2) and infinity (subscript ∞) is derived from Bernoulli’s equation for irrotational flow as follows
Here,tV at infinity is zero ( =0)V∞since r is very large compared withca. From Eq.(8) and Eq.(10), the minimum pressure at the vortex core center is

From this relation, it is evident that the minimum pressure is formed at the vortex core center ( =0R ,subscript 1), which makes it plausible that the vortex cavitation is developed at the vortex core center.
1.3 Rearrangement of variables to incorporate prope- ller parameters in the scaling law
For the bubble collapse situation, (0)R in Eq.(3)is simply replaced withmaxR to produce
The reciprocal of Eq.(12) gives the radius-time relationship, which is integrated over the interval Rmax≤R≤0 giving the time for complete collapse,τCas follows[12]
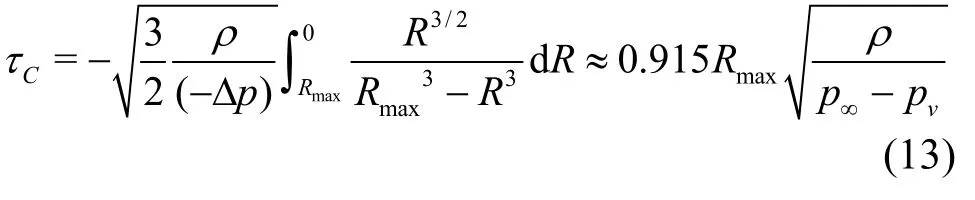
where Δp denotes difference between vortex core center pressure and vapor pressure. The frequency of noise radiated from a single bubble collapse, f is inversely proportional to the bubble collapse time( f α1/τc). Thus, the frequency scaling law becomes Subscripts s and m denote prototype and model,respectively. For radiated sound pressure ( p ′), the assumption of a constant ratio of radiated sound power ( Prad=4 π r2( p ′2)/(ρ0c0))to bubble potential power ( Ppot=(4 π Rmax

3( p ′2)/3)Δ p N0) is adopted[2,8],that is
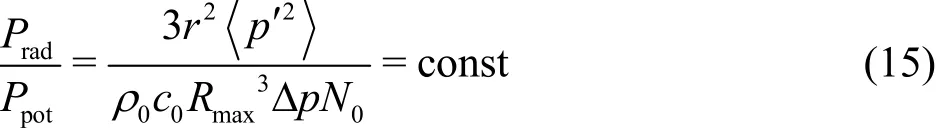
where0c denotes sound speed. Thus, the above equation can be rearranged into a scaling form for radiated sound pressure as
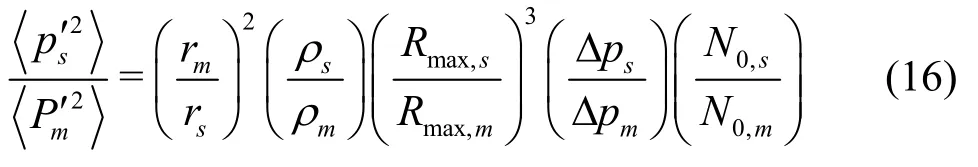
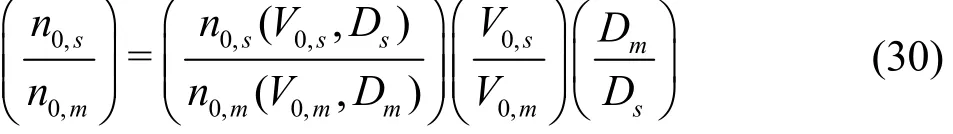
The scaling laws, Eqs.(14) and (16), reveal that the ratio of maximum bubble radius ( Rmax,sRmax,m)and the ratio of the number of cavitation bubbles gene- rated per unit time ( N0,s/N0,m) need to be found in order to predict the radiated noise of the prototype from the model experiment.
1.4 Ratio of maximum bubble radius in the model and prototype
When applying the Rayleigh-Plesset equation(Eq.(1)) to real life situations, the driving pressure p∞is regarded as ambient pressure at the center of the bubble rather than the pressure at infinity[13]. In the case of TVC, the pressure at the bubble center is the minimum pressure in the vortex ( p∞= pmin= p1).Thus, the ratio of maximum bubble radius in the model and the prototype can be rearranged from Eq.(5)as follows
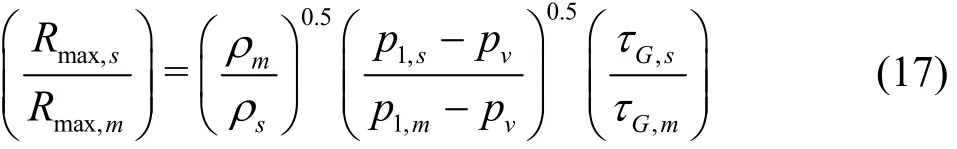
Here, the term ( p1,s- pv) /( p1,m- pv) can be expressed in terms of propeller and flow parameters using the Rankine vortex model. The ratio of difference between vortex core center pressure and vapor pressure in the model and the prototype can be arranged as follows using Eq.(11).

In the case of TVC, determination of noise measurement conditions is based on the relationship between cavitation numbers and the Reynolds numbers ( σ /σ =(R e/R e)k) to keep the geometri
n,s n,m s m cal similarity of the TVC pattern in the model and the prototype. Thus, the ratio of difference between the static pressure in the cavitation tunnel and the vapor pressure in the model and the prototype can be arranged as follows:

where σndenotes cavitation number defined in terms of propeller rotational speed and V0inflow speed. Since the circulation scales as Γs/Γm=(cs/cm) (V0,s/V0,m) = λ (V0,s/V0,m), where c denotes chord length, and the vortex core radius scales as a /a = δ / δ = (R e/R e)0.5k/λ[10], where δ
c,mc,smssm
denotes boundary layer thickness and λ scale ratio,the ratio of dynamic pressure of the tip vortex in the model and that in the prototype can be arranged as follows

Substituting Eq.(19) and Eq.(20) into Eq.(18)yields

Next, to obtain an expression for the ratio of growth time in the model and the prototype τG,s/τG,m,the position vector of TVC, p is approximated as follows
where D denotes propeller diameter, n propeller rotational speed and U ship speed. The total length of TVC progression during growth time can be found from
Fig.1 (Color online) Experimental setup for noise measurement and observation for the same TVC pattern of the model and the prototype. The position of a bubble reaching the maximum radius is at the same azimuth ()θ as from top dead center (TDC) in the model and the prototype
From Fig.1, we know that the position of a bubble reaching the maximum radius is at the same azimuth ()θ as it is from top dead center (TDC) in the model and in the prototype. Hence, the ratio of length of TVC progression during growth time in the model and the prototype,GL is as follows
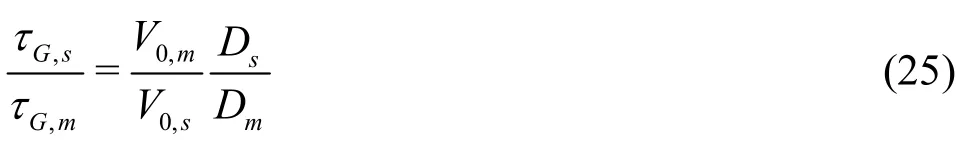
According to Eq.(23) and Eq.(24), the ratio of growth time in the model and the prototype is as follows Substituting Eq.(21) and Eq.(25) into Eq.(17), the ratio of maximum bubble radius in the model and prototype is arranged as

This is different from the existing assumption that maximum bubble radius only depends on the propeller diameter ( Rmax~D), whic h is simply dete rmine d by dimensionalanalysis.Thisassumptionhasbeencommonly used in applying cavitation noise scaling laws[2,3,9,14]. However, in the case of TVC, the maximum bubble radius depends not only on propeller diameter, but also on the Reynolds number, as indicated in the newly developed Eq.(26). An increase of the Reynolds number indicates a decrease of the boundary layer thickness, which reduces the vortex core radius. When the vortex core radius is reduced,the minimum pressure in the vortex core center is lowered, and the bubble reaches a larger maximum radius. Hence, the proportional dependence of the Reynolds number on the maximum bubble radius is reasonable in reflection of the physics of TVC.
1.5 Ratio of number of cavitation bubbles generated per unit time in the model and prototype
The number of cavitation bubbles generated per unit time0( )N is difficult to assess analytically or numerically. There are not many experimental results on0N because scaling effects such as the influence of Reynolds number and roughness of the blade surface have a large impact on the onset of cavities[8].
Until now, it has been assumed in deriving the cavitation noise scaling law that0N is only proportional to the number of propeller revolutions. In the case of TVC, a cavity is generated around TDC where the angle of attack is high and this cavity progresses downward from the propeller tip, making a successive spiral cavity line. It can be assumed that the number of nuclei flowing into the vortex line is proportional to the number of nuclei dissolved in the liquid per unit volume. Furthermore, similitude of the spectra of nuclei[13]for inflow speed and propeller diameter should be applied to assume the same nuclei distribution in the tip vortex line of the two geometrically scaled experiments. Inflow speed is defined as Advance ratio, J is defined as
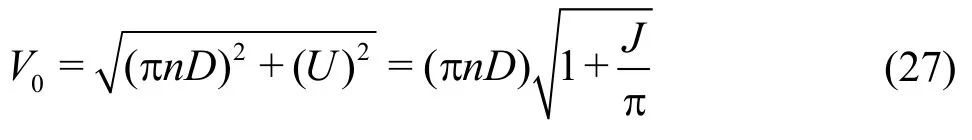

From Eq.(27), the ratio of inflow velocity in the model and the prototype is rearranged as
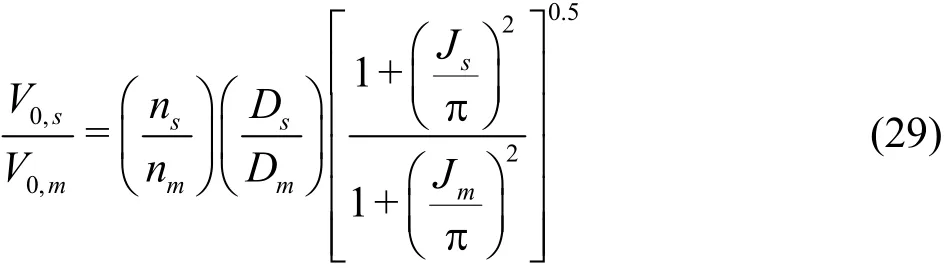
Here, propeller rotational speed is higher in the model than the prototype by approximately the magnitude of scale ratio (λ= Ds/Dm)to make the Reynolds number of the model as close to the Reynolds number of the prototype as possible. Furthermore, the advance ratio of the model and that of the prototype is assumed to be equal (Js= Jm) to keep dynamic similarity between the model and the prototype. From these aspects, it can be judged that the ratio of inflow velocity in the model to that of the prototype is almost 1 and thus adjustment of nuclei spectrum for propeller diameter solely needs to be applied. The cumulative spectra of nuclei are shifted in the vertical direction with a ratio (Ds/Dm)2-kin the case of TVC[15],where kdenotes scaling exponent. This adjustment is made to equalize the number of bubbles passing through the unit cross-sectional area in the vortex line of the model to that of prototype propeller. Here,nuclei sizes are not considered. Hence, the number of nuclei flowing into the vortex line ( n0( V0, D)) is proportional to the number of nuclei dissolved in the liquid per unit volume ( n0) and is a function of inflow velocity and propeller diameter (f( V0, D)) which corresponds to the adjustment of nuclei spectrum.
If the prototype experiment were performed in
lineshowninFig.2 (borrowed from),which corresponds to the cumulative nuclei spectrum of the prototype experiment performed in fresh water.The cumulative nuclei spectrum of prototype is the solid red line in Fig.2, which equates to the reference line multiplied by 10 since the prototype experiment is performed in sea water and the number of nuclei in
sea water is approximately 10 timesthe number of
nuclei in fresh water for most.There are some
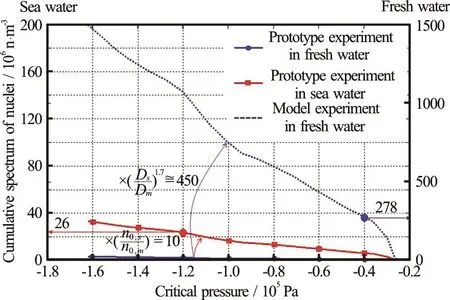
Fig.2 (Co lor onl ine) Adjustment of the cumulative spectrum ofnuclei with changi ng exp erimental c ond itions . If the pro totypeexperimentw ere pe rformed inf resh water,therefer enc e line wouldbe theci rcledblue lineco rrespondin gtothe cum ulativenu cle ispec trumof the prototypeex perime ntperformedinfreshwater.Thecumul ative nuclei sp ectru m of the proto type is the s quared redline,whichisthereferen ce linemu ltip lied by 10.The adjuste d cum ulative nucle isp ectrumof the mod el experimentisthedotted bluelineresultingfromthereference line multiplied by ( λ 2-k)
techniques formeasuring nuclei distribution in aliquid,suchasan acousticbubble .However, nuclei spectrum measurement requires special equipment which was not available during the present model and prototype experiments. Therefore,the cumulative nuclei spectrum of the prototype is chosen as the reference line multiplied by 10,following Kamiirisa’s experimental result[16]. The adjusted cumulative nuclei spectrum of the model experiment is the dotted blue line in Fig.2, resulting from the reference line multiplied by ( Ds/Dm)2-kwhich is applied to assume that the number of bubbles passing through the tip vortex line of the model experiment is the same as prototype experiment. It is difficult to ascertain the vortex core center pressure in the model or the prototype precisely. However, the ratio of the vortex core center pressure between the model and the prototype can be calculated from Eq.(21) as 2.9. Therefore, if the vortex core center pressure of the model experiment is -0.4×10⁵Pa, it can be calculated from Eq.(21) that the vortex core center pressure of the prototype experiment is-1.2×10⁵Pa. Finally, the ratio of the number of nuclei flowing into the vortex line that is required to keep the same nuclei distribution in the model and theis determined to be 10.7 from Fig.2. This value is used in estimating the prototype PSD. The number of bubbles formed in the vortex line per unit time is inversely proportional to characteristic time (Eq.(25)).Growth time (τG) is the characteristic time in this system. Therefore, in TVC, the value of0( )N scales as follows
1.6 Final rearrangement of the scaling law in TVC
1.6.1 Frequency scaling
Inserting Eq.(26) into Eq.(14), frequency scales as follows
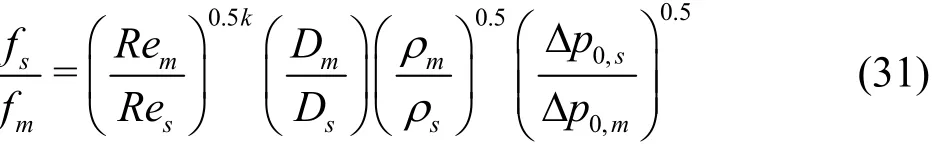
To factor in the effect of the cavitation number difference in the model and prototype of the same TVC shape, Eq.(31) is rearranged as follows
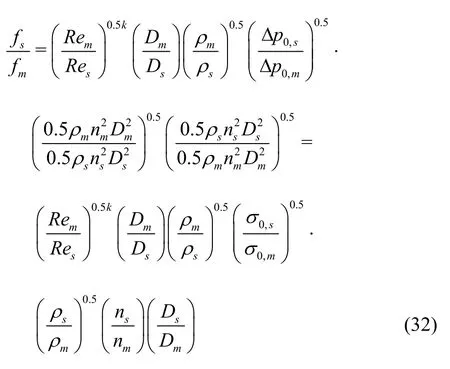
Because of the dependence of the cavitation number on the Reynolds number (), the final form of frequency scaling is as follows
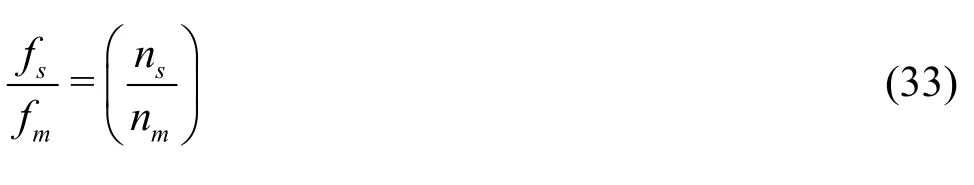
This is consistent with the concept of blade passage frequency (BPF=)Bn× for the same number of blades in the model and the prototype, where B denotes number of propeller blades.
1.6.2 PSD scaling
Substituting Eq.(26) and Eq.(30) into Eq.(16),acoustic intensity scales as follows

Here, it is assumed that water density ()ρ and sound speed0()c are same in both the model and the prototype experiment. Thus, water density and sound speed terms cancel out one another. As is done in the frequency scaling case, taking into consideration the effect of the cavitation number difference and the dependence of the cavitation number on the Reynolds number, Eq.(34) can be rearranged as follows
Since PSD, G scales as

where fΔ denotes frequency bandwidth. Equation(33) and Eq.(35) can be combined to finally arrive at the PSD scaling formula as follows

2. Application and discussions
In order to estimate the prototype PSD from the measured model data, a model scale experiment was performed in Samsung Ship Model Basin (SSMB)cavitation tunnel. To keep every variable but the cavitation number constant in the model experiment and to maintain the same thrust coefficient (kT) as the prototype in order to maintain dynamic similarity between the model and the prototype, the ambient pressure in the cavitation tunnel was adjusted. Sound pressures were measured using a flush-mounted hydrophone array on the hull above the propeller in the model and the prototype. The scaling exponent was determined from the cavitation numbers and the Reynoldsnumbersof the model and prototype experi-ments as
The incipient cavitation number of the model and prototype was determined acoustically. Cavitation started to develop in the prototype at a higher cavitation number compared to that which was observed in the model experiment. Here, CIS in the prototype is 8.8 kts, determined with the acoustical signal processing technique. The TVC pattern at 8.8 kts of the prototype speed condition is most similar to the TVC pattern at the prototype 16 kts of the model speed condition. Thus, the model PSD at the prototype(16 kts speed condition) is used to estimate the prototype PSD at 8.8 kts for the validation of the scaling law derived in this study in comparison with the modified ITTC noise estimation rule. This observation is consistent with the fact that cavitation number for the same TVC shape in the model and the prototype is different. Therefore, to correct this disparity for the same TVC shape, a scaling exponent determined using this method is used to derive the estimate of the prototype PSD from the model PSD.The experimental details of the model and the prototype noise measurement are given in Ref.[18].
The ITTC noise estimation rule can also be used to estimate prototype PSD if the cavitation number difference for The same TVC shape in the model and the prototype is reflected in the ITTC noise estimation rule through a scaling exponent[9]. For reference and clarity, the scaling laws for the modified ITTC noise estimation rule with viscous correction are given below.
For frequency[9]

For PSD[9]

Prototype PSD estimated with the modified ITTC noise estimation rule with viscous correction is compared with the results estimated with the scaling law based on the physics of TVC.

Table 1 Various ratios of propeller parameters
Various ratios of propeller parameters are required to estimate the prototype PSD, as shown in Table 1. Model PSD is obtained through Welch’s method[19]and PSD levels are extracted using one third-octave band analysis.
The results are shown in Fig.3. The solid line represents the measured prototype PSD, the squared line represents the estimated prototype PSD using the modified ITTC noise estimation rule with viscous correction (Eq.(39) and Eq.(40)), and the circled line represents the estimated prototype PSD with the scaling law derived in this paper (Eq.(33) and Eq.(37)).One interval in the vertical axis indicates 10 dB/Hz.Since the TVC noise is dominant in the frequency range around 1 kHz, it is necessary to compare the estimates in that range. In the frequency range from 0.5 kHz to 2.0 kHz, the novel scaling law-estimated PSD has a higher value than the prototype PSD. In the case of the model, the experiment is conducted in a cavitation tunnel. The geometry of the cavitation tunnel test sections typically leads to echoes and reverberation, and the tunnel’s prime mover, flowcontrol, and manipulation elements (turning vanes,flow straighteners, etc.) may unintentionally produce background noise at the same time[20]. On the other hand, the experiment for the prototype is conducted in the sea, where there is no background noise caused by echoes or reverberation. Therefore, it is plausible for PSD estimated from the model experiment conducted within the environment of a cavitation tunnel to be above the prototype PSD which is measured in an open environment. If the effect of the reverberant environment of a cavitation tunnel can be quantified more precisely, it should be possible to estimate the prototype PSD more precisely, reducing differences in the model and prototype experiments.
Fig.3 (Color online) Estimated prototype PSD using both the modified ITTC noise estimation rule with viscous correction (squared line) and the derived novel scaling law law (circled line) along with the measured prototype PSD(solid line). One interval in the vertical axis indicates 10 dB/Hz
Furthermore, since occurrence positions of the model and the prototype TVC do not perfectly coincide in a low axial velocity region of the wake field, the ratio of propagation distance in the model and the prototype will not be exactly proportional to the scale ratio. Thus, if there is a 15%± error in the ratio of the distance from the cavitation source to the receiver in the model and the prototype, the estimated prototype PSD might carry an error ranging from-1.4 dB to 1.2 dB.
In this study, it is assumed that0N is proportional to inflow velocity and inversely proportional to propeller diameter, as shown in Eq.(30). However,this assumption may be incorrect due to the random process of cavitation inception. Therefore, the dependence of0N on inflow velocity and propeller diameter is to be verified through well-designed experiments in which control variables such as propeller parameters and environmental factors and nuclei distribution are properly maintained.
3. Conclusions
The modified ITTC noise estimation rule is used to extrapolate the prototype TVC noise from the model test data, employing viscous correction to account for the dependence of cavitation number on the Reynolds number. However, the viscous correction has no physical basis on facets of TVC such as the geometry of the inflow to the propeller tip and the vortex structure. In this study, the scaling law for propeller TVC noise is derived from much more physically sound hydrodynamics.
The prototype PSD is extrapolated from the model data separately using the modified ITTC noise estimation rule with viscous correction and using the scaling law presented in this paper. The extrapolated results obtained using the novel scaling law show better agreement with the measured prototype PSD than the extrapolated results obtained using the modified ITTC noise estimation rule with viscous correction. In the vicinity of the TVC frequency region,extrapolated results tend to show a higher level of PSD than measured prototype PSD. This can be attributed to the fact that the model experiment is carried out in a more reverberant environment than the TVC conditions of the prototype. It is necessary to quantify the effects of the cavitation tunnel on noise levels, taking into account the detailed tunnel specificaions such as the geometry, material, and instruments in the tunnel and the source properties of the TVC.
TVC is a complex physical phenomenon, so it is difficult to verify the structure of TVC through numerical or experimental methods. The novel scaling law derived in this paper suggests the possibility of verification for the physical phenomenon of TVC, since it provides improved accuracy in the estimation of prototype PSD.
Acknowledgements
This work was supported by Samsung Heavy Industries (SHI). The model experiment was carried out in Samsung Ship Model Basin and the prototype data was provided by SHI.
[1] Strasberg M. Propeller cavitation noise after 35 years of study [C]. ASME Symposium on Noise and Fluids Engi- neering. Atlanta, USA, 1977.
[2] Levkovskii V. L. Modeling of cavitation noise [J]. Soviet Physics Acoustics, 1968, 13(1): 337-339.
[3] Alexandrov K., Bovis A. G., Huang T. T. ITTC Cavitation Committee Report [C]. 18th International Towing Tank Conference. Kobe, Japan, 1987, 183-190.
[4] Bark G. Prediction of propeller cavitation noise from model tests and its comparison with full scale data [J].Journal of Fluids Engineering,1985, 107(1): 112-119.
[5] Atlar M., Takinaci A. C., Korkut E. et al. Cavitation tunnel tests for propeller noise of a FRV and comparisons with full-scale measurements [C]. 4th International Symposium on Cavitation. Pasedena, USA, 2001.
[6] Mccormick B. W. On cavitation produced by a vortex trailing from a lifting surface [J]. Journal of Basic Engineering, 1962, 84(3): 369-379.
[7] Latorre R. TVC noise envelope - an approach to tip vortex cavitation noise scaling [J]. Journal of Ship Research,1982,26(1): 65-75.
[8] Bjorheden O., Astrom L. Prediction of propeller noise spectra [C]. Detnorske Veritas Symposium on Hydrodyna- mics of Ship and Offshore Propulsion Systems. Oslo,Norway, 1977.
[9] Oshima A. A. Study on correlation of vortex cavitation noise of propeller measured in model experiments and full scale [J]. J. the Society of Nav. Architects of Jpn.,1990,168: 89-96.
[10] Shen Y. T., Gowing S., Jessup S. Tip vortex cavitation inception scaling for high Reynolds number application [J]. Journal of Fluids Engineering, 2009, 131(7): 1301-1306.
[11] Arndt R. E. A. Nucleation and bubble dynamics in vortical flows [J]. Journal of Fluids Engineering, 2000,122(3): 488-493.
[12] Blake W. K. Mechanics of flow-induced sound and vibration [M]. Orlando, USA: Academic Press, 1986, 370-396.
[13] Lecoffre Y. Cavitation-bubble trackers [M]. Leiden, The Netherlands: Balkema, 1999, 76-114,154-158.
[14] Lee S., Seo J. Cavitation tunnel test for propeller-induced noise and its comparison with full-scale measurements [C].15th International Congress on Sound and Vibration.Daejeon, Korea, 2008.
[15] Park J., Park C., Choo Y. et al. Experimental study of scale effects on the scaling law for tip vortex cavitation noise[C]. 4th Joint US-European Fluids Engineering Division Summer Meeting. Chicago, USA, 2014.
[16] Kamiirisa H. The effects of water quality characteristics on cavitation noise [C]. 4th International Symposium on Cavitation. Pasadena, USA, 2001.
[17] Wu X., Wendel M., Chahine G. et al. Gas bubble size measurements in liquid mercury using an acoustic spectrometer [J]. Journal of Fluids Engineering, 2014,136(3): 031303.
[18] Lee J. H., Jung J. K., Lee K. J. et al. Experimental estimation of a scaling exponent for tip vortex cavitation via its inception test in full- and model-ship [J]. Journal of Hydrodynamics, 2012, 24(5): 658-667.
[19] Welch P. D. The use of fast Fourier transform for the estimation of power spectra: A method based on time averaging over short, modified periodograms [J]. IEEE Transactions on Audio Electroacoustics, 1967, 15(2):70-73.
[20] Chang N. A., Dowling D. R. Ray-based acoustic localization of cavitation in a highly reverberant environment [J].Journal of Acoustical Society of America, 2009, 125(5):3088-3100.
杂志排行
水动力学研究与进展 B辑的其它文章
- Editorial Message
- ICHD’ 2018 The 13th International Conference on Hydrodynamics First Announcement September 2-6, 2018 Sheraton Grand Inchecon Hotel Songdo, Incheon Korea
- Compressible effect on the cavitating flow: A numeric study *
- Design and experiment of the centrifugal pump impellers with twisted inlet vice blades *
- Two timescales for longitudinal dispersion in a laminar open-channel flow *
- Numerical simulation of a two-dimensional flapping wing in advanced mode *