Optimization of Nonlinear Vibration Characteristics for Seismic Isolation Rubber
2017-03-13TakahashiShibataMotoyamaandMisaji
A. Takahashi , T. Shibata, K. Motoyamaand K. Misaji
1 Introduction
Seismic-isolation laminated rubber is used as a means of suppressing damage to structures caused by earthquakes. Placed between the ground and a building structure, it absorbs seismic energy by flexibly deforming in the horizontal direction. Seismicisolation laminated rubber has a characteristic called a “non-linear restoring force”(which depends on displacement amplitude), and comprehending the dynamic response reflected in that characteristic is a vital factor in the design of the rubber. Moreover, when designing a structure with seismic-isolation laminated rubber, the designer usually selects one rubber from existing rubbers provided by rubber manufacturers in consideration of the kind of structure and its earthquake resistance. If the restoring-force characteristic of the selected rubber could be optimized, and thereby minimize the seismic response of the structure, it would make designing the rubber much easier.
In the present study, a method called PFT-ELS (Equivalent Linear System using Restoring Force Model of Power Function Type) is used for analyzing the non-linear oscillation of seismic isolation laminated rubber. PFT-ELS has been used for calculating approximate responses of various non-linear-vibration systems [Kazuhito, M., et al.(1994); Koichi, S., et al. (1995); Koichi, S., et al. (1996)]. By applying PFT-ELS to seismic-isolation laminated rubber, a 15-layer model using that rubber is constructed.After that, the restoring-force characteristic of the rubber (which minimizes the seismic response of the structure) is optimized by using a generic algorithm (GA). In this manner,it is possible to design the rubber so that it minimizes the damage to a structure due to an earthquake.
On the basis of these results, the optimum solution for the restoring-force characteristic during different earthquakes can be considered, and the effectiveness and usability of the optimization method is demonstrated. As a result, the vibration characteristics of the laminated rubber that minimize damage to a building were revealed by using the developed optimization method during the design stage. As examples of earthquakes,ones that occurred in El Centro, California, USA in 1940 and Hachinohe, Aomori prefecture, Japan in 1968 were used.
2 Analysis method
2.1 Equivalent Linear System using Restoring Force Model of Power Function Type(PFT-ELS) Method
The analysis method used obtains a bone curve and area from a hysteresis restoring-force curve that was changed under displacement amplitude, creates a restoring force model of power function type (PFT-RFM, hereafter) equivalent to those values, and obtains a damping coefficient and dynamic spring constant of a seismic-isolation laminated rubber.In general, a single-degree-of-freedom system affected by an involuntary external force(acceleration) is expressed in terms of mass of a mass m, displacement x, and restoring force f (x)as the following equation:

Making this equation dimensionless gives the following equation:
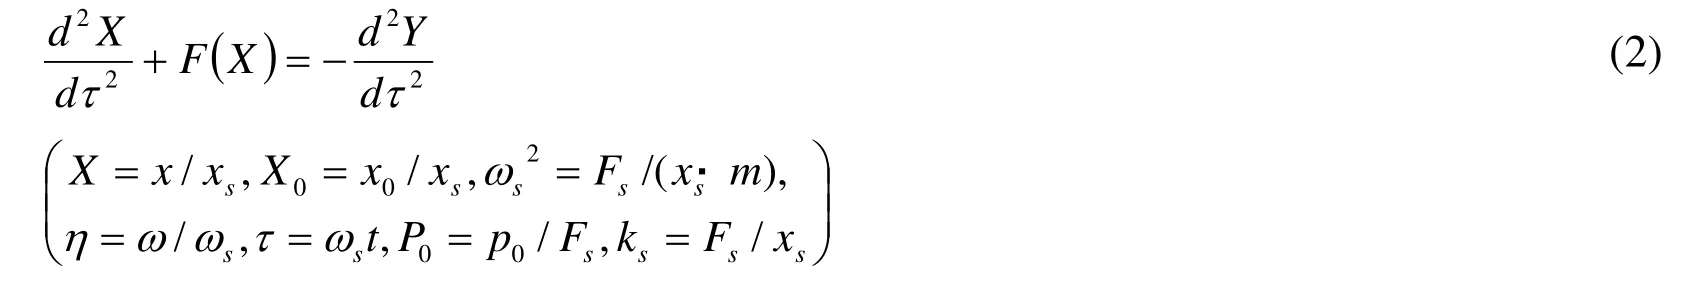
where F (X)is dimensionless restoring force,xsand Fsare displacement and restoring force under linear limits,ωsis inherent angular frequency under linear limits, and x0is displacement amplitude. The following equation is obtained by replacing the hysteresisvibration system in Equation (2) with an equivalent-linear-vibration system:

where equivalent damping coefficient Heqand equivalent spring constant Keqare given as
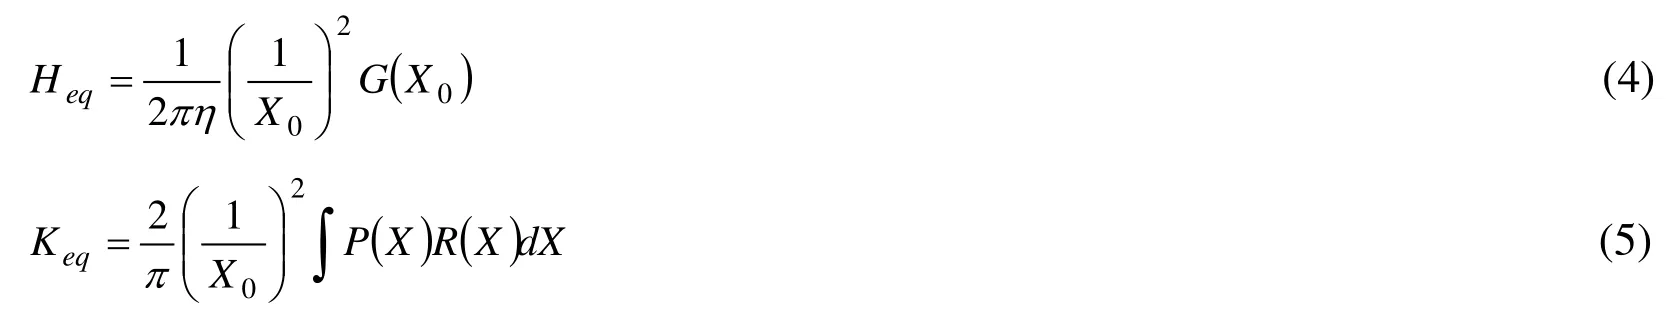
where G(X0)is the area enclosed by the hysteresis loop with respect to the amplitude of displacement X0,R(X)represents a hysteresis loop (sum curve) formed by an ascending branch and a descending branch for each angular displacement, and P(X)is given as
In this case, as a basic hysteresis-loop model for calculating G(X0)and R(X), a softspring-type PFT-RFM (Fig. 1), which has a similarly shaped hysteresis loop to that of seismic isolation laminated rubber, is used. The basic equations for the soft spring type are given as follows.
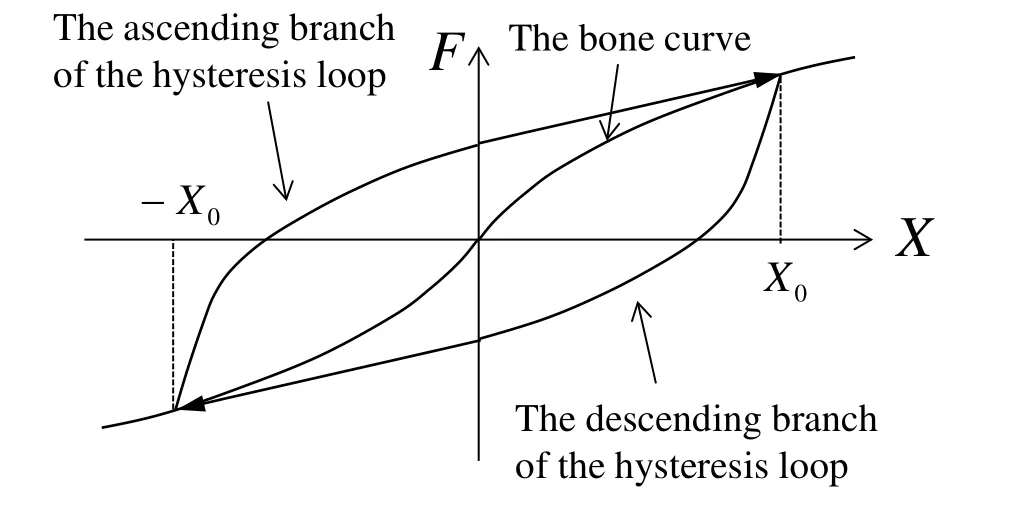
Figure 1: Restoring- force model of with power function model(soft- spring type)
Bone curve:

Ascending branch of the hysteresis loop:

Descending branch of the hysteresis loop:

With regard to this restoring-force model, the area enclosed by the hysteresis loop G(X0)is given as

To find shape parameters a and k of the PFT-RFM in Equations (6), (7) and (8),vibration characteristics of seismic isolation laminated rubber are incorporated in the basic hysteresis-loop model under conditions (I) and (II) as follows:
(I) The area enclosed by the hysteresis loop obtained from vibration tests and the area enclosed by the hysteresis loop given by the PFT-RFM were equalized.
(II) The bone curve obtained by linking the peaks of the hysteresis loops obtained from the vibration tests was matched to the bone curve given by the PFT-RFM.
The areas and peaks of the hysteresis loops obtained from the vibration tests are approximated by the least-squares method. By finding area G0and peak F0obtained from the functions, shape parameters a and k are obtained from the following equations.

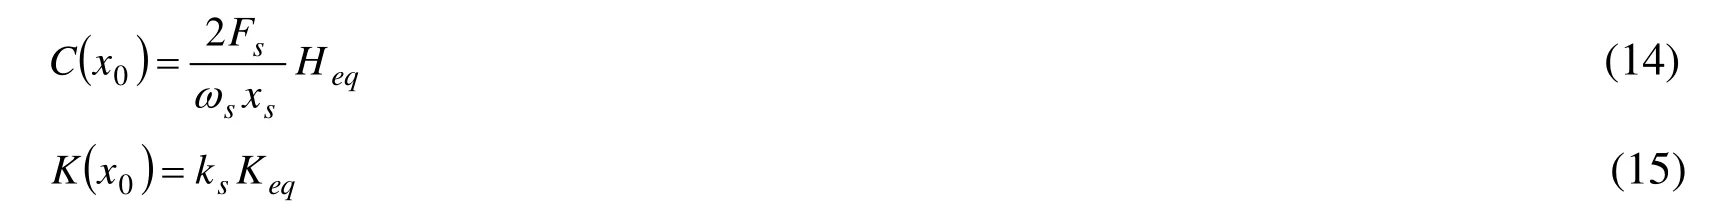
That is, if the area of the hysteresis loop and bone curve is functionalized in terms of displacement amplitude X0, [object] can be replaced with the PFT-RFM using α(X0)and k (X0)given by Equations (10) and (11). Therefore,G(X0)and R (X)in Equations (4)and (5) can be calculated, and equivalent damping coefficient Heqand equivalent spring constant Keqof the rubber are given as follows:
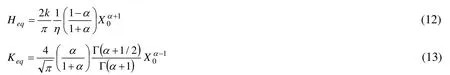
Substituting Equations (12) and (13) into Equations (14) and (15) makes it possible to calculate displacement amplitude x0, non-linear damping coefficient C (x0), and dynamic spring constant K (x0)of the rubber.
Using C (x0)and K (x0), the equation of motion in the case that an involuntary external force is applied to a single-degree-of-freedom system is given as

Solving Equation (16) (displacement amplitude x0) by determining C (x0)and K (x0)for each hysteresis loop is known as the “equivalent-linear-system analytical method” using the PFT-RFM.
Solving the above equation enables analysis of response in connection with systems possessing damping and spring properties depending on amplitude of displacement. This is known as the analytical method of equivalent linear system.
2.2 Modeling of a High-rise Building Incorporating Seismic-isolation Rubber
A high-rise (15-storey) building incorporating seismic isolation rubber is expressed as a 16-degree-of-freedom spring-mass model. The model is shown in Fig. 2, and the specifications of the high-rise building are listed in Table 1 [The Architectural Institute of Japan (1989)]. In the figure,miis the mass of the ith layer,ciis the damping coefficient of the ith layer,kiis the spring coefficient of the ith layer,mbis the mass of a seismically isolated layer,Cbis the damping coefficient of the seismically isolated layer,and Kbis the spring coefficient of the seismically isolated layer.Cband Kbare calculated by the PFT-ELS method.
The equations of motion can be expressed by the following equation when an external force (acceleration ˙y˙) is applied to 16 degree of freedom system.

3 Seismic-isolation Laminated Rubber
The laminated rubber used in this study has high damping coefficient, and its specifications are listed in Table 2. While under a vertical load, the rubber was deformed in the horizontal direction (i.e., shear deformation), and the static shear load was measured. The hysteresis restoring force loops given by these measurements are shown in Fig. 3. Using the mass of a high-rise building and the recommended long-term axial force to be applied to the laminated rubber, the PFT-RFM was applied to six types of laminated rubbers.

Figure 2: Schematic diagram of high-rise building structure
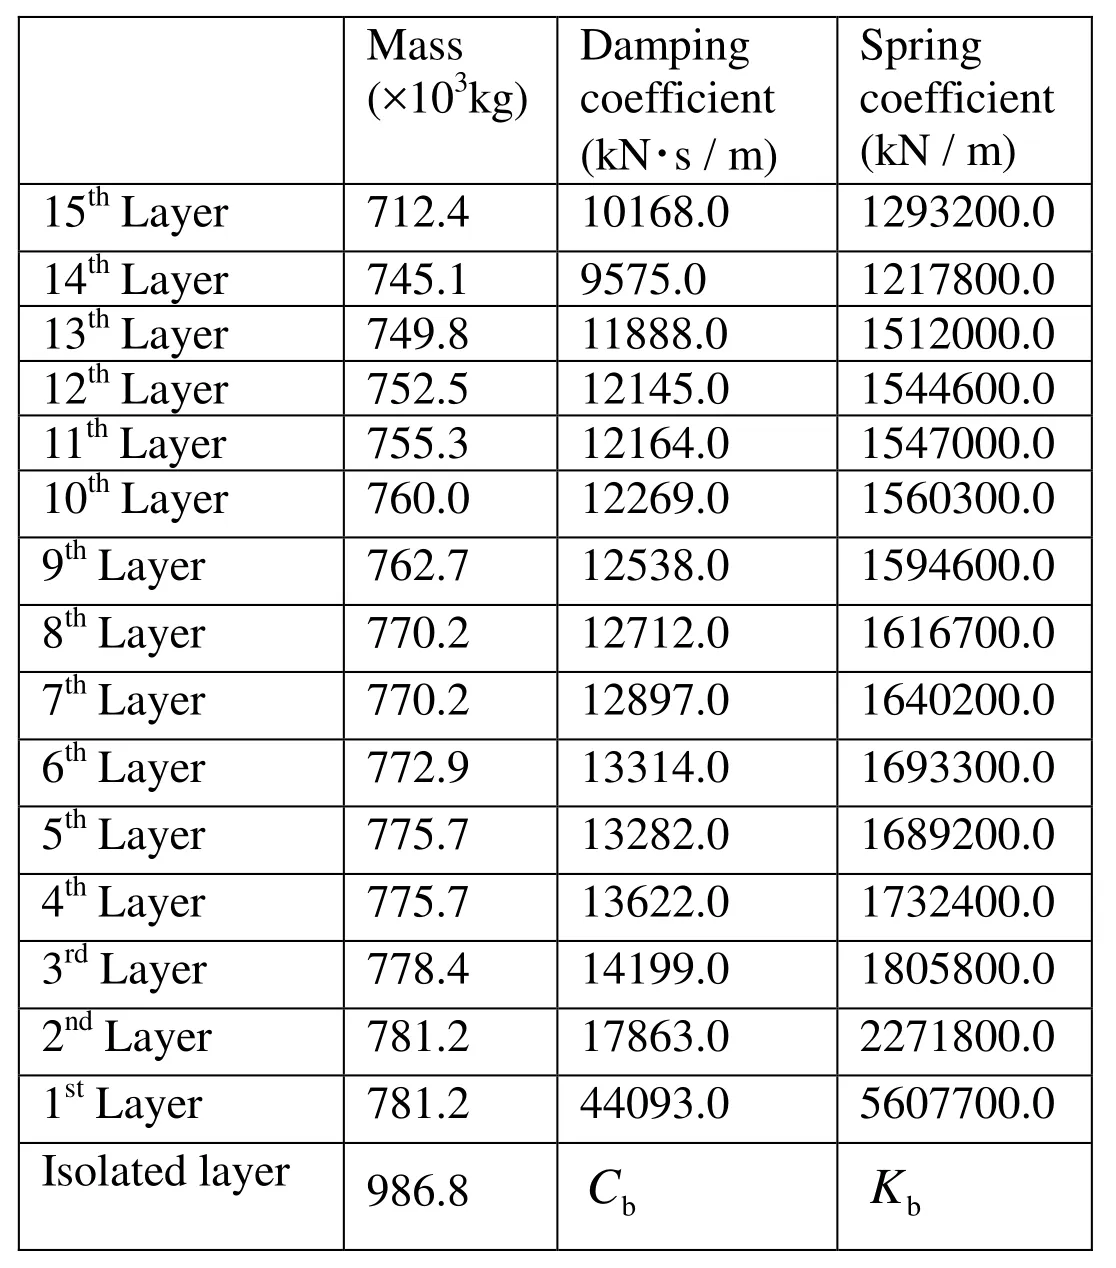
Table1: Specifications of high-rise building
3.1 Functionalization
The areas and peaks of the loops necessary to create the PFT-RFM were calculated, from the hysteresis restoring-force loops of the laminated rubber (Figure 3). The bone curve obtained from each peak and the area enclosed by the hysteresis loop were made dimensionless and approximated as functions by the least-squares method. The approximated functions for the area and bone curve, which depend on displacement amplitude X0, are shown in Table 3. In this manner, shape parameters α and k of the PFTRFM are obtained from Equations (10) and (11). Moreover, the damping coefficient and spring constant of the rubbers can be calculated from Equations (14) and (15).
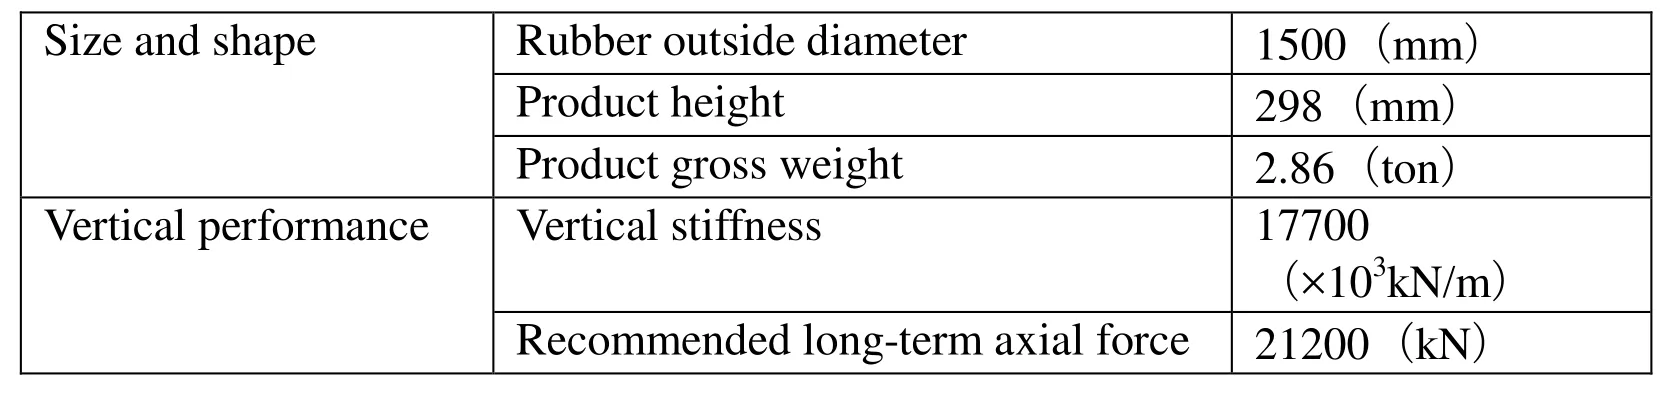
Table 2: Specifications of seismic isolation rubber used in this study
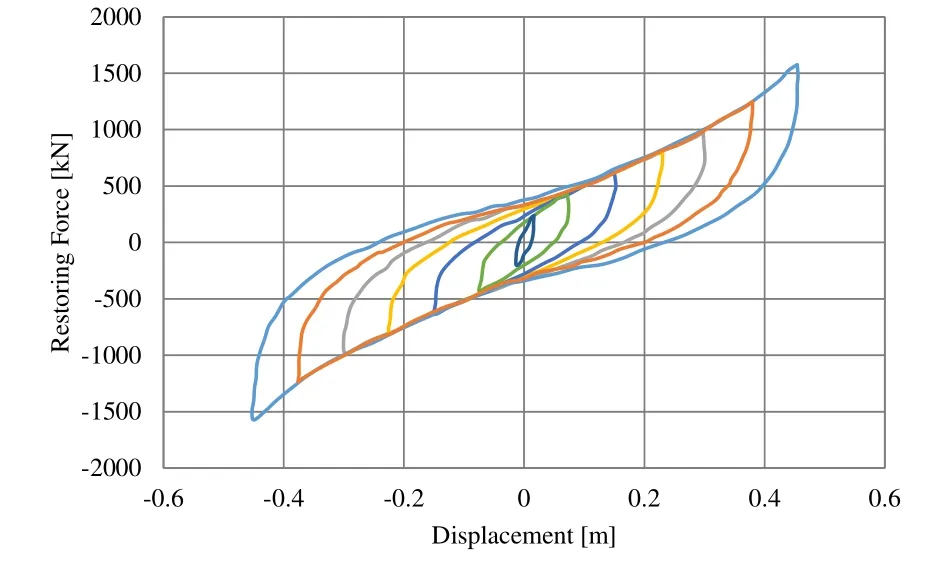
Figure 3: Hysteresis loops of measured values
Table 3: Functions of the bone carve and area
4 Validation of Seismic-isolation-laminated-rubber Model
4.1 Calculation of Discrete Values of Damping Coefficient and Spring Constant
To validate the accuracy of the analysis results, discrete values of the damping coefficient and spring constant of the rubbers were obtained from the hysteresis loop in Figure 4 by using Equations (18) and (19) and evaluated in comparison with published analysis results (Tajima, et al. 1965).

Here,δis loss angle,ΔWis the energy absorbed by the rubber in one period (area surrounded by the hysteresis loop), and W is the elastic energy stored by the rubber(shaded triangular areas in the figure).

Here,C’is the discrete value of the damping coefficient, and K’is the discrete value of the spring constant.
Figure 4: Method of calculating discrete values of damping coefficient and spring constant
4.2 Comparison of Hysteresis Loops of Measured and Calculated Values
Hysteresis loops of values calculated by the PFT-RFM are compared with the hysteresis loops of measured values in Figures 5 and 6 (dotted lines: measured values; solid lines:calculated values). The calculated values of loop 1 to loop 5 are approximately consistent with the corresponding measured values. However, the calculated values and measured values of loops 6 and 7 diverge slightly, but their peaks are consistent.
Figure 5: Hysteresis loop for seismic isolation rubber (Loop 1 ~ Loop 5)
Figure 6: Hysteresis loop for seismic isolation rubber (Loop 6, Loop 7)
4.3 Dependency of Damping Coefficient and Spring Coefficient on Displacement Amplitude
The discrete (measured) values of the damping coefficient and spring constant obtained from the measured hysteresis loops described in the preceding section are compared with the continuous (analytical) values found by PFT-ELS in Figures 7 and 8, respectively.The PFT-ELS values are approximately consistent with the discrete values. Moreover, as mentioned above, although the ascending and descending branches of the measured and calculated loops 6 and 7 in Fig. 6 deviate, that deviation does not influence the damping coefficient or spring constant. The above results indicate that it is possible to apply the PFT-ELS method to analysis of nonlinear vibration of seismic-isolation rubber.
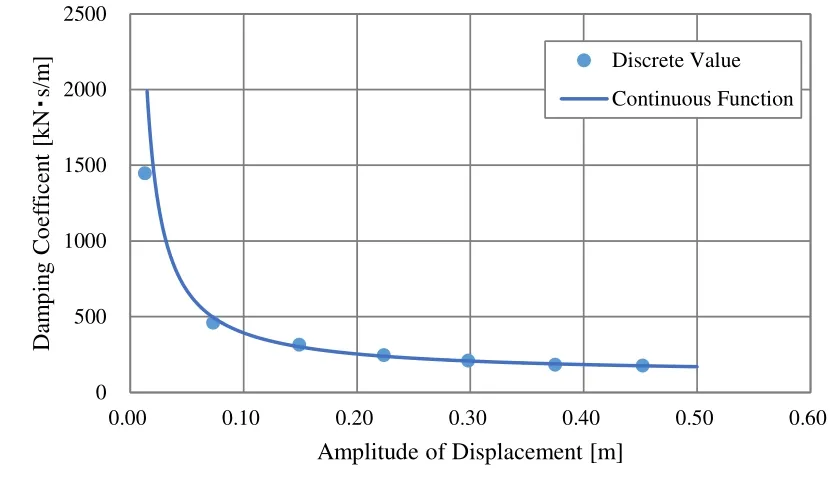
Figure 7: Damping coefficient dependence on amplitude
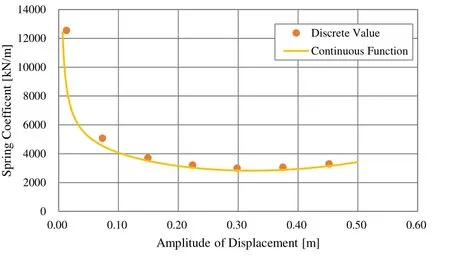
Figure 8: Spring constant dependence on amplitude
5 Analysis of Seismic Response of a High-rise-building Model Incorporating Seismic-isolation Rubber
The seismic response of a seismically isolated building model was analyzed as follows.The PFT-ELS method was applied to the seismic-isolation layer. The 1940 El Centro Earthquake (which acted in the east-west direction) was used as the seismic wave in the analysis (see Fig. 9). To confirm the effect of the seismic isolation, the results of the seismic-response analysis using the seismically isolated building model were compared with those obtained using a non-seismically isolated building model. The absolute response acceleration of the first layer (is shown in Fig. 10, and that of the 15th layer (˙) is shown in Fig. 11. The relative response velocity of the first layer() is shown in Fig. 12, and that of the 15th layer () is shown in Fig. 13. It is clear from these results that the response of both layers diminishes with time in both the with- and without-isolation cases.
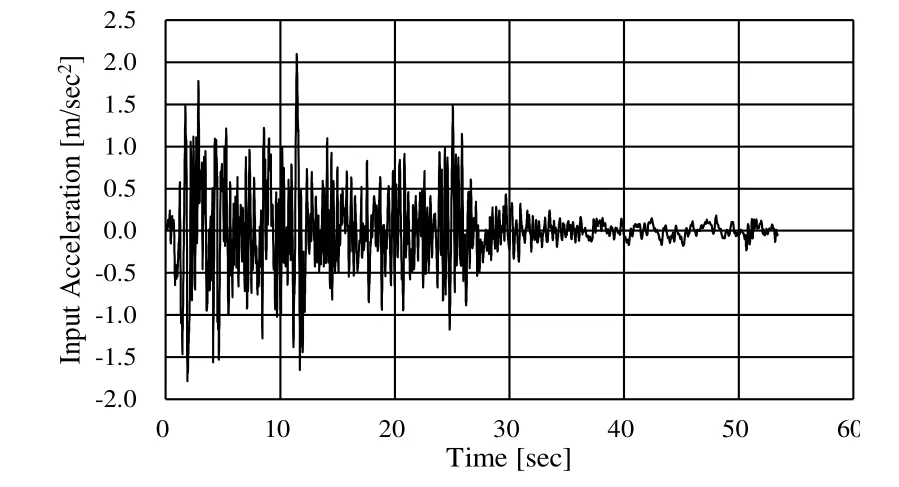
Figure 9: Input acceleration (Elcentro EW)
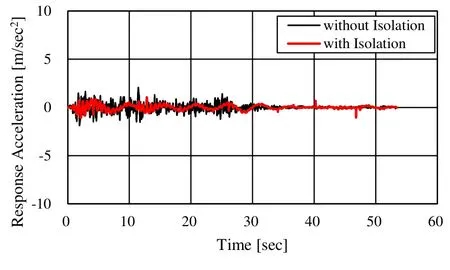
Figure 10: Absolute response acceleration of 1st layer

Figure 11: Absolute response acceleration of 15th layer
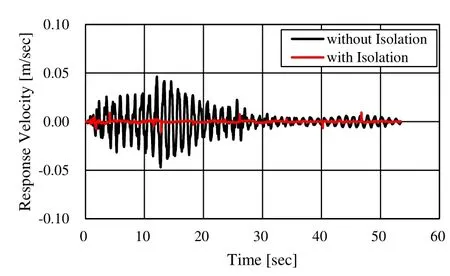
Figure 12: Relative response velocity of 1st laye
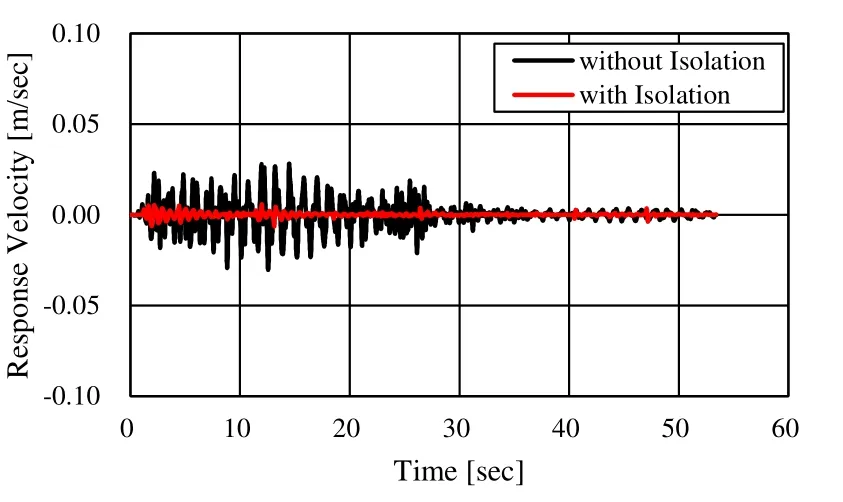
Figure 13: Relative response velocity of 15th layer
6 Optimization of Seismic-isolation Rubber by Using a Genetic Algorithm
The restoring-force characteristic of seismic-isolation rubber that minimizes the response of a seismic-isolated structure during an earthquake was optimized by using a generic algorithm (GA) as follows, and the seismic response of the building model was analyzed by using the optimized restoring-force characteristics. These results are compared with response-analysis results before optimization. The seismic waves used in the optimizations were generated by the El Centro (E-W) and Hachinohe (E-W) earthquakes(Fig. 16), and the restoring-force characteristics of seismic-isolation rubber were optimized for each seismic wave.
6.1 Design Variables and Objective Function
As explained in Section 2, the PFT-RFM was constructed by calculating the shape parameters from the bone-curve function and area function (Table 3). Constant multiples of these functions are defined as design variables as follows:

Bone-curve and area functions are calculated by combining design variables βand γ,and the PFT-RFM is constructed. The design variables range from 0.5 to 2.0 in steps of 0.1. The constructed PFT-RFM was used to analyze the seismic response of a seismicisolation-structure model shown in Fig. 2. Maximum response velocity and maximum response acceleration of the top layer were taken as objective functions (objective functions 1 and 2, respectively), and design variables that minimize these functions were identified by using the GA.
6.2 Analysis Results
First, the characteristics of the seismic-isolation rubber for the El Centro (E-W)earthquake were optimized. A Pareto chart and hysteresis loop for the optimized seismicisolation rubber are shown in Figures 14 and 15, respectively. The damping coefficient is plotted in Fig. 16, and the spring constant is plotted in Fig. 17. According to the optimization results, β = 0.6 and γ = 0.6 is the optimum combination for minimizing the maximum response velocity and maximum response acceleration of the top layer of the laminated rubber.
The area of the hysteresis loop and the gradient of the bone curve decrease as compared to those values before the optimization. That is, after the optimization, the stiffness and damping coefficient of the rubber are decreased (Figs. 16 and 17). The seismic response of the rubber was re-analyzed by using the optimized restoring-force model, and the results were compared with those before the optimization. Response acceleration and response velocity of the top layer are plotted in Figures 18 and 19. It was thus confirmed that by optimizing the hysteresis restoring-force characteristic, it is possible to reduce the maximum response amplitude.
Next, the characteristics of the seismic-isolation rubber for the Hachinohe (E-W)earthquake (1968) were optimized. Input acceleration is plotted in Figure 20, the hysteresis loop for the optimized rubber is shown in Figure 21, the rubber’s damping coefficient is plotted in Figure 22, and its spring constant is plotted in Figure 23.According to the optimization results, β = 0.8 and γ = 1.0 is an optimum combination for the earthquake in question. The area of the history loop is decreased as compared to that before the optimization; that is, only the damping characteristic is degraded (Figures 22 and 23). These results indicate that the optimization results depend on the input seismic wave.
Next, the effect of optimization is confirmed by frequency characteristics. Acceleration spectrums of 15th layer for El Centro (E-W) earthquake and Hachinohe (E-W)earthquake are shown in Figures 25 and 26, respectively. In Fig. 25, the peak of the first order natural frequency (0.2[Hz]) of the structure reduced by about 30%, and the peak of the second order natural frequency (1.4[Hz]) was also reduced by about 60% (Fig. 25).Moreover, in Fig. 26, the peak of the first order natural frequency (0.2[Hz]) of the structure reduced by about 40%. From these results, it was found that the effect of optimization was the largest at the resonance peak. And, it was confirmed that the effect of optimization differs depending on the type of earthquake.
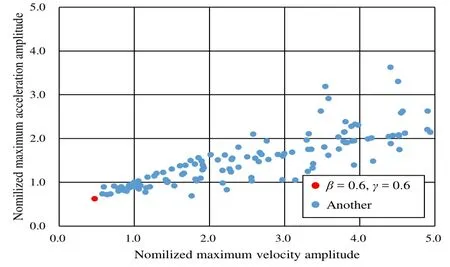
Figure 14: Pareto chart
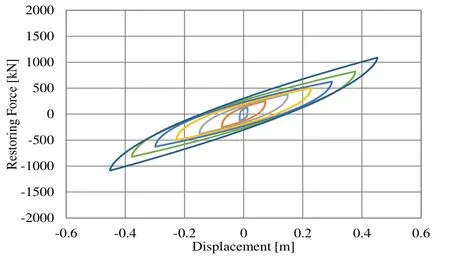
Figure 15: Hysteresis loop for seismic isolation rubber after optimization
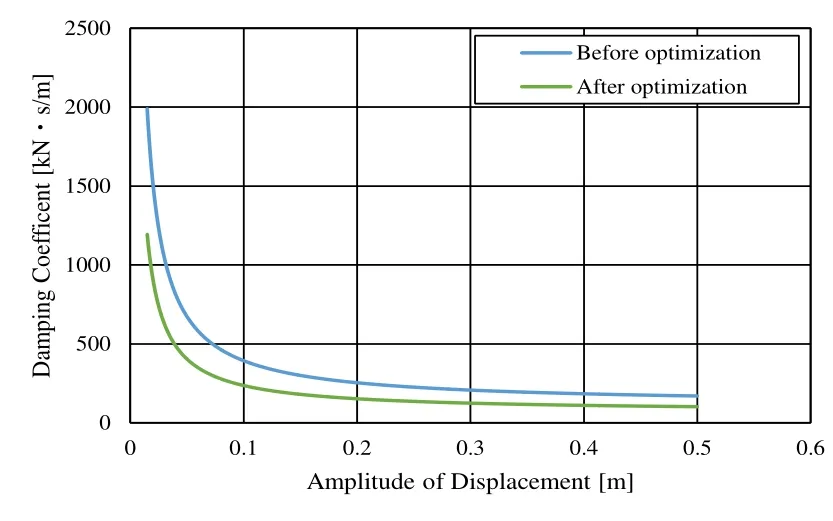
Figure 16: Damping coefficient dependence on amplitude
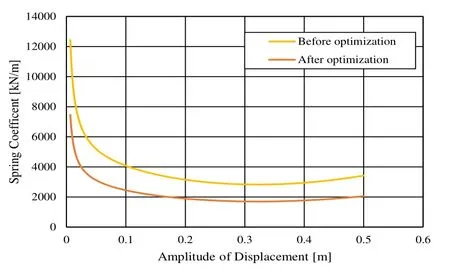
Figure 17: Spring constant dependence on amplitude
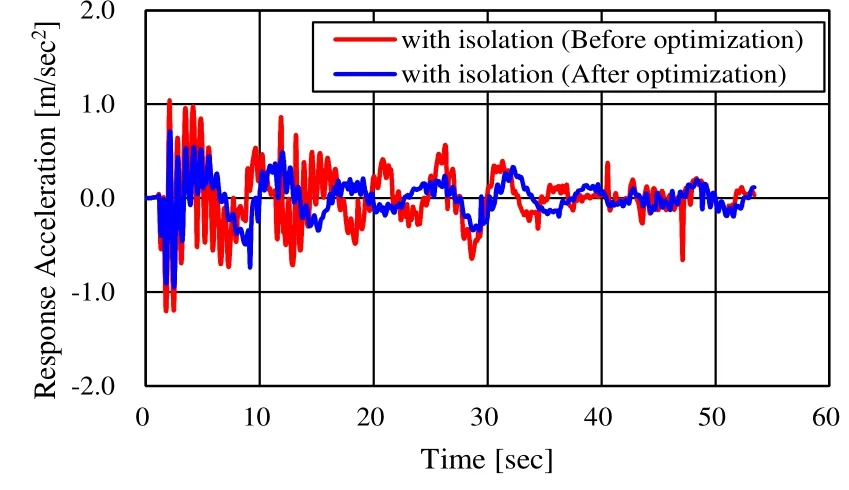
Figure 18: Absolute response acceleration of 15th layer
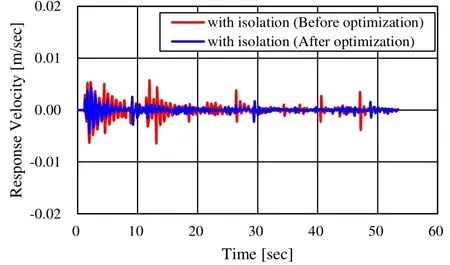
Figure 19: Relative response velocity of 15th layer

Figure 20: Input acceleration(Hachinohe E-W)
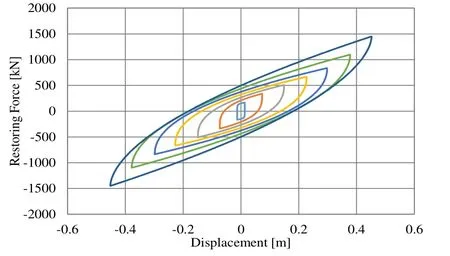
Figure 21: Hysteresis loop for seismic isolation rubber after optimization
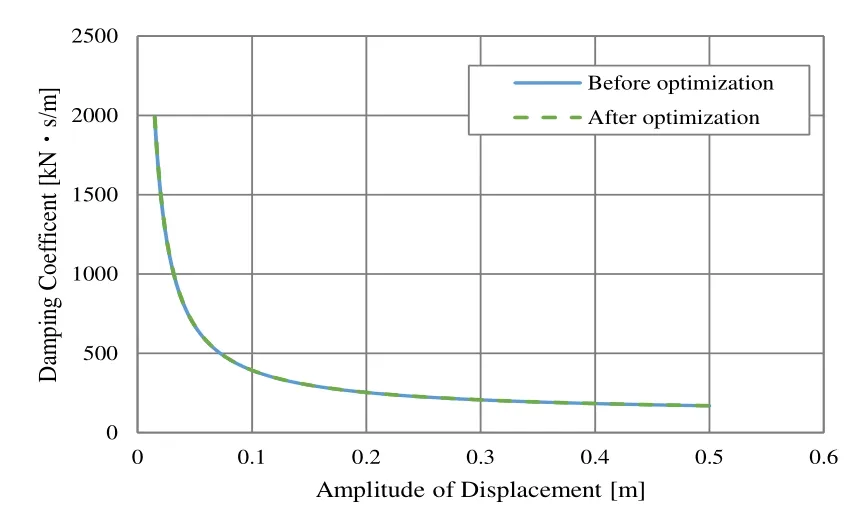
Figure 22: Damping coefficient dependence on amplitude
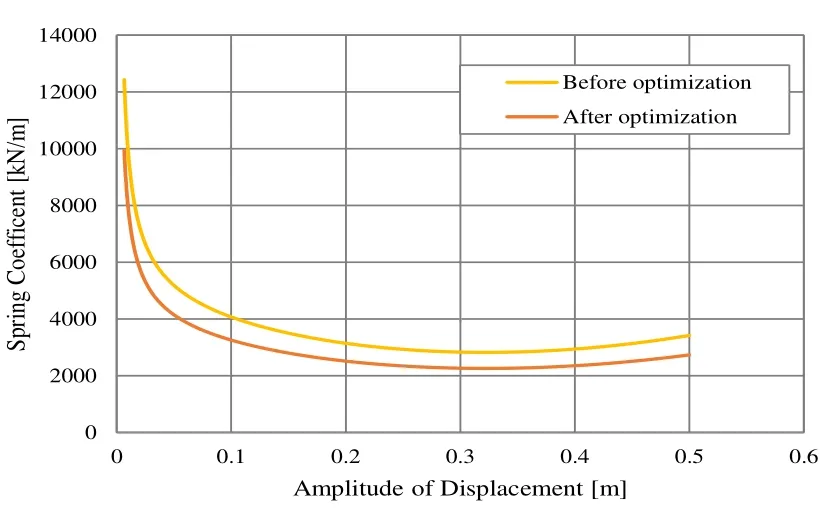
Figure 23: Spring constant dependence on amplitude

Figure 25: Acceleration spectrum(Elcentro EW)
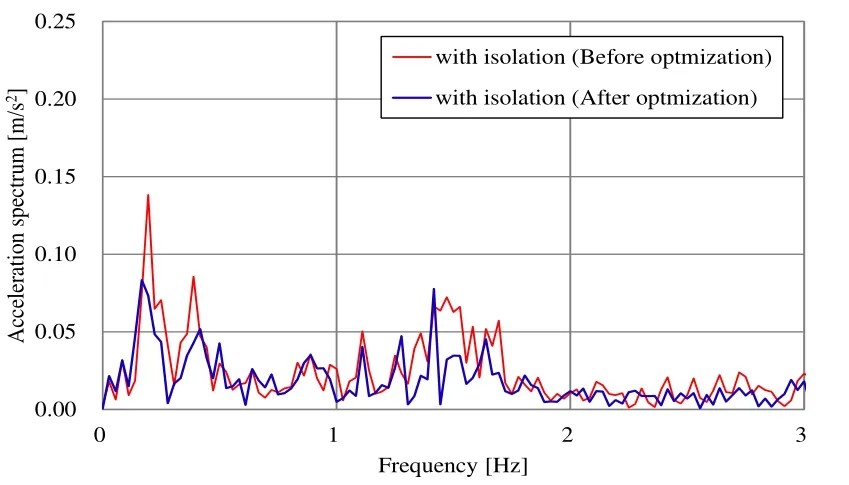
Figure 26: Acceleration spectrum (Hachinohe EW)
7 Conclusions
Nonlinear-vibration characteristics of seismic-isolation rubber were modeled, and the PFT-ELS (power-function-type equivalent linear system using restoring-force model)method was applied to analyze the model. Next, the restoring-force characteristic of the seismic-isolation rubber that minimizes the behavior of a structure subjected to seismic waves with different characteristics was obtained by using a genetic algorithm. The findings of this study are summarized as follows.
• The non-linear vibration characteristics of the seismic-isolation rubber (which depend on displacement amplitude) could be accurately obtained by using the PFTELS method.
• Two design variables (γ and β), which show the restoring-force characteristics of the seismic-isolation rubber, could be obtained by using a generic algorithm for two objective functions (namely, the minimum of the maximum response velocity of the top layer and the minimum of maximum response acceleration).
• Restoring-force characteristics of the optimized rubber for minimizing the response of a high-rise building depend on the characteristics of the seismic wave.
• The proposed PFT-ELS method can obtain the optimum restoring-force characteristic of the rubber that minimizes the response of a structure for a target earthquake. By utilizing this method, it is possible to optimize the design of a certain seismic-isolation rubber instead of simply selecting a suitable rubber from existing seismic-isolation rubbers in the conventional manner.
• As a future schedule, at first we would like to verify by comparing the analysis result shown in this paper with the experimental value. Next, we carry out similar verification against wind load too.
Kazuhito, M.; Hideki, K.; Koichi, S. (1994): Vibration Characteristics of Rubber Vibration Isolators of Vehicle: Analysis of Nonlinear Vibration Response. Transactions of the Japan Society of Mechanical Engineers Series C, Vol. 60 (1994) No. 578 P 3274-3280.
Koichi, S.; TSUTOMU, T. TAKAYOSHI, S. (1995): Vibration Properties of Rubber Bearing for Base Isolation System: Analytical modeling for the hysteresis restoring force characteristics and nonlinear vibration properties. Journal of Structural and Construction Engineering, Vol. 60 (1995) No. 475 p. 93-102.
Yasuhiro, S.; Shuichi, O.; Hiroyuki, S., Koichi, S. (2000): Study on Response Analysis of Vibration System using Laminated Rubber for Earthquake Isolation System:Improvement on analytical method of hysteresis system and verification by experiment,frequency and surface pressure and analysis of vibration response. Journal of Structural and Construction Engineering, Vol. 65 (2000) No. 532 p. 71-78
The Architectural Institute of Japan (1989): Design Recommendations for Seismically Isolated Buildings. The Architectural Institute of Japan, p.348.
Goldberg, D. E. (1989): Genetic Algorithms in Search, Optimization and Machine Learning. Addison-Wesley Publishing Company.
Motoyama, K. etc. (2012): Study on Nonlinear Vibration of Rubber Bearing for Base Isolation System with Hysteresis Restoring Force Charachteristics of Hardening Type:Dependency of amplitude of horizontal displacement, frequency and surface pressure and analysis of vibration response. SAE 2012 World Congress, 2012-01-0772.
Islam, M. R.; Bujik, A.; Rais-Rohani, M.; Motoyama, K. (2014): Simulation-Based Numerical Optimization of Arc Welding Process for Reduced Distortion in Welded Structures. Finite Elements in Analysis and Design, Vol. 84, P 54–64.
杂志排行

Computer Modeling In Engineering&Sciences的其它文章
- Acoustic Scattering Performance for Sources in Arbitrary Motion
- Inverse Analysis of Origin-Destination matrix for Microscopic Traffic Simulator
- Stability Analysis of Cross-channel Excavation for Existing Anchor Removal Project in Subway Construction
- A Study on the Far Wake of Elliptic Cylinders
- Reliability Analysis for Complex Systems based on Dynamic Evidential Network Considering Epistemic Uncertainty
- Modeling of Canonical Switching Cell Converter Using Genetic Algorithm