油田区多环芳烃污染盐碱土壤活性微生物群落结构解析
2016-12-28焦海华张淑珍景旭东白志辉
焦海华,张淑珍,景旭东,张 通,白志辉
1 长治学院生物科学与技术系, 长治 046011 2 中国科学院生态环境研究中心, 北京 100085 3 辽宁大学环境学院, 沈阳 110036
油田区多环芳烃污染盐碱土壤活性微生物群落结构解析
焦海华1,2,张淑珍3,景旭东1,张 通1,白志辉2,*
1 长治学院生物科学与技术系, 长治 046011 2 中国科学院生态环境研究中心, 北京 100085 3 辽宁大学环境学院, 沈阳 110036
多环芳烃(Polycyclic aromatic hydrocarbons, PAHs)是土壤中广泛存在的、美国环保总署(USEPA)优先控制的一类有毒(致癌、致突变)的持久性污染物,主要来源于人类活动。土壤微生物多样性是表征土壤质量变化的敏感指标之一。磷脂脂肪酸(PLFAs)分析方法是基于活性微生物细胞膜的PLFAs组分的生化检测技术,克服了传统培养方法只能分离出少量微生物(<1%)的缺点。采用PLFAs方法,解析了土壤活性微生物对PAHs污染胁迫的反应。结果表明,土壤微生物分布情况可分为4种类型:Ⅰ型,微生物PLFAs种类最多,占该区土壤微生物PLFAs种类总数的57.7%,PAHs对变量的解释量最小;Ⅱ型,微生物PLFAs占PLFAs总数的30.8%,PAHs对变量的解释量较小;Ⅲ型,微生物PLFAs种类占总数的7.68%,PAHs对变量的解释量较大;Ⅳ型,微生物PLFAs的种类仅占总数的3.85%,PAHs对变量的解释量最大。相关性分析表明:土壤微生物PLFAs的种类、生物量和生态多样性指数与土壤中萘(Nap)、芴(Flu)、蒽(Ant)、苯并[K]荧蒽(Bkf)、苯并[a]芘(Bap)、茚并[1,2,3-cd]芘(Ind)的相对含量呈负相关关系;与苊(Ace)、菲(Phe)、荧蒽(Fla)、芘(Pyr)、苯并[a]蒽(Baa) 的相对含量呈正相关关系;与PAHs的种类和浓度呈负相关关系。结果将为开展PAHs污染土壤的生态风险评价和微生物生物修复技术研究提供理论依据。
磷脂脂肪酸(PLFAs); 多环芳烃(PAHs); 微生物群落; 盐碱土壤; 微生物多样性
土壤微生物是土壤生态系统最活跃的组分,常被比拟为土壤养分循环的“转化器”、污染物的“净化器”和生态系统稳定的“调节器”,在维持土壤生态系统的稳定以及受损生态系统的恢复与重建过程中发挥重要作用[1-2]。有些土壤微生物类群能通过基因表达的蛋白酶,或通过共代谢作用降解有机污染物[3]。有的类群形成了以某些污染物作为唯一碳源或能源的生理代谢特征。Loreau等[4]认为土壤微生物群落结构与功能的改变,可以作为一个生物预警指标指示土壤质量的变化,因为在稳定的土壤生态系统中,土壤微生物具有较高的多样性,而微生物多样性的减少则会导致统稳定性和生态功能的下降。土壤微生物种类丰富、数量巨大。据估算,每克土壤中约有几万个物种,百亿个微生物个体。目前,仅有大约4500个种类得到了鉴定,其中,约有100多个属,200多个种被证明能够降解石油等有机污染物[5]。因此,在土壤污染问题日益突出的今天,探讨污染物对土壤微生态系统的影响将具有重要的理论研究与实际应用价值。
土壤中可培养微生物仅占总量的1%—10%,利用传统的平板培养方法会过低估计微生物的量;利用克隆文库和DNA测序等分子技术不能区分微生物是活体还是死体。磷脂脂肪酸(PLFAs)是微生物生长代谢过程合成的膜结构物质,具有结构和种类的多样性,且细胞一旦死亡PLFAs将迅速分解。因此,PLFAs标识的是活性微生物类群,能反应土壤微生物群落随环境质量改变而变化的动态过程[6]。
大港油田区具有50多年的石油勘探与开采历史,土壤存在一定程度的多环芳烃(PAHs)污染。近年来,有关于该区石油污染调查与修复技术研究的报道[7-8],但关于该区污染土壤微生态环境的研究还较少。本文以油田区土壤为研究对象,采用PLFAs分析方法,引用生态学多样性参数,探讨土壤微生物群落多样性对PAHs污染胁迫的响应特征。
1 材料与方法
1.1 土壤样品的采集
2013年5月在大港油田布设了15个采样区(400m2/区)。采用网格布点法,用不锈钢铲采集表层土壤(0—25cm),每个样区采集20—30个样点土壤,然后混合均匀记作该样区的土壤样品。土壤样品用聚乙烯自封袋密封运至实验室。土壤微生物PLFAs提取采用鲜土;PAHs提取采用冷冻干燥、研磨过100目金属筛的土壤。根据文献[9]方法提取和净化土壤PAHs;土壤含水率用烘干法测定;土壤pH采用5∶1的水土比混合液,pH计(pHs- 3C)测定;电导率(EC) 采用电导仪(DDS- 11A) 测定;土壤有机质含量(SOC)采用重铬酸钾水合加热法测定[10]。
1.2 磷脂脂肪酸测定与命名方法
采用Bligh and Dyer[11]方法提取PLFAs。浓缩样品利用气象色谱-质谱联用仪(GC/MS)测定。以十九烷酸甲酯为内标,对不同种类PLFAs定量分析[12]。采用“ω”系统对特征PLFAs进行命名,分子通式为:(i/a/me/cy)X:YωZ(c/t),其中,ω代表双键,Z代表双键距离分子末端碳原子的个数;i表示甲基支链位于距离分子末端第2个碳原子而a表示甲基支链距离末端第3个碳原子上;me代表甲基支链在中间碳原子上,其前面的数字表示距离分子始端碳原子的个数;X代表主链碳原子的个数,Y代表双键的个数;cy代表环丙基;c或t表示分子的顺、反式结构[13]。
1.3 数据统计分析
每个样品测3个重复,文中所列出的土壤样品测定值均为该样品3个重复样的平均值。采用Excel和SPSS 17.0软件进行相关数据的统计分析与处理。采用CANOCO software (version4.5, Microcomputer Power, Inc., Ithaca, NY) 对PLFAs特征进行分析。对不同类型PLFAs的浓度进行主成分分子(PCA)和冗余性分析(RDA)。各生态参数的计算公式如下[14-15]:
Margalef总丰富度指数(M)
M=(S-1)/lnN
(1)
Shannon-Wiener多样性指数(H)
(2)
Pielou均匀度(J)
J=-∑pilnpi/lnS=H/lnS, Pi=Ni/N
(3)
Simpson优势度(Y)
(4)
式中,S是系统中物种个数,在此指15个样区,土壤中某一特征PLFA检出的频次;Ni为第i种的个体数,在此指不同样区土壤中检测出的第i种PLFAs的含量;N为群落全部个体总数,在此指15个样区中检测出的各种PLFAs量的总和。
2 结果与分析
2.1 土壤基本性质和PAHs复合污染特征
土壤中共检测出12种U.S.EPA[16]优先控制的PAHs类型(表1)。不同样区PAHs种类变化范围在6—12种,包括2环—6环类型。萘(Nap)、芴(Flu)、荧蒽(Fla)、芘(Pyr)为完全分布,所有样区均检测到;2环PAHs在不同样区占总量比例范围为2.20%—96.7%,S3最高,S2最小;3环PAHs所占比例范围为0.473%—67.4%,S11最小,S2最高;4环所占比例范围为:nd—41.3%,S4最高,S3中没检测到;5环比例范围nd—42.7%,S12最高,S2、S5、S10均没检测到;6环所占比例范围为nd—14.6%,S2中最高,S3、S4、S5、S10、S13、S13、S15均没检测到。PAHs总浓度(∑PAHs)范围在1.03×10²—37.7×10²ng/g,平均值为7.78×102ng/g。
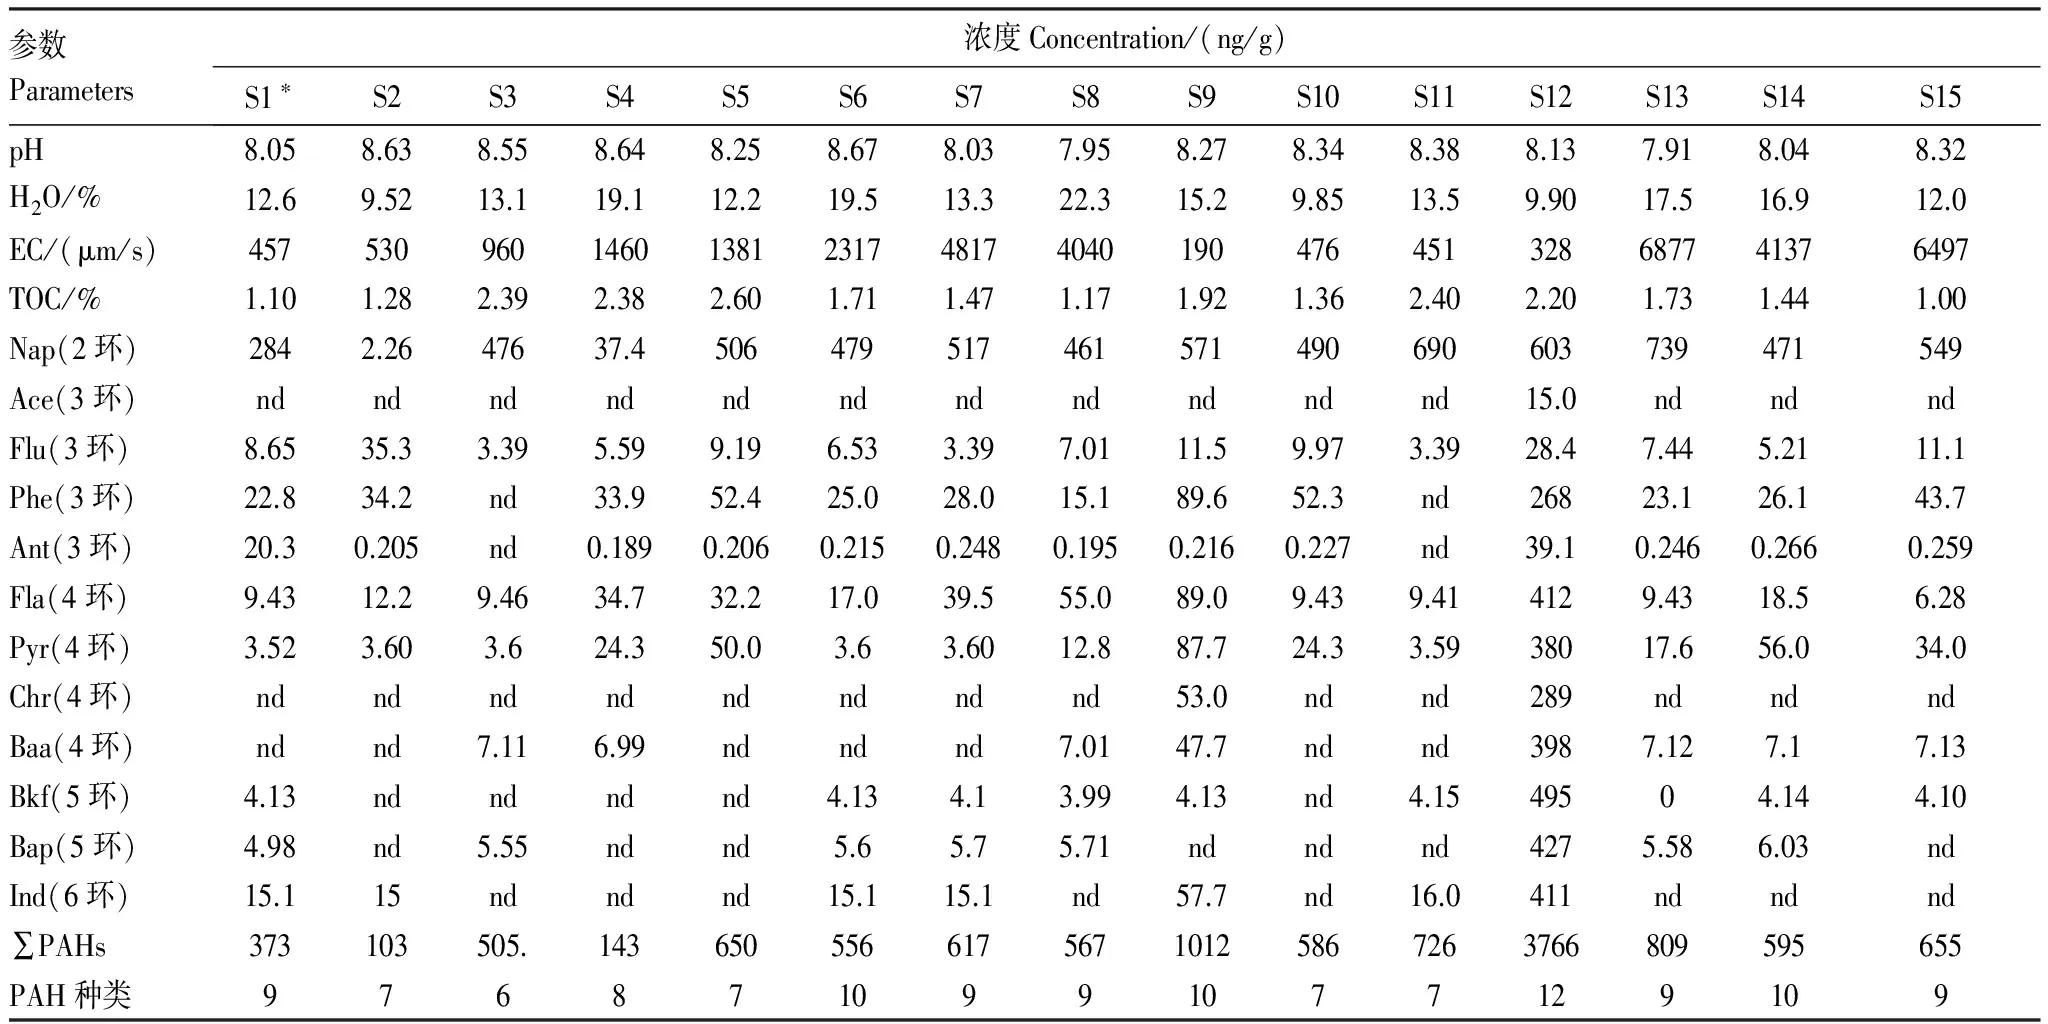
表1 土壤与多环芳烃(PAHs)的污染特征值

2.2 土壤微生物群落组成
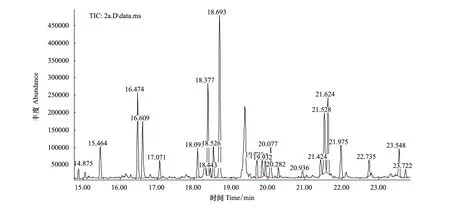
图1 土壤样品(S4)微生物群落磷脂脂肪酸气相色谱图Fig.1 Chromatogram profile of phospholipids fatty acids of the microbial community in soil sample (S2)
以土壤样品(S2)提取的PFLAs气相色谱图(图1)为例。其中,横坐标表示各PLFAs特征峰出现的时间,纵坐标表示各PLFAs的丰度。将图谱信息转化为数据信息(表2)可知:土壤中共检测到从C10—C24的26种PLFAs类型,最少的样区S7(3种),最多的样区S4(17种)。根据分子结构可分为标识细菌的饱和型脂肪酸(SAT)[17];标识革兰氏阳性菌(G+)的支链末端型饱和脂肪酸(TBSAT)[18];标识放线菌的支链中间型饱和脂肪酸(MBSAT)[19];标识革兰氏阴性菌(G-)的单不饱和型脂肪酸(MONO)和环丙脂肪酸(CYCLO)[20];标识真菌的多不饱和型脂肪酸(PUFA)[21]等6大类群。
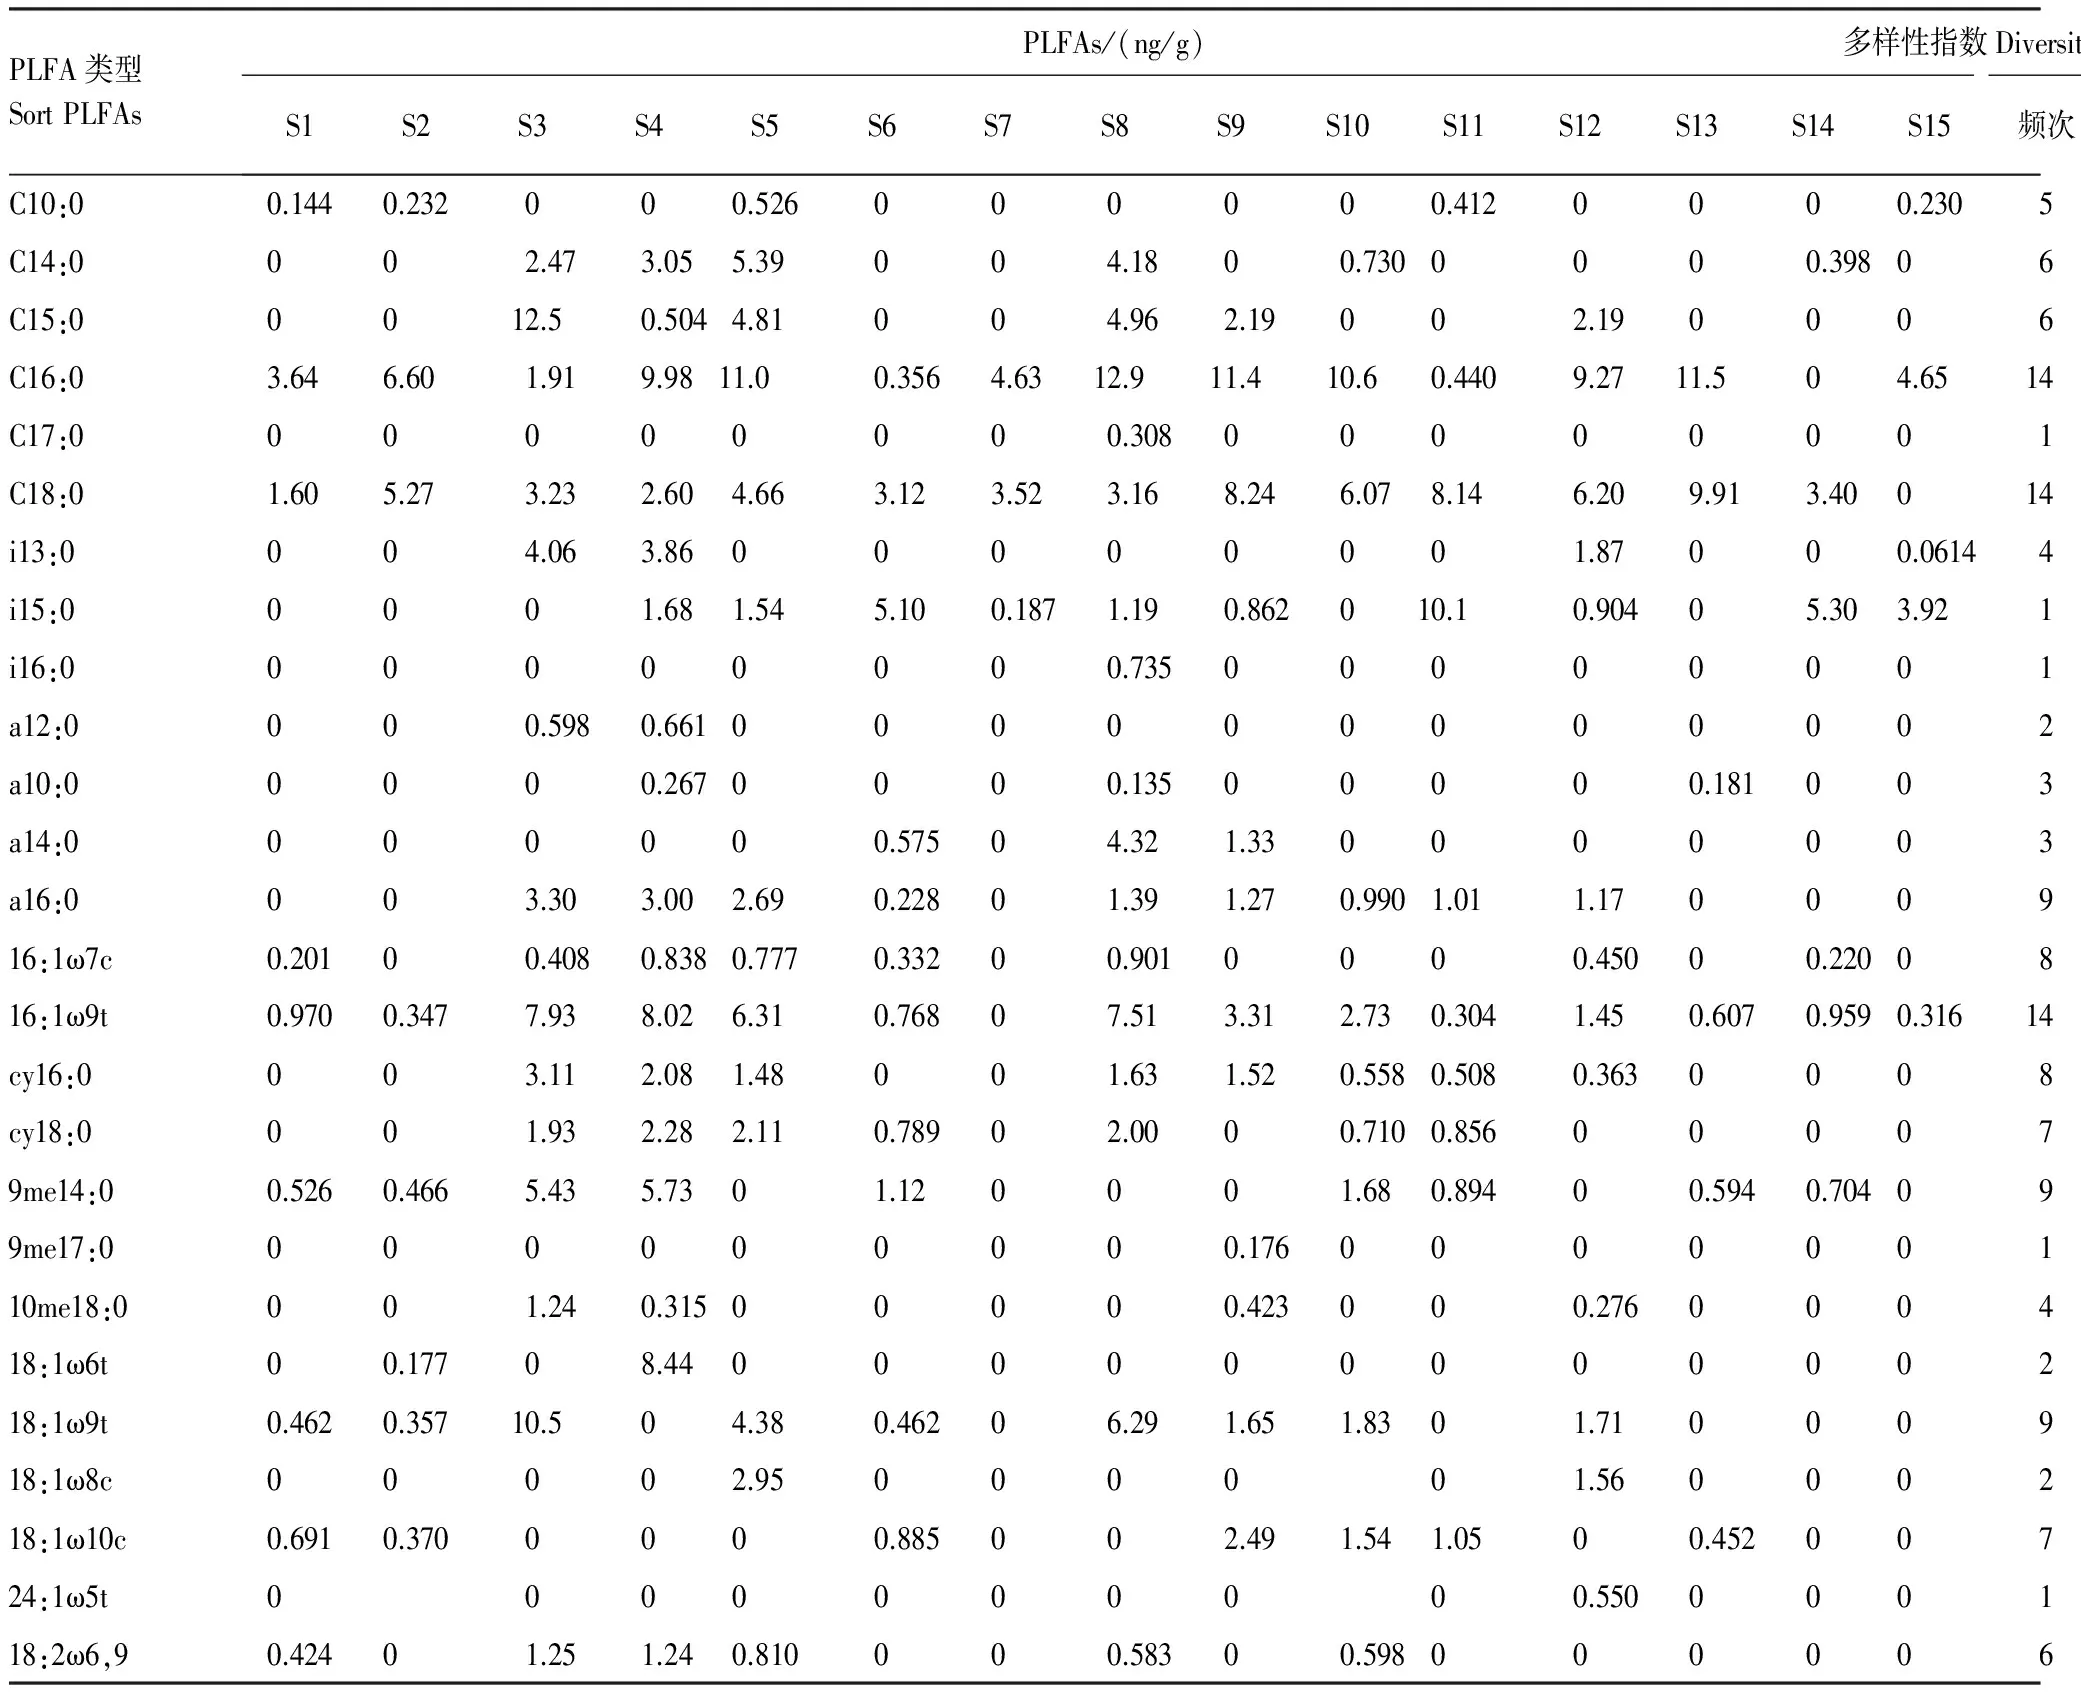
表2 土壤微生物磷脂脂肪酸(PLFAs)特征值及其生态参数
S1—S15: 样区;M: Margalef丰富度指数;H: Shannon-Wiener多样性指数;J: Pielou均匀度指数;Y: Simpson优势度指数
2.3 土壤微生物生态学特征
根据公式(1)—(4)计算土壤微生物PLFAs的各种生态学指数(表2)。各种PLFAs在样区出现的频次为1—14次;标记的生物量范围在0.176—98.9ng/g;Margalef (M)、Shannon-Wiener(H)、均匀度(J)、Simpson (Y)指数等生态学参数变化范围分别为0.802 —13.8、0.125—0.367、0.0385— 0.113、0.710— 0.999。依据特征指数,可将土壤微生物分为3个类群:第1类为高丰富度(M)、高频次(S)、高多样性指数(H),包括细菌PLFA类型如C10:0、C14:0、C16:0、C18:0、9me14:0;G+PLFA类型如i15:0、a16:0;G-PLFA如cy16:0、cy18:0、16:1ω9t、16:1ω7c、18:1ω9t和典型真菌18:2ω6,9;第2类为高M、低S、低H,包括放线菌PLFA如10me18:0、9me17:0和G+PLFA如a10:0、a14:0、i16:0;第3类为低M、低S、低H,如18:1ω6t、i13:0、a12:0。
2.4 土壤微生物生物量
以SAT、TBSAT、MONO、CYCLO 和PUFA的总和计算土壤微生物总生物量[22];以C10、C14:0、C15:0、C16:0、C17:0、C18:0;i13:0、i15:0、i16:0、a10:0、a12:0、a14:0、a16:0;16:1ω7c、16:1ω9t、18:1ω8c、18:1ω10c、18:1ω6t、18:1ω9t、24:1ω5t;cy16:0、cy18:0的总和计算细菌的生物量[23]。以i13:0、i15:0、i16:0、a10:0、a12:0、a14:0、a16:0的总和计算除放线菌之外的G+菌的生物量[21];以16:1ω7c、16:1ω9t、18:1ω8c、18:1ω10c、18:1ω6t、18:1ω9t 、24:1ω5t、cy16:0、cy18:0计算G-菌的生物量[24];以9me14:0、9me17:0、10me18:0的总和计算放线菌的生物量[25];以18:2ω6,9计算真菌的生物量[26];由图2可知,不同样区土壤微生物总生物量(∑PLFAs)范围在(8.34—59.9)ng/g,S7最少(8.34ng/g),S3最多(59.9ng/g)。其中,细菌是主要的微生物类群(7.71—52.0) ng/g;放线菌生物量范围(0—6.67)ng/g,S4最多(6.67 ng/g);真菌生物量在所有样区土壤中均最少(0—1.25) ng/g,60%的样区没有检测到真菌PLFAs;G-的生物量范围在(0—23.9)ng/g,S7最少,S3最多;G+的生物量范围在(0—11.1)ng/g,S11最多,S1、S2最少。
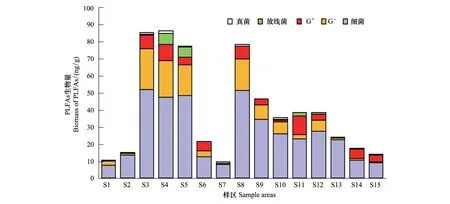
图2 不同微生物类群的磷脂脂肪酸(PLFAs)生物量Fig.2 Biomass of fatty acid groups in different soil samples
2.5 间接梯度分析
以土壤微生物PLFAs的浓度做主成分分析(PCA) (图3)。PC1解释变量的45.7%,PC2解释变量的16.9%。C14:0, 16:1ω9t, 16:1ω7c, a16:0, cy16:0, cy18:0, 18:1ω9t, C15:0, a12:0,i13:0,10me18:0, 9me14:0, 18:1ω6t, 18:1ω8, a14:0, a10:0等细菌的PLFAs类型与PC1正相关性;i15:0, C10:0, 18:1ω10与PC1负相关性。C16:0, C18:0, a10:0, 18:1ω10, 9me17:0, 24:1ω5t, C16:0等细菌PLFAs与PC2负相关。根据土壤微生物PLFAs的分布特征,15个样区可以分为4大类型:Ⅰ型,土壤微生物PLFAs种类占油田区总PLFAs类型的57.7%,如3和4样区。其中,9me14:0, 18:1ω6t, a12:0, i13:0, cy18:0, 16:1ω7c, a10:0, 10me18:0, C14:0, cy16:0, 18:1ω, 16:1ω9t等有较高的解释量;Ⅱ型,土壤微生物PLFAs种类占总PLFAs类型的30.8%,如5、8、9、10、12样区。其中,C15:0、18:1ω9t、C17:0、a14:0、18:1ω8c、C16:0、24:1ω5t、9me17:0具有较高的解释量。Ⅲ型,该区微生物PLFAs占PLFAs类型总数的7.69%6、如11、14、15样区。其中,C10:0、i15:0具有较高的解释量;Ⅳ型,土壤微生物PLFAs种类仅占总量的3.85%,如1、2、7、13样区。其中,18:1ω10具有较高的解释量。由此可知,不同样区土壤微生物PLFAs的组分有比较大的差异性。
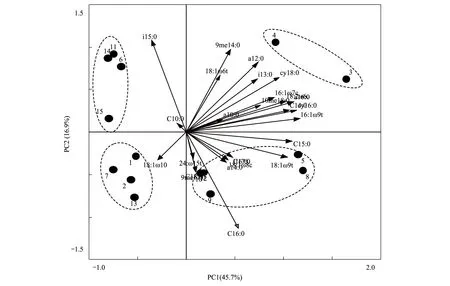
图3 不同样区土壤微生物磷脂脂肪酸的主成分分析(PCA)Fig.3 Biplots from principal component analyses (PCA) of the phospholipid fatty acids (PLFAs) in soil showing loadings of individual PLFAs and sample points of the individual plots along the first two principal components. ● 1—15样区: represent sample areas S1—S15
2.6 直接梯度分析
土壤微生物PLFAs载荷与土壤环境变量的冗余分析(RDA)。前两个轴分别解释变量的43.3%、26.9%(图4)。由图4可知,土壤环境因子,包括有机质含量(SOC)、pH、含水率(H2O) 电导率(EC)等和PAHs污染物是影响土壤微生物分布的2大因子。其中,SOC、pH、H2O对18:1ω9t、18:1ω6t、CY16:0、CY18:0、16:1ω9t 16:1ω7c、C14:0、a16:0、C15:0、a12:0、i13:0、10me18:0、9me14:0等的载荷量较高,呈正相关性;而PAHs和土壤EC 对C16:0、i15:0、18:1ω6t、18:1ω9c 、18:1ω8c、a10:0、24:ω15t、C17:0、9m17:0、a14:0;18:1ω10、C18:0;C10:0等PLFAs的载荷较高;同时可知:3、4样区在轴1和 轴2的载荷量均最大;土壤微生物受环境条件的影响较大,而PAHs和土壤EC对其影响较小。5、8、9、10、12样区在轴1上、轴2上的载荷均较大,环境条件和PAHs对微生物的影响均较大;1、2、6、7、11、13、14、15样区在轴2上有较高的载荷,表现为与PAHs和土壤EC有较高的相关性。结果说明,SOC、pH、H2O等环境因子对土壤微生物生长具有一定的促进作用,而PAHs和土壤EC对土壤微生物具有一定的抑制作用。由于微生物具有对环境的快速适应性特征,在污染物存或EC胁迫环境下(如,1、2、6、7、11、13、14、15样区)有新的适应性类型形成。
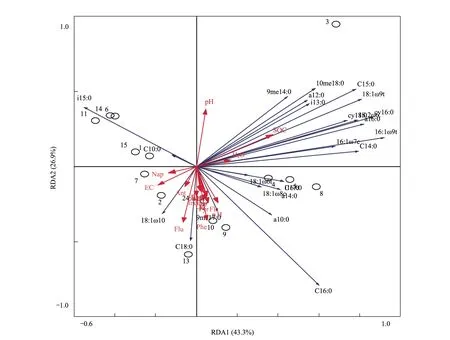
图4 土壤微生物磷脂脂肪酸冗余分析 Fig.4 Triplots from redundancy analysis (RDA) of the phospholipid fatty acids (PLFAs) in sample soils○1—15: 样区S1—S15
2.7 相关性分析

3 讨论
结果表明,在没污染和轻度污染的土壤中微生物PLFAs的种类和生物量均较高,但污染较为严重的S12、S9中微生物的种类和生物量并非最低,说明PAHs的污染浓度只是影响土壤微生物群落结构的一个因素。土壤PAHs的浓度梯度为S12 > S9 > S13 > S11 > S15 > S5 > S7 > S14 > S10 > S8 > S6 >S3 > S1 > S4 > S2。依据Maliszewska-kordybach[27]创建的PAHs污染土壤农用安全标准,S2、S4为未污染类型,S1、S3、S6、S8、S10、S14、S7、S5、S15、S11、S13属于轻度污染;S9属于中度污染;S12属于重度污染。低分子量的PAHs是该区土壤中主要的污染物类型。土壤微生物PLFAs种类梯度为S4 > S8 > S3> S5> S12 > S9 > S10、S6 > S11> S1> S2 > S13 > S14 > S15 > S7;PLFAs生物量梯度为S3 > S4 > S8 > S5 > S9 > S10、S12 > S11> S13> S2、S6 > S14 > S15> S1> S7。

表3 土壤微生物PLFAs种类和总量与不同PAHs相对含量的相关系数


PCA和RDA分析表明,PLFAs在不同样区之间差异较大,且不同种类的PAHs与大多数类型的PLFAs的载荷均表现为负相关,而与18:1ω9c 、18:1ω10、24:ω15t标识的G-,C10:0、C18:0、C16:0标识的细菌,9m17:0、a10:0、i15:0标识的G+的载荷表现为一定的正相关性。根据土壤土壤微生物与对土壤PAHs和土壤环境的响应情况,15个样区可划分为4种类型:(1) 土壤环境条件促进微生物生长,PAHs的胁迫解释量最小,主要包括3、4区;(2) 环境条件表现为一定程度的促进作用,但PAHs的胁迫解释量也较大,包括5、8、9、10、12区;(3) 环境和PAHs均表现为较高的胁迫解释量,包括2、7、13区。(4) PAHs污染胁迫解释量大于环境促进,包括1、6、11、14、15区;说明该区土壤微生物受污染物和土壤EC的双重胁迫,群落结构是对PAHs混合污染和环境条件SOC、pH、H2O的综合反应。相关影响机制还有待进一步探讨。
CYCLO/16:1ω7c、18:1ω8c;SAT/MONO的比值通常被用来标识土壤环境对微生物的胁迫作用,其值越高说明微生物所受的胁迫作用越大[29]。Cordova-Kreylos 等对加里福利亚滨海盐碱湿地土壤微生物群落结构的研究发现CYCLO与有机污染和重金属污染物有显著的正相关关系[30];文献[31]认为比值< 0.1时被视为健康值。该区土壤CYCLO/16:1ω7c、18:1ω8c 的比值范围在0—1.01,均值为0.2;SAT/MONO的比值范围在0—20.3,均值为4.9。与此相比,该比值均值很高。主要原因归因于该区土壤盐碱与污染并存,土壤微生物受到双重胁迫,与RDA分析结果一致。
土壤群落结构表现为:一般细菌 (56.3%) > G+(17.8%) > G-(17.5%) > 放线菌(4.1%) > 真菌(0.9%);G+类群通常被认为具有较高PAHs降解能力,G-菌群通常多是诱导分化的菌群[32]。G+/G-比值在不同样区之间差异较大,如S15(12.6),S14(4.5),S11(4.1),S6(1.8)其余样区均低于1。表明PAHs污染的盐碱土壤中细菌是微生物群落的建群种,并且,80%的样区以诱导分化的微生物为优势种群(G+/G-<1)。
各种生态指数可用来指示环境质量的变化[33-34]。一般情况下,在清洁或良好环境中,生物种类多样,个体数量相对较少;在环境恶化或污染胁迫下,敏感种类消失,耐性种类发展,种类单一,但个体数量可能很大。Margalef 提出能通过丰富度指数来判断区域污染程度[35]。丰富度指数是表示物种在系统中多寡的指标。一般情况下,环境污染水平越低或物种对环境的适应能力越强,丰富度指数就越高。该区26种PLFAs的丰富度指数范围在0.802—13.8,表明不同微生物类群对环境具有不同的适应性,其中,C16:0, C18:0标记的细菌;16:1ω9t标记的G-的丰富度指数最高(13.8),对该环境具有最高的适应能力。Shannon-wiener(H)多样性指数是基于物种数量反映系统中种类多样性的指标[36]。18:1ω9t标记的G-、9me14:0、a16:0、i15:0 标记的G+多样性指数最高(0.368),表明此类微生物土壤中数量最多;Pielou(J)均匀度指数反映不同环境条件对同种生物分布状态的影响或同种环境条件对不同种类生物的选择性。18:1ω9t、16:1ω7c、cy16:0标记的G-和9me14:0、a16:0、i15:0标记的G+均匀度指数较高,表明该环境对此类微生物具有较高的选择性。Simpson(Y)优势度指数反映各物种数量的变化情况,值越大,说明物种在系统内分布越不均匀,奇异度越高[37-38]。C17:0、24:1ω5t、9me17:0、i16:0优势度指数最高(0.999),标记的菌群在样区属稀有种类。
4 结论
(1) 土壤微生物对不同分子结构的PAHs有不同的响应。Phe、Ace 、Fla、 Pyr、 Chr 和Baa与PLFAs的种类和生物量均呈正相关性(r>0),表现为促进作用;Nap、Flu、Ant、Bkf、Bap和Ind与PLFAs的种类和生物量均呈负相关性(r<0),表现为抑制效应。
(2) PAHs污染盐碱土壤中微生物群落结构特征是PAHs混合污染与环境因子(pH、SOC、H2O和EC)共同作用的体现。该油田区土壤微生物分布可分为4种类型:PAHs对PLFAs的解释量小,而土壤因子对PLFAs的解释量大的类型(3、4样区);PAHs对PLFAs的解释量大,而土壤因子解释量小的类型(2、7、13样区);PAHs对PLFAs的解释量较大,土壤因子解释量也较大的类型(5、8、9、10、12样区);PAHs对PLFAs的解释量较大,而土壤因子对PLFAs的解释量较小的类型(1、6、11、14、15样区)。
[1] Gans J, Wolinsky M, Dunbar J. Computational improvements reveal great bacterial diversity and high metal toxicity in soil. Science, 2005, 309(5739): 1387- 1390.
[2] 宋长青, 吴金水, 陆雅海, 沈其荣, 贺纪正, 黄巧云, 贾仲君, 冷疏影, 朱永官. 中国土壤微生物学研究10年回顾. 地球科学进展, 2013, 28(10): 1087- 1105.
[3] Girvan M S, Campbell C D, Killham K, Prosser J I, Glover L A. Bacterial diversity promotes community stability and functional resilience after perturbation. Environmental Microbiology, 2005, 7(3): 301- 313.
[4] Loreau M. Linking biodiversity and ecosystems: towards a unifying ecological theory. Philosophical Transactions of the Royal Society (B: Biological Sciences), 2010, 365(1537): 49- 60.
[5] Balvanera P, Pfisterer A B, Buchmann N, He J S, Nakashizuka T, Raffaelli D, Schmid B. Quantifying the evidence for biodiversity effects on ecosystem functioning and services. Ecology Letters, 2006, 9(10): 1146- 1156.
[6] 张秋芳, 刘波, 林营志, 史怀, 杨述省, 周先冶. 土壤微生物群落磷脂脂肪酸PLFA生物标记多样性. 生态学报, 2009, 29(8): 4127- 4137.
[7] 秦晓, 唐景春, 张清敏, 高晶, 李德生. 两株真菌的分离及其在石油污染土壤修复中的作用. 农业环境科学学报, 2010, 29(10): 1999- 2004.
[8] Tang J C, Wang R G, Niu X W, Zhou Q X. Enhancement of soil petroleum remediation by using a combination of ryegrass (Loliumperenne) and different microorganisms. Soil and Tillage Research, 2010, 110(1): 87- 93.
[9] Liu J J, Liu G J, Zhang J M, Hao Y, Wang R W. Occurrence and risk assessment of polycyclic aromatic hydrocarbons in soil from the Tiefa coal mine district, Liaoning, China. Journal of Environmental Monitoring, 2012, 14(10): 2634- 2642.
[10] 鲁如坤. 土壤农化分析. 北京: 中国农业科技出版社, 2000: 179- 256.
[11] Bligh E G, Dyer W J. A rapid method for total lipid extraction and purification. Canadian Journal of Biochemistry and Physiology, 1959, 37(8): 911- 917.
[12] 焦海华, 刘颖, 金德才, 潘建刚, 黄占斌, 白志辉. 牵牛花对石油污染盐碱土壤微生物群落与石油烃降解的影响. 环境科学学报, 2013, 33(12): 3350- 3358.
[13] 白震, 何红波, 张威, 解宏图, 张旭东, 王鸽. 磷脂脂肪酸技术及其在土壤微生物研究中的应用. 生态学报, 2006, 26(7): 2387- 2394.
[14] 张金屯. 数量生态学. 北京: 科学出版社, 2003: 86- 106.
[15] 戈峰. 现代生态学. 北京: 科学出版社, 2002: 252- 254.
[16] EPA. Appendix A to 40 CFR. Part 423- 426 Priority Pollutants. http://www.epa.Gov/region01/npdes/permits/generic/priority pollutants.pdf, 2003.
[17] Federle T W. Microbial distribution in the soil-new techniques//Megusar F, Gantar M, eds. Perspectives in Microbial Ecology. Ljubljana, Slovenia: Slovene Society for Microbiology, 1986: 493- 498.
[18] O′Leary W M, Wilkinson S G. Gram-positive bacteria//Ratledge C, Wilkinson S G, eds. Microbial Lipids. London: Academic Press, 1988: 117- 201.
[19] Olsson P A. Signature fatty acids provide tools for determination of the distribution and interactions of mycorrhizal fungi in soil. FEMS Microbiology Ecology, 1999, 29(4): 303- 310.
[20] Klamer M, Bååth E. Microbial community dynamics during composting of straw material studied using phospholipid fatty acid analysis. FEMS Microbiology Ecology, 1998, 27(1): 9- 20.
[21] Frostegård A, Bååth E. The use of phospholipid fatty acid analysis to estimate bacterial and fungal biomass in soil. Biology and Fertility of Soils, 1996, 22(1/2): 59- 65.
[22] Wu Y P, Ma B, Zhou L, Wang H Z, Xu J M, Kemmitt S, Brookes P C. Changes in the soil microbial community structure with latitude in eastern China, based on phospholipid fatty acid analysis. Applied Soil Ecology, 2009, 43(2/3): 234- 240.
[23] Tunlid A, Hoitink H A J, Low C, White D C. Characterization of bacteria that suppressRhizoctoniadamping-off in bark compost media by analysis of fatty acid biomarkers. Applied and Environmental Microbiology, 1989, 55(6): 1368- 1374.
[24] Bossio D A, Scow K M. Impacts of carbon and flooding on soil microbial communities: phospholipid fatty acid profiles and substrate utilization patterns. Microbial Ecology, 1998, 35(3/4): 265- 278.
[25] Moeskops B, Buchan D, Sukristiyonubowo, de Neve S, de Gusseme B, Widowati L R, Setyorini D, Sleutel S. Soil quality indicators for intensive vegetable production systems in Java, Indonesia. Ecological Indicators, 2012, 18: 218- 226.
[26] Drenovsky R E, Elliott G N, Graham K J, Scow K M. Comparison of phospholipid fatty acid (PLFA) and total soil fatty acid methyl esters (TSFAME) for characterizing soil microbial communities. Soil Biology and Biochemistry, 2004, 36(11): 1793- 1800.
[27] Maliszewska-Kordybach B. Polycyclic aromatic hydrocarbons in agricultural soils in Poland: Preliminary proposals for criteria to evaluate the level of soil contamination. Applied Geochemistry, 1996, 11(1/2): 121- 127.
[28] 戴树桂. 环境化学. 北京: 高等教育出版社, 2006: 360- 366.
[29] Tornberg K, Bååth E, Olsson S. Fungal growth and effects of different wood decomposing fungi on the indigenous bacterial community of polluted and unpolluted soils. Biology and Fertility of Soils, 2003, 37(3): 190- 197.
[30] Córdova-Kreylos A L, Cao Y P, Green P G, Hwang H M, Kuivila K M, LaMontagne M G, Van De Werfhorst L C, Holden P A, Scow K M. Diversity, composition, and geographical distribution of microbial communities in California salt marsh Sediments. Applied and Environmental Microbiology, 2006, 72(5): 3357- 3366.
[31] Kaur A, Chaudhary A, Kaur A, Choudhary R, Kaushik R. Phospholipid fatty acid—a bioindicator of environment monitoring and assessment in soil ecosystem. Current Science, 2005, 89(7): 1103- 1112.
[32] Kästner M, Breuer-Jammali M, Mahro B. Enumeration and characterization of the soil microflora from hydrocarbon-contaminated soil sites able to mineralize polycyclic aromatic hydrocarbons (PAH). Applied Microbiology and Biotechnology, 1994, 41(2): 267- 273.
[33] Pringault O, Duran R, Jacquet S, Torréton J P. Temporal variations of microbial activity and diversity in marine tropical sediments (New Caledonia lagoon). Microbial Ecology, 2008, 55(2): 247- 258.
[34] Bossio D A, Scow K M, Gunapala N, Graham K J. Determinants of soil microbial communities: effects of agricultural management, season, and soil type on phospholipid fatty acid profiles. Microbial Ecology, 1998, 36(1): 1- 12.
[35] Margules C R, Stein J L. Patterns in the distributions of species and the selection of nature reserves: an example fromEucalyptusforestsin south-eastern New South Wales. Biological Conservation, 1989, 50(1/4): 219- 238.
[36] 滕应, 骆永明, 李振高. 污染土壤的微生物多样性研究. 土壤学报, 2006, 43(6): 1018- 1026.
[37] Machín-Ramírez C, Morales D, Martinez-Morales F, Okoh A I, Trejo-Hernández M R. Benzo[a]pyrene removal by axenic-and co-cultures of some bacterial and fungal strains. International Biodeterioration & Biodegradation, 2010, 64(7): 538- 544.
[38] Orliński R. Multipoint moss passive samplers assessment of urban airborne polycyclic aromatic hydrocarbons: concentrations profile and distribution along Warsaw main streets. Chemosphere, 2002, 48(2): 181- 186.
Analysis of the structure and distribution characteristics of the microbia community in saline-alkali soil contaminated with polycyclic aromatic hydrocarbons
JIAO Haihua1,2, ZHANG Shuzhen3, JING Xudong1, ZHANG Tong1, BAI Zhihui2,*
1DepartmentofBiologicalSciencesandTechnology,ChangzhiUniversity,Changzhi046011,China2ResearchCenterforEco-EnvironmentalSciences,ChineseAcademyofSciences,Beijing100085,China3SchoolofEnvironmentalScience,LiaoningUniversity,Shenyang110036,China
Polycyclic aromatic hydrocarbons (PAHs) are persistent organic pollutants included in the U.S. Environmental Protection Agency list of priority pollutants because of their toxic, mutagenic, and carcinogenic properties. PAHs have become increasingly prevalent in the soil environment as a consequence of anthropogenic activities. The microbial characteristics of soils are increasingly being considered as sensitive indicators of soil health because of the interrelationship among microbial diversity, soil quality, and ecosystem sustainability. The development of effective methods for studying the diversity, distribution, and behavior of microorganisms in soil habitats is essential for a broader understanding of soil health. Traditionally, the analysis of soil microbial communities has relied on culturing techniques that use a variety of culture media to maximize the recovery of diverse microbial populations. However, only a small fraction (<10%) of the soil microbial community has been accessible using this approach. To overcome these problems, other methods, such as the analysis of phospholipid fatty acids (PLFAs), have been utilized in an attempt to access a greater proportion of the soil microbial community. PLFAs are potentially useful signature molecules because of their presence in all living cells. In microorganisms, PLFAs are found exclusively in cell membranes. This finding is important because cell membranes are rapidly degraded and the component PLFAs are rapidly metabolized following cell death. Consequently, PLFAs can serve as important indicators of active, as opposed to non-living, microbe. Microbial species and biomass in saline-alkali soil contaminated with PAHs were investigated by PLFA analysis, in order to explore the effect of PAHs on the microbial community in saline-alkali soil contaminated with PAHs. The results showed that the distribution of PLFAs in soil can be divided into 4 types (I, II, III, and IV). In Type Ⅰ, the number of microbial PLFAs types in sample soils accounts for up to 57.7% of the total number of microbial PLFAs types, and PAHs in this case are least able to explain the changes of microbial community. In Type Ⅱ, the number of microbial PLFAs types in sample soils is up to 30.8%, and PAHs again provide little explanation regarding the changes of microbial community. In Type Ⅲ, the number of microbial PLFAs types in sample soils comprises up to 7.68%, and PAHs have an increasing effect on the changes of microbial community. In Type Ⅳ, the number of microbial PLFAs types in sample soils comprises only 3.85%, and PAHs have a marked influence on the changes of microbial community. Correlation analysis (Spearman) indicated that the types number, concentration, and diversity index of PLFAs are negatively correlated with the relative content of naphthalene, fluorene, anthracene, benzo[k]fluoranthene, benzo[a]pyrene, and indeno[1,2,3-cd]pyrene, and are positively correlated with acenaphthene, phenanthrene, fluoranthene, pyrene, and benzo[a]anthracene. These results provide a scientific foundation for ecological risk assessment and bioremediation technology of saline-alkali soil contaminated with PAHs.
phospholipid fatty acids (PLFAs); polycyclic aromatic hydrocarbons (PAHs); microbial community; saline-alkali soil; microbial diversity
国家“863”计划课题(2013AA06A205);国家科技重大专项课题(2014ZX07204-005);中国科学院环境生物技术重点实验室开放基金课题(EBT2013A001)
2015- 04- 23;
2016- 01- 12
10.5846/stxb201504230835
*通讯作者Corresponding author.E-mail: zhbai@rcees.ac.cn
焦海华,张淑珍,景旭东,张通,白志辉.油田区多环芳烃污染盐碱土壤活性微生物群落结构解析.生态学报,2016,36(21):6994- 7005.
Jiao H H, Zhang S Z, Jing X D, Zhang T, Bai Z H.Analysis of the structure and distribution characteristics of the microbial community in saline-alkali soil contaminated with polycyclic aromatic hydrocarbons.Acta Ecologica Sinica,2016,36(21):6994- 7005.
