百年尺度地球系统模式模拟的陆地生态系统碳通量对CO2浓度升高和气候变化的响应
2016-12-28彭静,丹利
彭 静, 丹 利
中国科学院大气物理研究所, 中国科学院东亚区域气候-环境重点实验室, 北京 100029
百年尺度地球系统模式模拟的陆地生态系统碳通量对CO2浓度升高和气候变化的响应
彭 静, 丹 利*
中国科学院大气物理研究所, 中国科学院东亚区域气候-环境重点实验室, 北京 100029
利用了加拿大地球系统模式CanESM2(Canadian Earth System Model of the CCCma)的结果,针对百年尺度大气CO2浓度升高和气候变化如何影响陆地生态系统碳通量这一问题,分析了1850—1989年间陆地生态系统碳通量趋势对二者响应,以及与关键气候系统变量的关系。结果表明,140年间,当仅仅考虑CO2浓度升高影响时,陆地生态系统净初级生产力(NPP)增加了117.1 gC m-2a-1,土壤呼吸(Rh)增加了98.4 gC m-2a-1,净生态系统生产力(NEP)平均增加了18.7 gC m-2a-1。相同情景下,全球陆地生态系统的NPP呈显著增加的线性趋势(约为0.30 PgC/a2), Rh同样呈显著增加线性趋势(约为0.25 PgC/a2)。仅仅考虑气候变化单独影响时,NPP平均减少了19.3 gC/m2,土壤呼吸减少了8.5 gC/m2,NEP减少了10.8 gC/m2。在此情景下,整个陆地生态系统的NPP线性变化趋势约为-0.07 PgC/a2(P<0.05),Rh线性变化趋势约为-0.04 PgC/a2(P<0.05)。综合二者的影响,前者是决定陆地生态系统碳通量变化幅度和空间分布的最重要影响因子,其影响明显大于气候变化。值得注意的是,CanESM2并没有考虑氮素的限制作用,所以CO2浓度升高对植被的助长作用可能被高估。此外,气候变化的贡献也不容忽视,特别是在亚马逊流域,由于当温度升高、降水和土壤湿度减少,NPP和Rh均呈显著减少趋势。
耦合模式;CO2生理效应;净初级生产力(NPP);土壤呼吸(Rh);净生态系统生产力(NEP);温度;降水;土壤湿度
近100年来大气中CO2浓度显著上升,其变化速率超过过去42万年前任何时候的CO2浓度的增加速率[1]。这种变化直接影响植被光合过程,改变局地甚至全球碳循环的时空格局[2- 5]。一方面,改变了陆-气间中CO2通量交换[3];一方面,促进了植被光合作用[6],引起了陆-气间碳交换和碳储量的改变[7-9]。例如,CO2浓度增加使得气孔阻力增大,植被叶片气孔不同程度的关闭[10],引起了植被蒸腾速率降低[11-12],光合速率显著提高[4],这一变化直接改变了植被的碳储量。另一方面,作为最重要的温室气体,大气中CO2浓度通过扰动地球辐射平衡(被量化为辐射强迫)[13],而引起温度、降水、云量、风速和相对湿度等气候因子的变化[14-17]。这些气候因子反过来又会改变陆地-大气之间的碳交换和碳通量[5,7,18-19]。IPCC第四次评估报告[20]明确指出,大气中CO2浓度正以1.2—1.8 μL L-1a-1的速度增长,21 世纪末可能会增加到540—970 μL/L。因此,有必要考虑未来气候变化中CO2浓度快速增加时,陆地生态系统碳通量响应的大小和分布格局。
人类活动引起的CO2浓度上升对陆地生态系统碳通量的影响可归纳为两个主要方面:(1)辐射强迫引起的气候扰动产生的间接作用;(2) 植被引起的生理强迫产生的直接作用。例如通过影响叶片气孔影响陆地-大气间CO2交换[21]。由于全球和区域尺度的陆地生态系统与大气相互作用的复杂性,采用模型输出结果与相关气候和生态资料进行对比分析也是目前常用的一种手段,如Dan等, Piao等, Beer等和Randerson等[18,22-25]。Arora等的研究表明,加拿大地球系统模式CanESM2(Canadian Earth System Model of the CCCma)在全球和区域尺度碳循环变量结果合理,其中净初级生产力(NPP)空间格局和大小均有很好的表现。Arora 和Boer使用人为CO2排放量和土地覆盖数据为外强迫驱动气候系统模式CanESM2,分析了陆地生态系统碳储量的年际变化和空间分布特征[26]。国际耦合模式比较计划(CMIP5, Coupled Model Inter-comparison Project)中的多数模式也能用于模拟生态系统碳通量,如基于我国的Flexible Global Ocean-Atmosphere-Land System model (FGOALS) 耦合模式分析了净初级生产力(NPP)和净生态系统生产力(NEP)对大气CO2浓度变化的时空响应[27]。
目前,我国关于气候与全球碳循环相互作用的研究多为offline下模拟结果。百年尺度CO2浓度升高情景下,地球系统的物理、化学和生物等不同过程相互作用中,气候与碳的作用机制的研究仍存在较大的不确定性和时空差异[28]。陆地生态系碳通量动态趋势变化是碳循环研究的重要内容之一,这是因为它是陆地生态系统对全球变化的最直接体现,并且会对气候产生反馈作用。本文利用地球系统模式(Earth System Model, ESM) CanESM2,研究气候和碳循环过程的反馈,用指定的大气CO2浓度强迫ESM。这有别于以往的大气环流模式与动态植被模型的耦合的CO2倍增试验[29]。这是由于ESM中引入了生物地球化学循环过程,以便在全球范围研究碳收支、碳通量和生态系统功能的变化,定量评估气候和生物地球化学循环的反馈[30]。因此,本文从全球和区域角度,利用地球系统模式CanESM2结果,分析大气中CO2浓度升高和气候变化对陆地生态系统碳通量趋势大小和空间格局的影响。
1 研究区域和数据来源
1.1 研究区域
为了分析区域的响应特征,Giorgi和Francisco根据气候条件和地理环境相近的原则,将全球陆地生态系统划分为21个区域,其中去掉南极洲和80°N以北的区域[31-33](图 1和表1)。这种方法简单、易操作,目前已经被广泛的应用于基于气候系统模式结果的区域的划分和特征分析中。利用了这种方法,从区域角度分别探讨陆地生态系统碳通量对大气中CO2浓度升高和气候变化两个过程的响应特征。
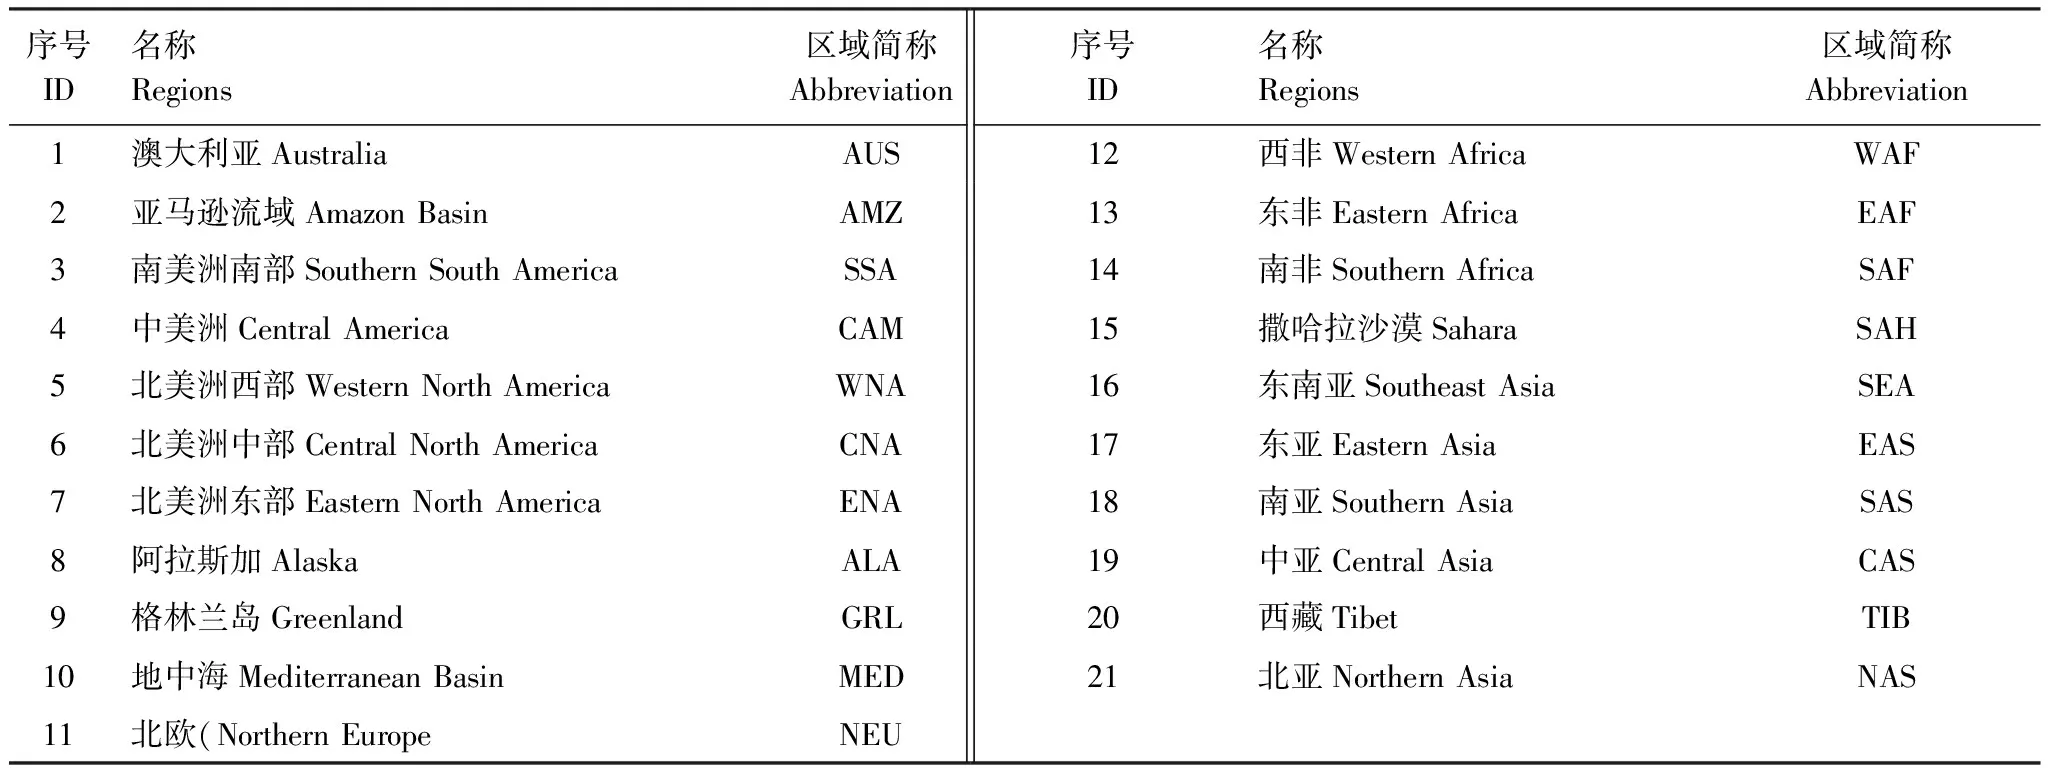
表1 全球陆地生态系统分区
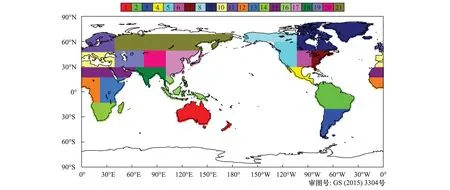
图1 21个区域空间分布Fig.1 Spatial distribution maps of 21 regions
1.2 数据和试验
为了定量评估大气中CO2浓度升高和气候变化对陆地生态系统碳通量的影响,选择了由多模式比较计划(CMIP5)释放的CanESM2模式结果(http://pcmdi3.llnl.gov/esgcet/home.htm)[34]。CanESM2产品是CMIP5最早释放的完整耦合了碳循环过程的气候系统模式产品,是由加拿大气候模拟和分析中心设计的碳-气候耦合地球系统模式的输出结果。在这个模式里,设计者充分考虑了陆地-大气-海洋-陆冰-海冰的相互作用过程。模式不仅包括了比较完善的生物物理过程,而且引入了生物地球化学过程,可以定量模拟整个陆地生态系统和大气圈之间的碳通量交换。模式资料的分辨率为2.185°(纬度)×2.185°(经度)。采用的数据是模式在达到稳定平衡后又运行140a的模式结果。其中,陆面模式CTEM被耦合到加拿大气候模式(CCM)的陆面方案(CLASS)中。从植被功能型(PFTs)的角度,根据气候关系模式包括了9种PFTs,具体为常绿针叶林、落叶针叶林、常绿阔叶林、寒带落叶阔叶林、耐旱落叶阔叶林、C3作物、C4作物、C3草本和C4草本。模型还包括了完整的碳循环过程,碳库主要分配在植物叶片、茎、根、凋落物和土壤中[2]。CanESM2并没有考虑土地利用和地表覆盖的变化对碳吸收和释放的作用,即模式忽略了二者变化对植被物理和生物化学过程的影响[3]。
所涉及的试验包括CMIP5所设计的1组核心试验(M1)和2组外围试验(M2和M3), 试验积分140a。在完全耦合试验M1中,大气中CO2浓度从工业革命前水平,以1%的速率增至4倍水平,CO2辐射强迫和生物地球化学强迫计算对应于CO2浓度的变化,在这组试验中,同时考虑了CO2浓度升高和气候变化的共同影响。在试验M2中,虽然大气中CO2浓度以同样的速率保持增加,大气模块中的辐射强迫的计算对应于工业革命前的CO2浓度水平,相比较,生物地球化学模块的计算则对应于大气CO2浓度的变化,这组试验只考虑了CO2浓度升高对陆地生态系统碳通量的影响,而忽略了气候变化的影响。在试验M3中,大气CO2浓度以同样地速率保持增长,但生物地球化学模块的计算固定为工业革命前大气CO2浓度水平,CO2辐射强迫计算则对应于大气中CO2浓度从工业革命前水平以1%的速率增至4倍水平。基于上述3组试验结果,分析大气中CO2浓度升高和气候变化对陆地生态系统碳通量的趋势大小和分布格局的影响。
2 结果与分析
2.1 陆地生态系统碳通量的年际变化
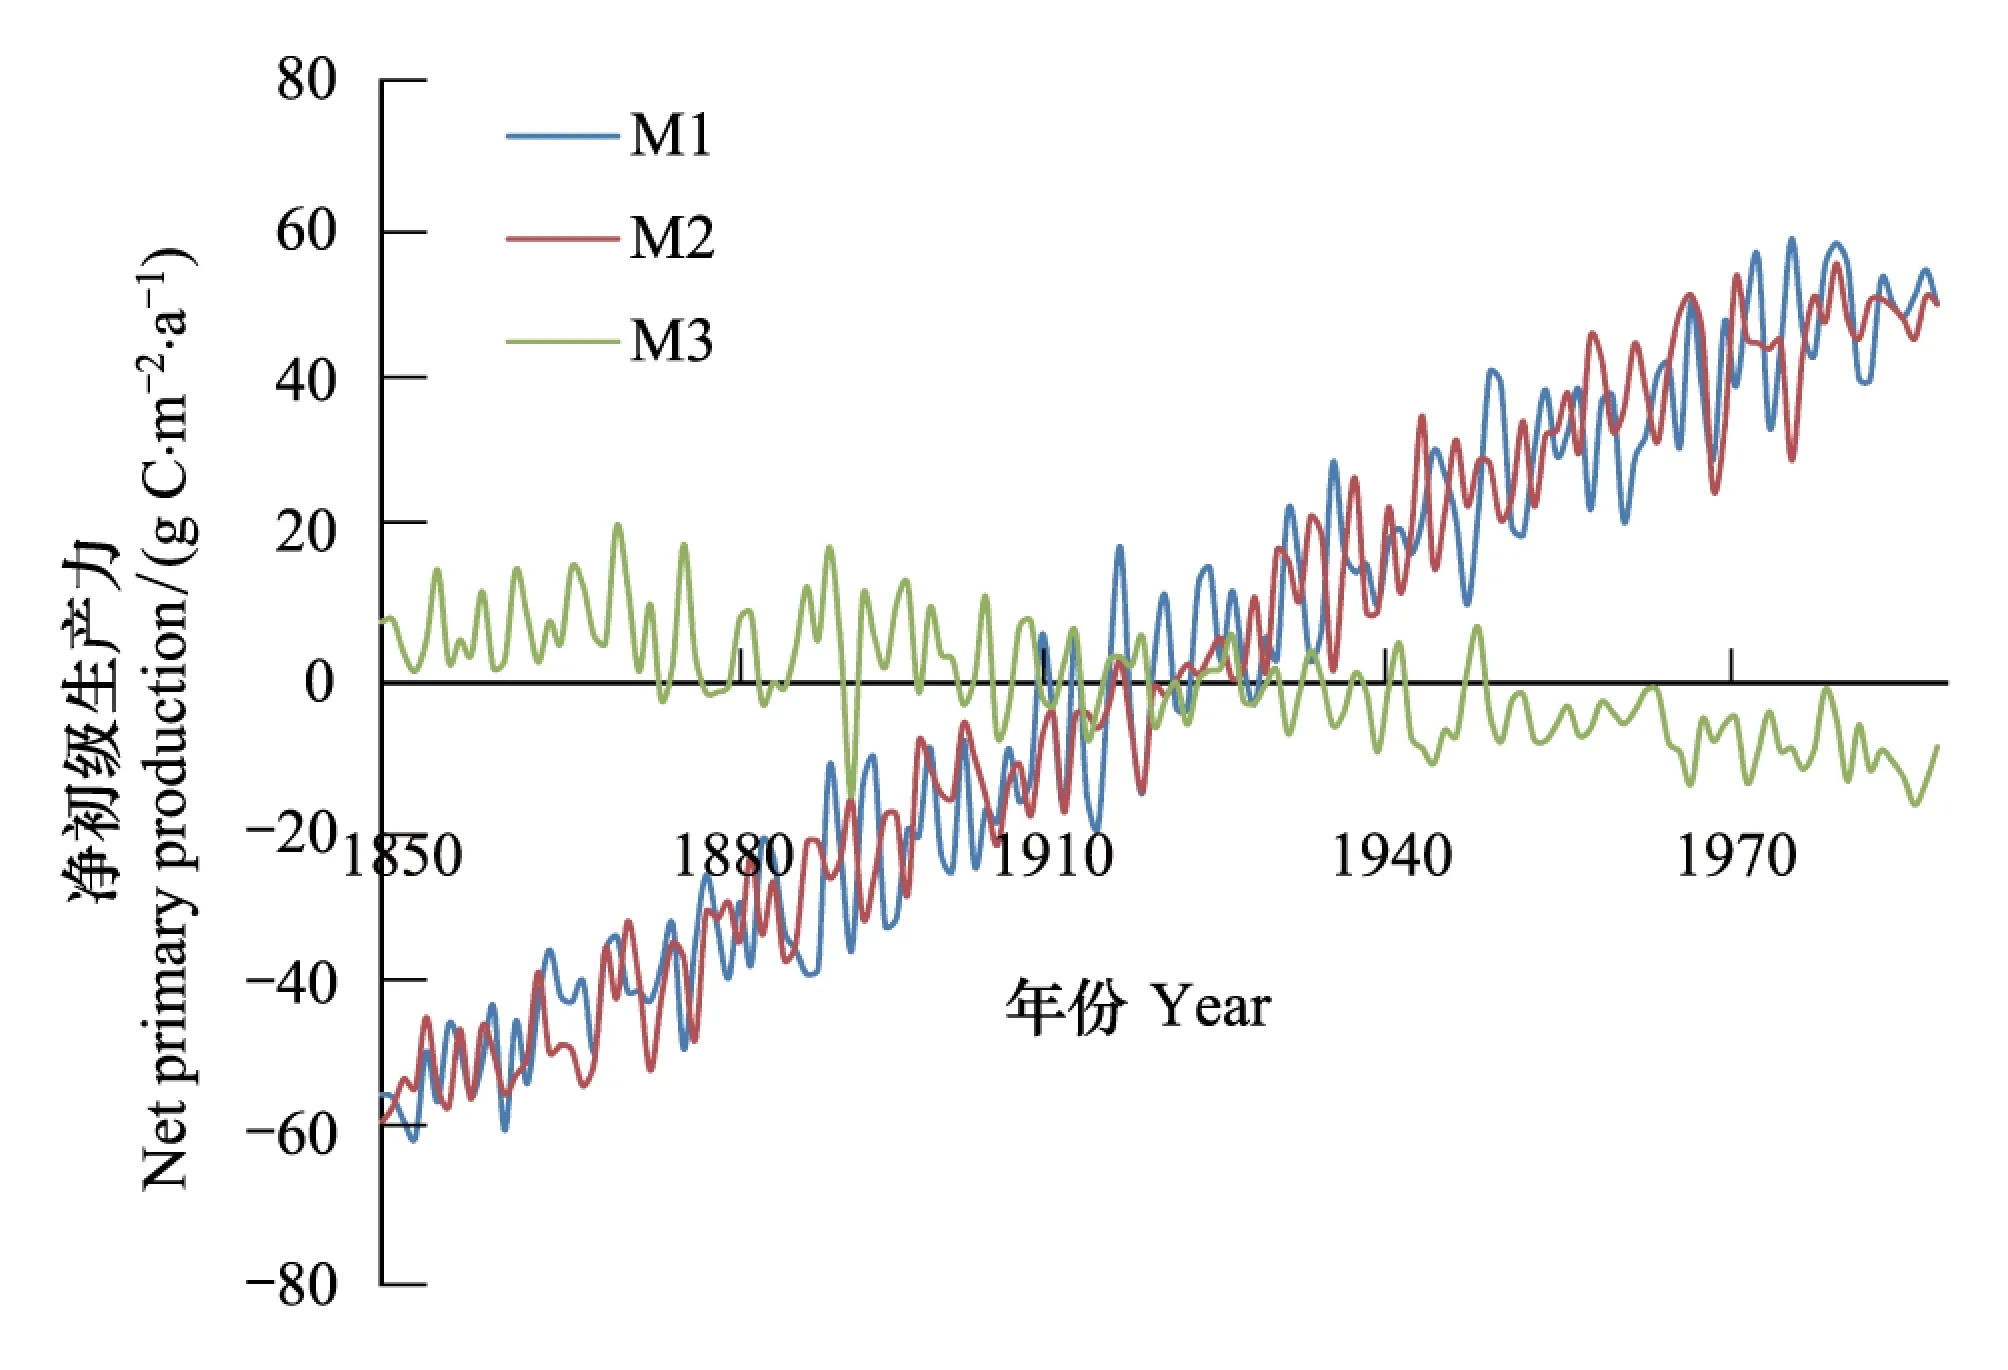
图2 1850—1989年间陆地生态系统平均净初级生产力变化 Fig.2 Annual averaged changes in net primary production (NPP) of terrestrial ecosystems during the period from 1850—1989试验M1表征CO2辐射强迫和生物地球化学强迫共同的影响;试验M2表征仅仅考虑大气中CO2生物化学强迫的影响;试验M3表征仅仅考虑大气CO2浓度辐射强迫的影响
在1850—1989年的140年间,大气中CO2浓度升高背景下试验M2结果表明:陆地生态系统年平均净初级生产力(NPP)呈显著上升趋势(P<0.01),NPP增加了117.1 gCm-2a-1(图2),整个陆地生态系统NPP线性趋势约为0.30 PgC/a2(P<0.05)。但试验M3中,当仅仅考虑气候变化的影响,NPP呈减少的趋势,其显著水平达到了5%,全球陆地生态系统的NPP线性变化趋势约为-0.07 PgC/a2(P<0.05)。在试验M1中,同时考虑了CO2浓度升高和气候变化的影响,NPP上升趋势表现显著。综合比较,当仅仅考虑CO2浓度升高时碳循环反馈(试验M2)时,净初级生产力(NPP)趋势与同时考虑CO2浓度升高和气候变化的共同影响(试验M3)的结果相接近。这是由于大气中CO2升高产生植被生理强迫对NPP增加的贡献明显大于气候变化的影响,是NPP增加的主要驱动因子。这一结论得到已有研究的印证,例如Arora等[3]和Piao等[18]结果均表明在全球尺度上大气中CO2浓度升高对NPP的影响要明显大于气候变化的影响。
相比较,由于大气中CO2浓度升高,陆地生态系统年平均土壤呼吸(Rh)同样上升趋势显著(P<0.001),以0.70 gC m-2a-2的速度增加(图3),全球Rh线性趋势约为0.25 PgC/a2。这表明,植被生物量的增加使得输入到土壤中的有机碳增加,进而引起土壤呼吸的增加。此外,由于气候变化的影响(试验M3),陆地生态系统年平均Rh呈减少趋势(P<0.05),平均每年变化速度为-0.06 gC m-2a-2,整个陆地生态系统Rh总线性趋势约为-0.04 PgC/a2。这种减少是由不同区域共同作用的结果。温度上升对不同区域Rh的影响不尽相同(图6):对北半球中高纬度地区,温度升高,微生物活性增加,土壤有机碳在土壤驻留时间缩短,Rh呈增加趋势;对于低纬度地区,微生物活性和有机碳在土壤中驻留时间对温度并不敏感[17],Rh呈减少趋势。这些区域的Rh的减少超过了北半球中高纬度地区Rh的增加,进而引起了全球平均Rh的减少。当同时考虑到大气CO2浓度和气候变化共同贡献时,Rh上升趋势显著(P<0.01),平均每年变化速率0.75 g C m-2a-1。
陆地生态系统NEP的趋势并不像NPP和Rh那样明显,当仅仅考虑CO2浓度变化时,NEP呈上升趋势,年平均增加速度为0.13 gC m-2a-2,全球陆地生态系统NEP总的线性趋势约为0.04 PgC/a2。当仅仅考虑到气候变化影响时,NEP呈减少趋势,变化速率为-0.08 gC m-2a-2,NEP线性趋势约为-0.02 PgC/a2。当同时考虑二者共同影响时,NEP的趋势不明显,变化速率为0.08 g C m-2a-2,全球陆地生态系统的NEP线性趋势约为0.02 PgC/a2(图4)。
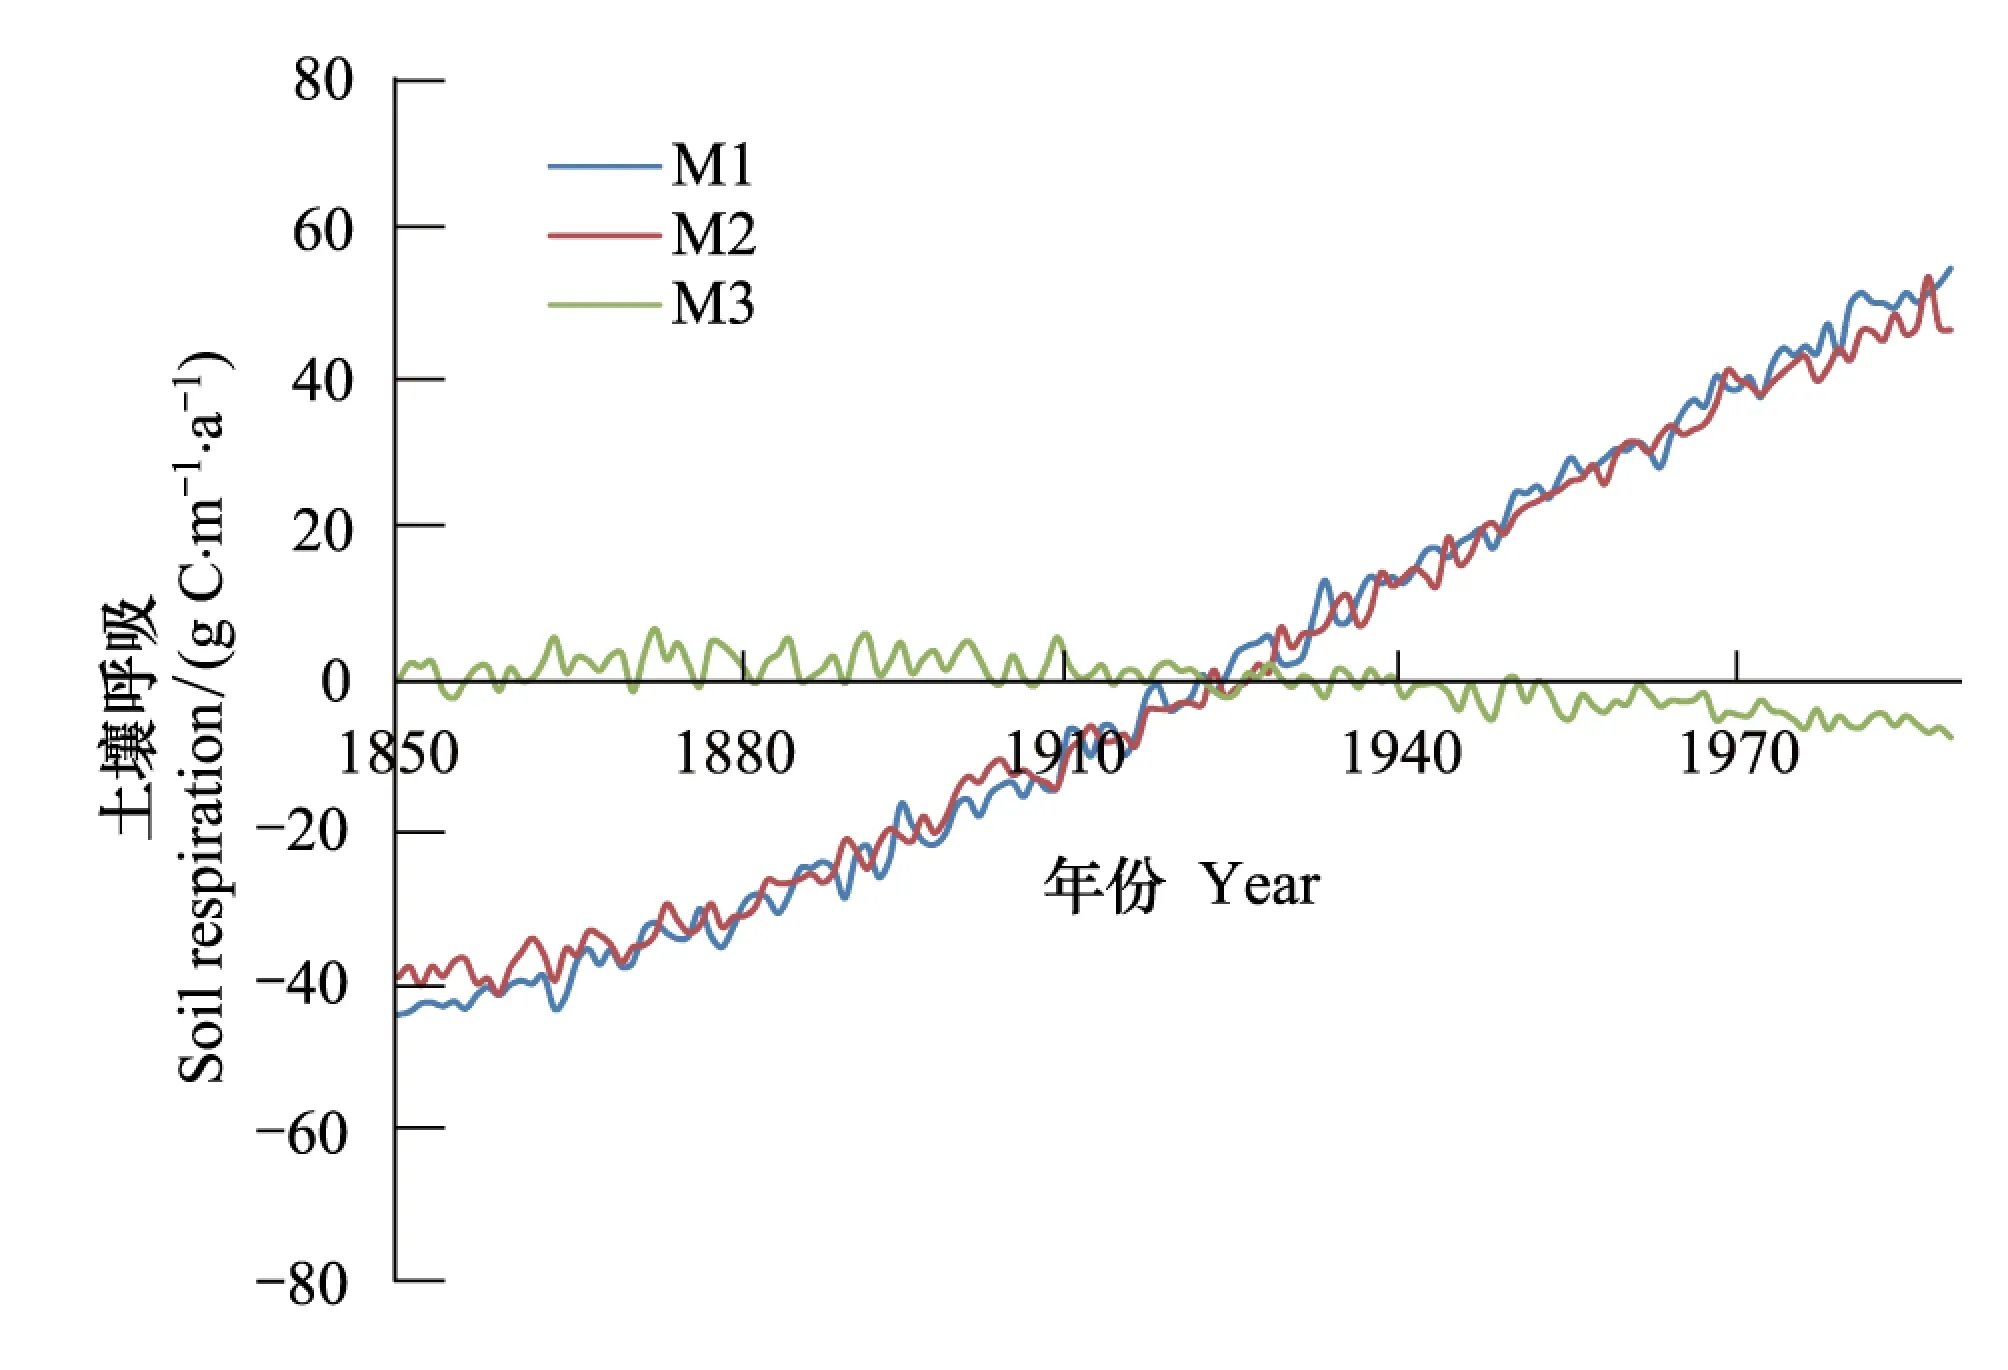
图3 1850—1989年间陆地生态系统平均土壤呼吸变化 Fig.3 Annual averaged changes in soil respiration (Rh) of terrestrial ecosystems during the period from 1850—1989
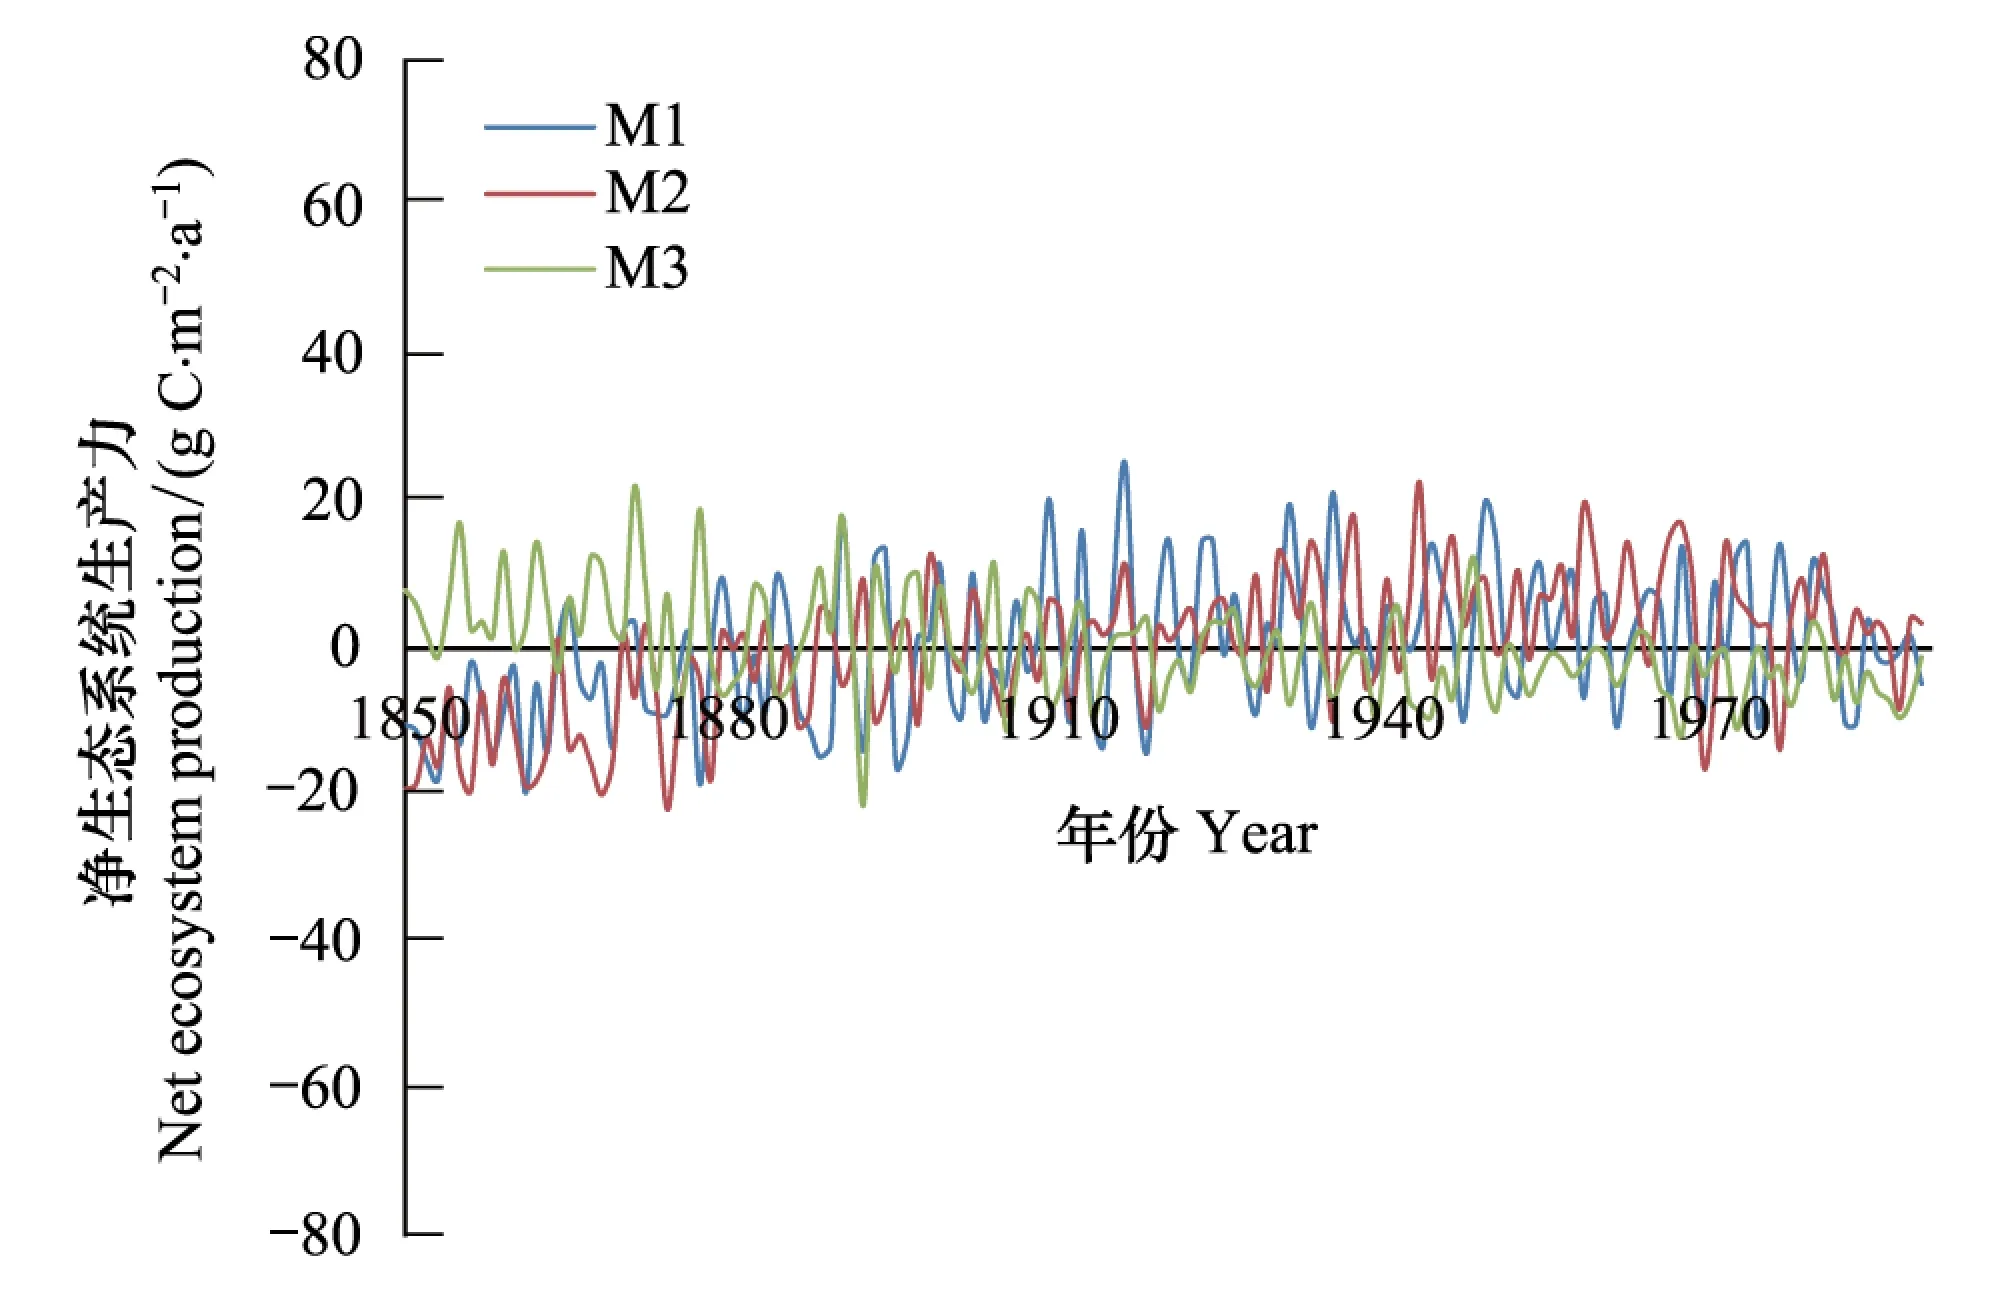
图4 1850—1989年间陆地生态系统平均净生态系统生产力变化Fig.4 Annual averaged changes in net ecosystem production (NEP) of terrestrial ecosystems during the period from 1850—1989
2.2 陆地生态系统碳通量空间变化趋势
2.2.1 NPP空间分布
1850—1989年间,当仅仅考虑大气中CO2浓度变化的影响时,陆地生态系统绝大部分区域NPP呈显著上升趋势。大气中CO2浓度增加对植被的助长作用使得全球平均线性增加趋势为0.8 gC m-2a-2(P<0.05) (图5),这与Piao等的结果相近(1.6 gC m-2a-2)。大气中CO2浓度升高产生生理强迫引起NPP显著增加的观点已被所印证[35-36]。北美洲东部、南非、西非、南亚和东南亚等地区增幅较大,增加的速率超过了3.4 gC m-2a-1(P<0.05),而格陵兰岛、撒哈拉沙漠和青藏高原等植被稀少区域增幅较小,变化速率不足0.1 gC m-2a-1。另一方面,NPP的变化趋势在阿拉斯加呈负值,即表明该区域的NPP呈减少趋势。
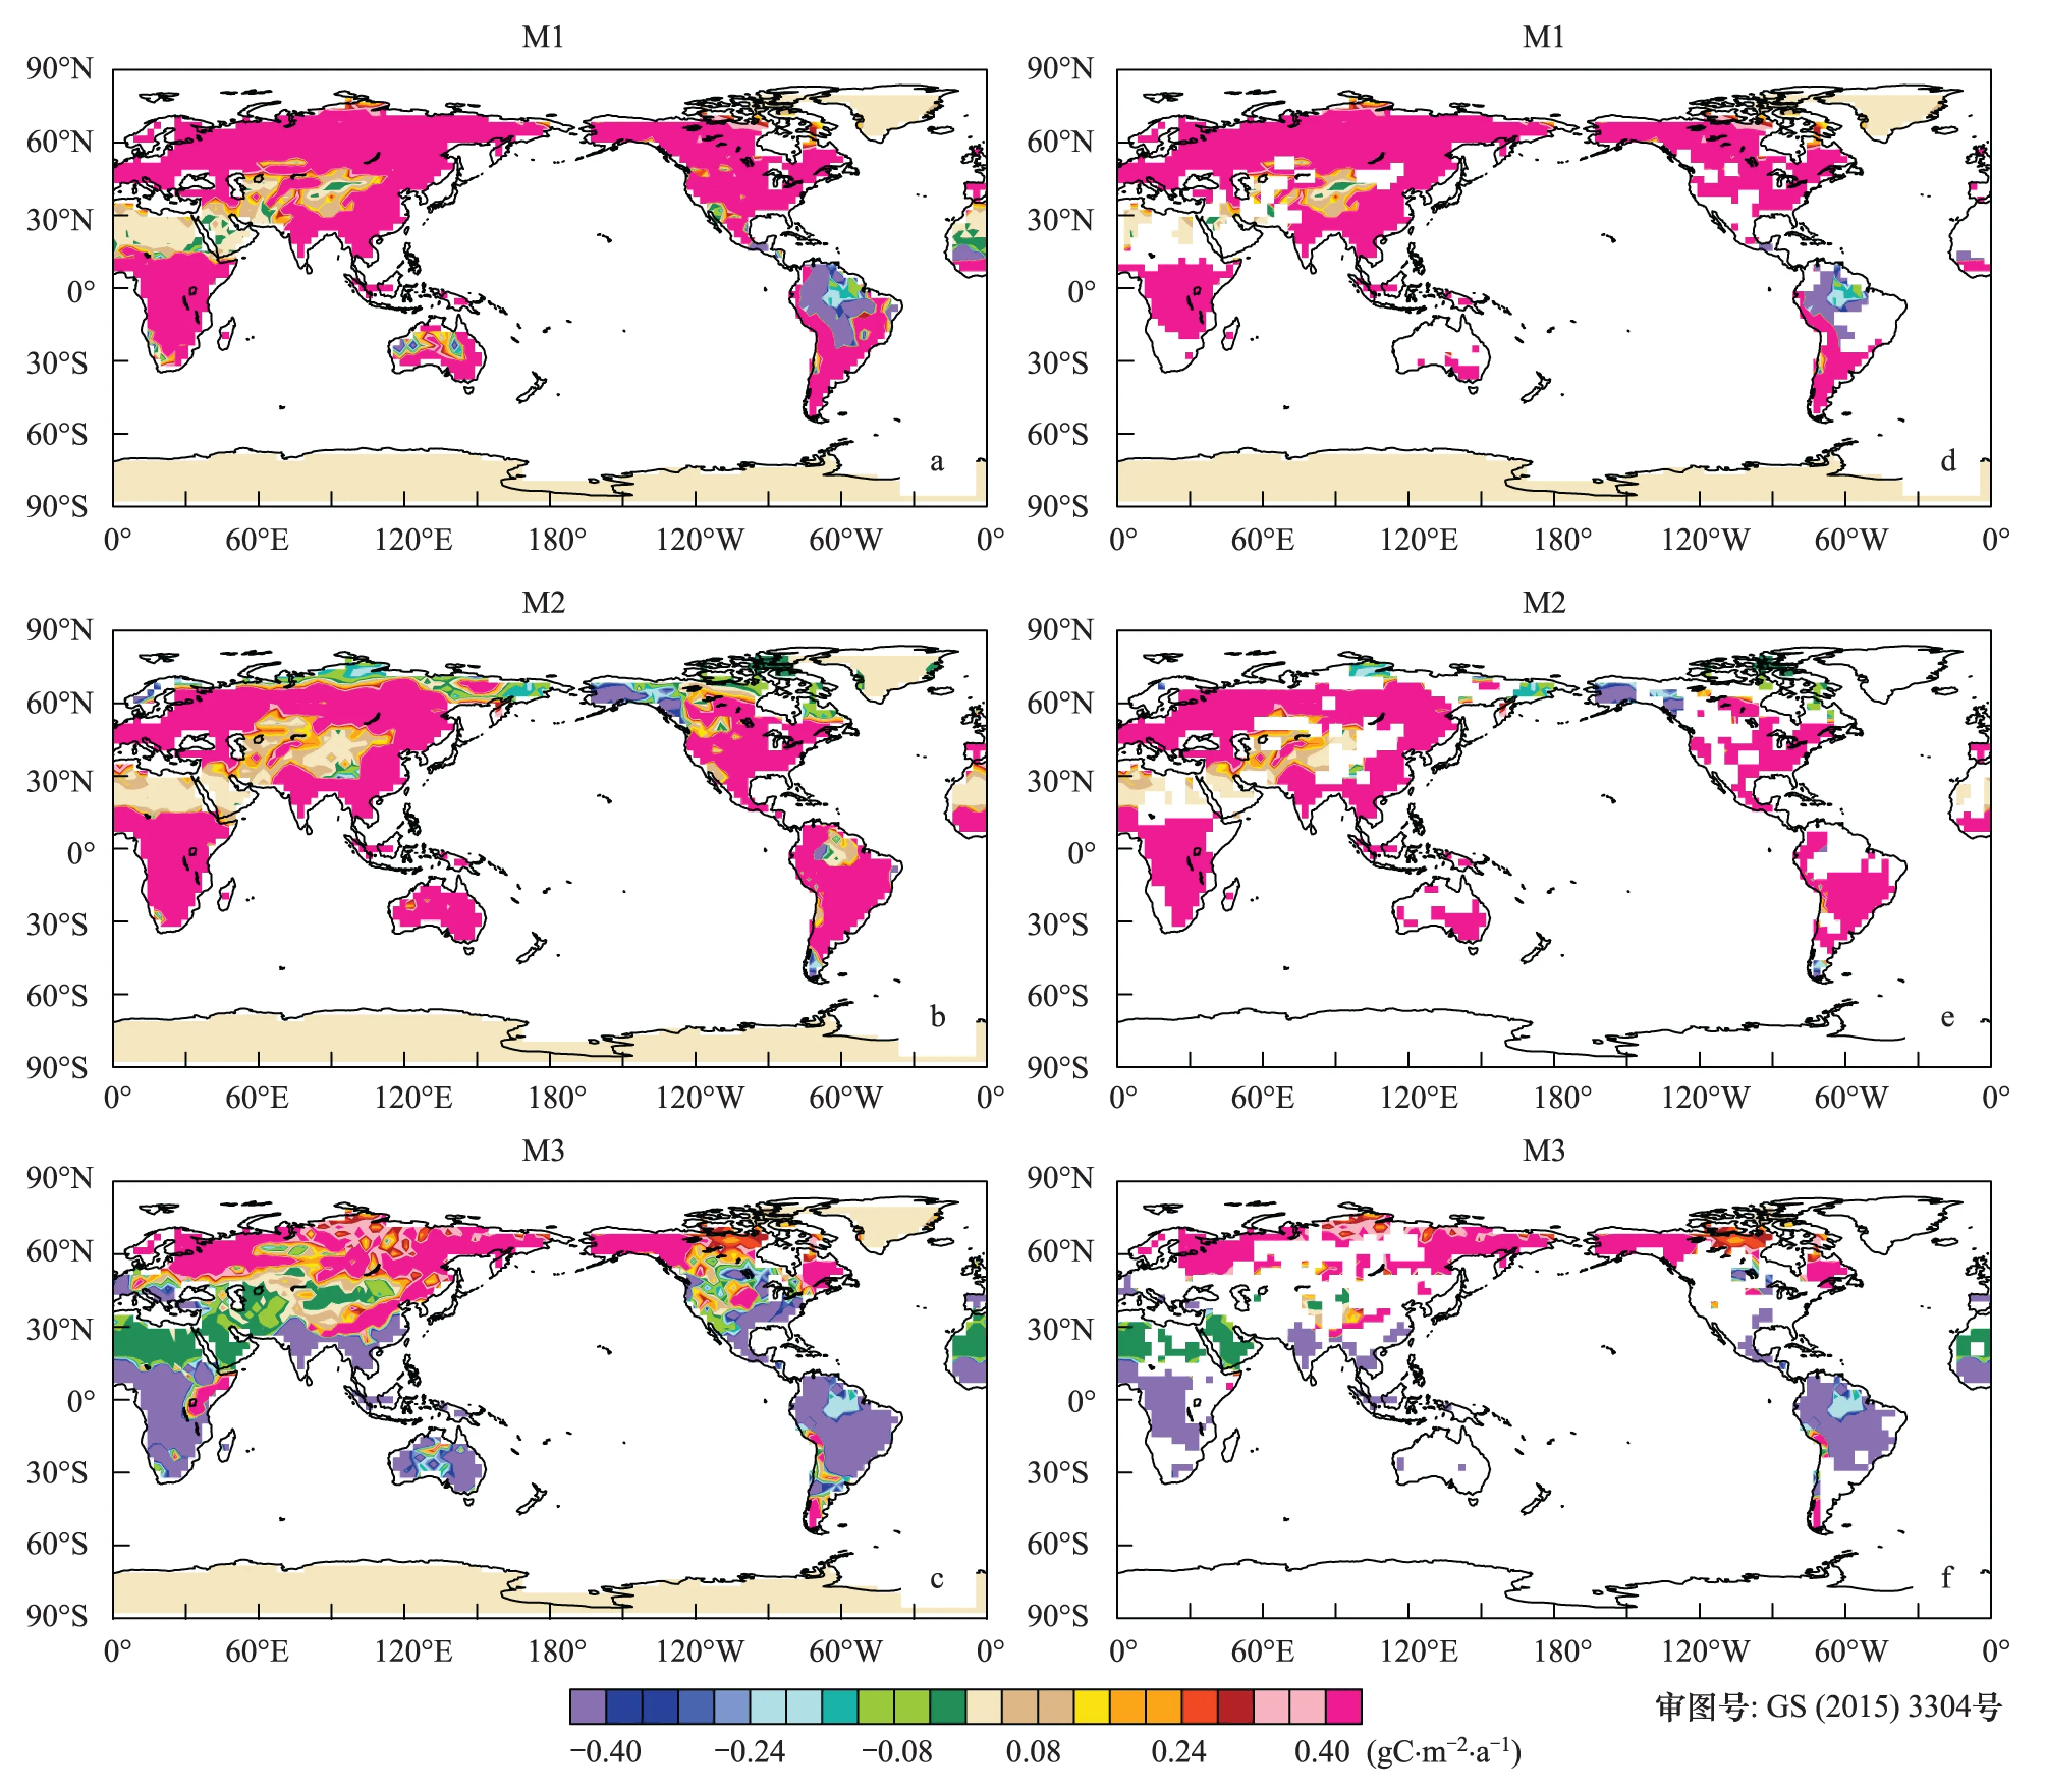
图5 净初级生产力变化趋势空间分布(a—c);(d—f)通过5%显著水平Fig.5 Spatial distribution of the trend in NPP (a—c); The trends in the (d—f) have been filtered for significance at the 0.05 level
1850—1989年间,不同区域的NPP对单独的气候变化的响应方式和强度存在明显的空间差异。在南半球和中低纬度地区绝大区域,其中包括亚马逊流域、西非、东南亚和中美洲等区域,由于气候变化的影响,NPP显著减少,其中,亚马逊流域减少速率明显快于其它区域,表明在温度相对较高区域的增暖增加了这些区域向大气中释放更多碳的风险。在此期间,北半球中高纬度地区,例如北美洲西部、北美洲东部、格陵兰岛、欧洲北部、东亚、北亚和阿拉斯加等区域,NPP增加趋势显著。另外在海拔相对较高的区域,例如青藏高原,NPP也呈显著的增加趋势(P<0.05),变化速率为0.03 gC m-2a-1。根据Christidis et al的研究成果[37],温度限制区域例如北半球中高纬度和高海拔区域,温度升高可延长植被生长季[38],增强植被光合速率,增加植被有机物累积[39]。
此外,同时考虑CO2浓度和气候共同影响时,南非、北美洲东部、南亚、东亚和东南亚等区域的NPP值呈显著的增加趋势,增加速率超过了2.90 gC m-2a-1(P<0.01)。我国的东部、北部NPP同样增加显著(P<0.05)。在亚马逊流域,NPP值呈显著减少的趋势(-1.8 gC m-2a-2)。
2.2.2 Rh空间分布
由图7可知,140年间,试验M2结果表明:陆地生态系统绝大部分区域土壤呼吸(Rh)呈增加趋势,这种变化与NPP一致,植被活动增强有利于Rh增加。相应的140年间,由于气候变化的影响(试验M3),陆地生态系统Rh呈现显著的空间差异(图6)。北半球中高纬度和高海拔地区,由于气候变化影响,Rh为增加趋势,其中北美洲东部、北欧、阿拉斯加、北亚和东亚等区域,Rh值呈显著的增加趋势。在这些区域,Rh变化速率明显快于NPP的变化速率。有研究表明,温度生个引起了北半球高纬度和高海拔地区冻土融化和面积减少[40],造成了原先被冻结的碳重新被微生物呼吸利用[41],导致了土壤呼吸显著增强。与之相比较,亚马逊流域、中美洲、西非和南亚等区域Rh值呈显著减少的趋势(P<0.05)。当同时考虑二者的共同影响时(试验M1),北半球中高纬度地区响应方式与仅考虑大气中CO2变化和仅考虑气候变化影响方式一致,其中Rh增加趋势在东南亚、北美洲的东部、南非和东亚等区域最为显著,而在低纬度地区例如亚马逊区域,Rh变化趋势呈负值(-1.6 gC m-2a-2)。
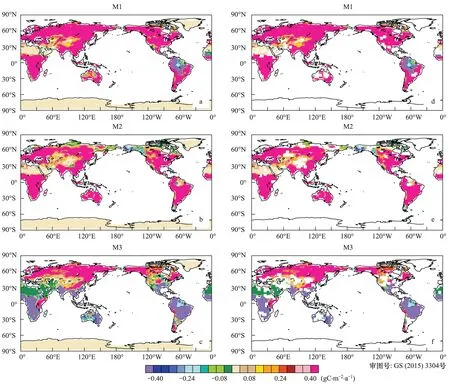
图6 土壤呼吸变化趋势空间分布(a—c);(d—f)通过5%显著水平检验Fig.6 Spatial distribution of the trend in Rh (a—c); The trends in the (d—f) have been filtered for significance at the 0.05 level
2.2.3 NEP空间分布
陆地生态系统的净生产力(NEP)可以表征为生态系统净初级生产力(NPP)和土壤呼吸(Rh)差值,其变化的强度明显弱于NPP和Rh的变化强度。当仅仅考虑大气中CO2浓度变化时,陆地生态系统绝大部分区域NEP呈增加趋势(图7),其中西非、东亚和亚欧大陆部分区域最为显著,显著水平达到5%,显著减少区域主要分布在美国的阿拉斯加。绝大部分区域NEP同样对气候变化响应强度和方式较NPP和Rh不明显。当同时考虑二者共同影响时,北半球中高纬度和高海拔地区NEP呈增加趋势,其中显著增加区域主要分布在北亚的我国东北部,而低纬度地区NEP呈减少趋势,绝大部分区域未达到5%显著水平。
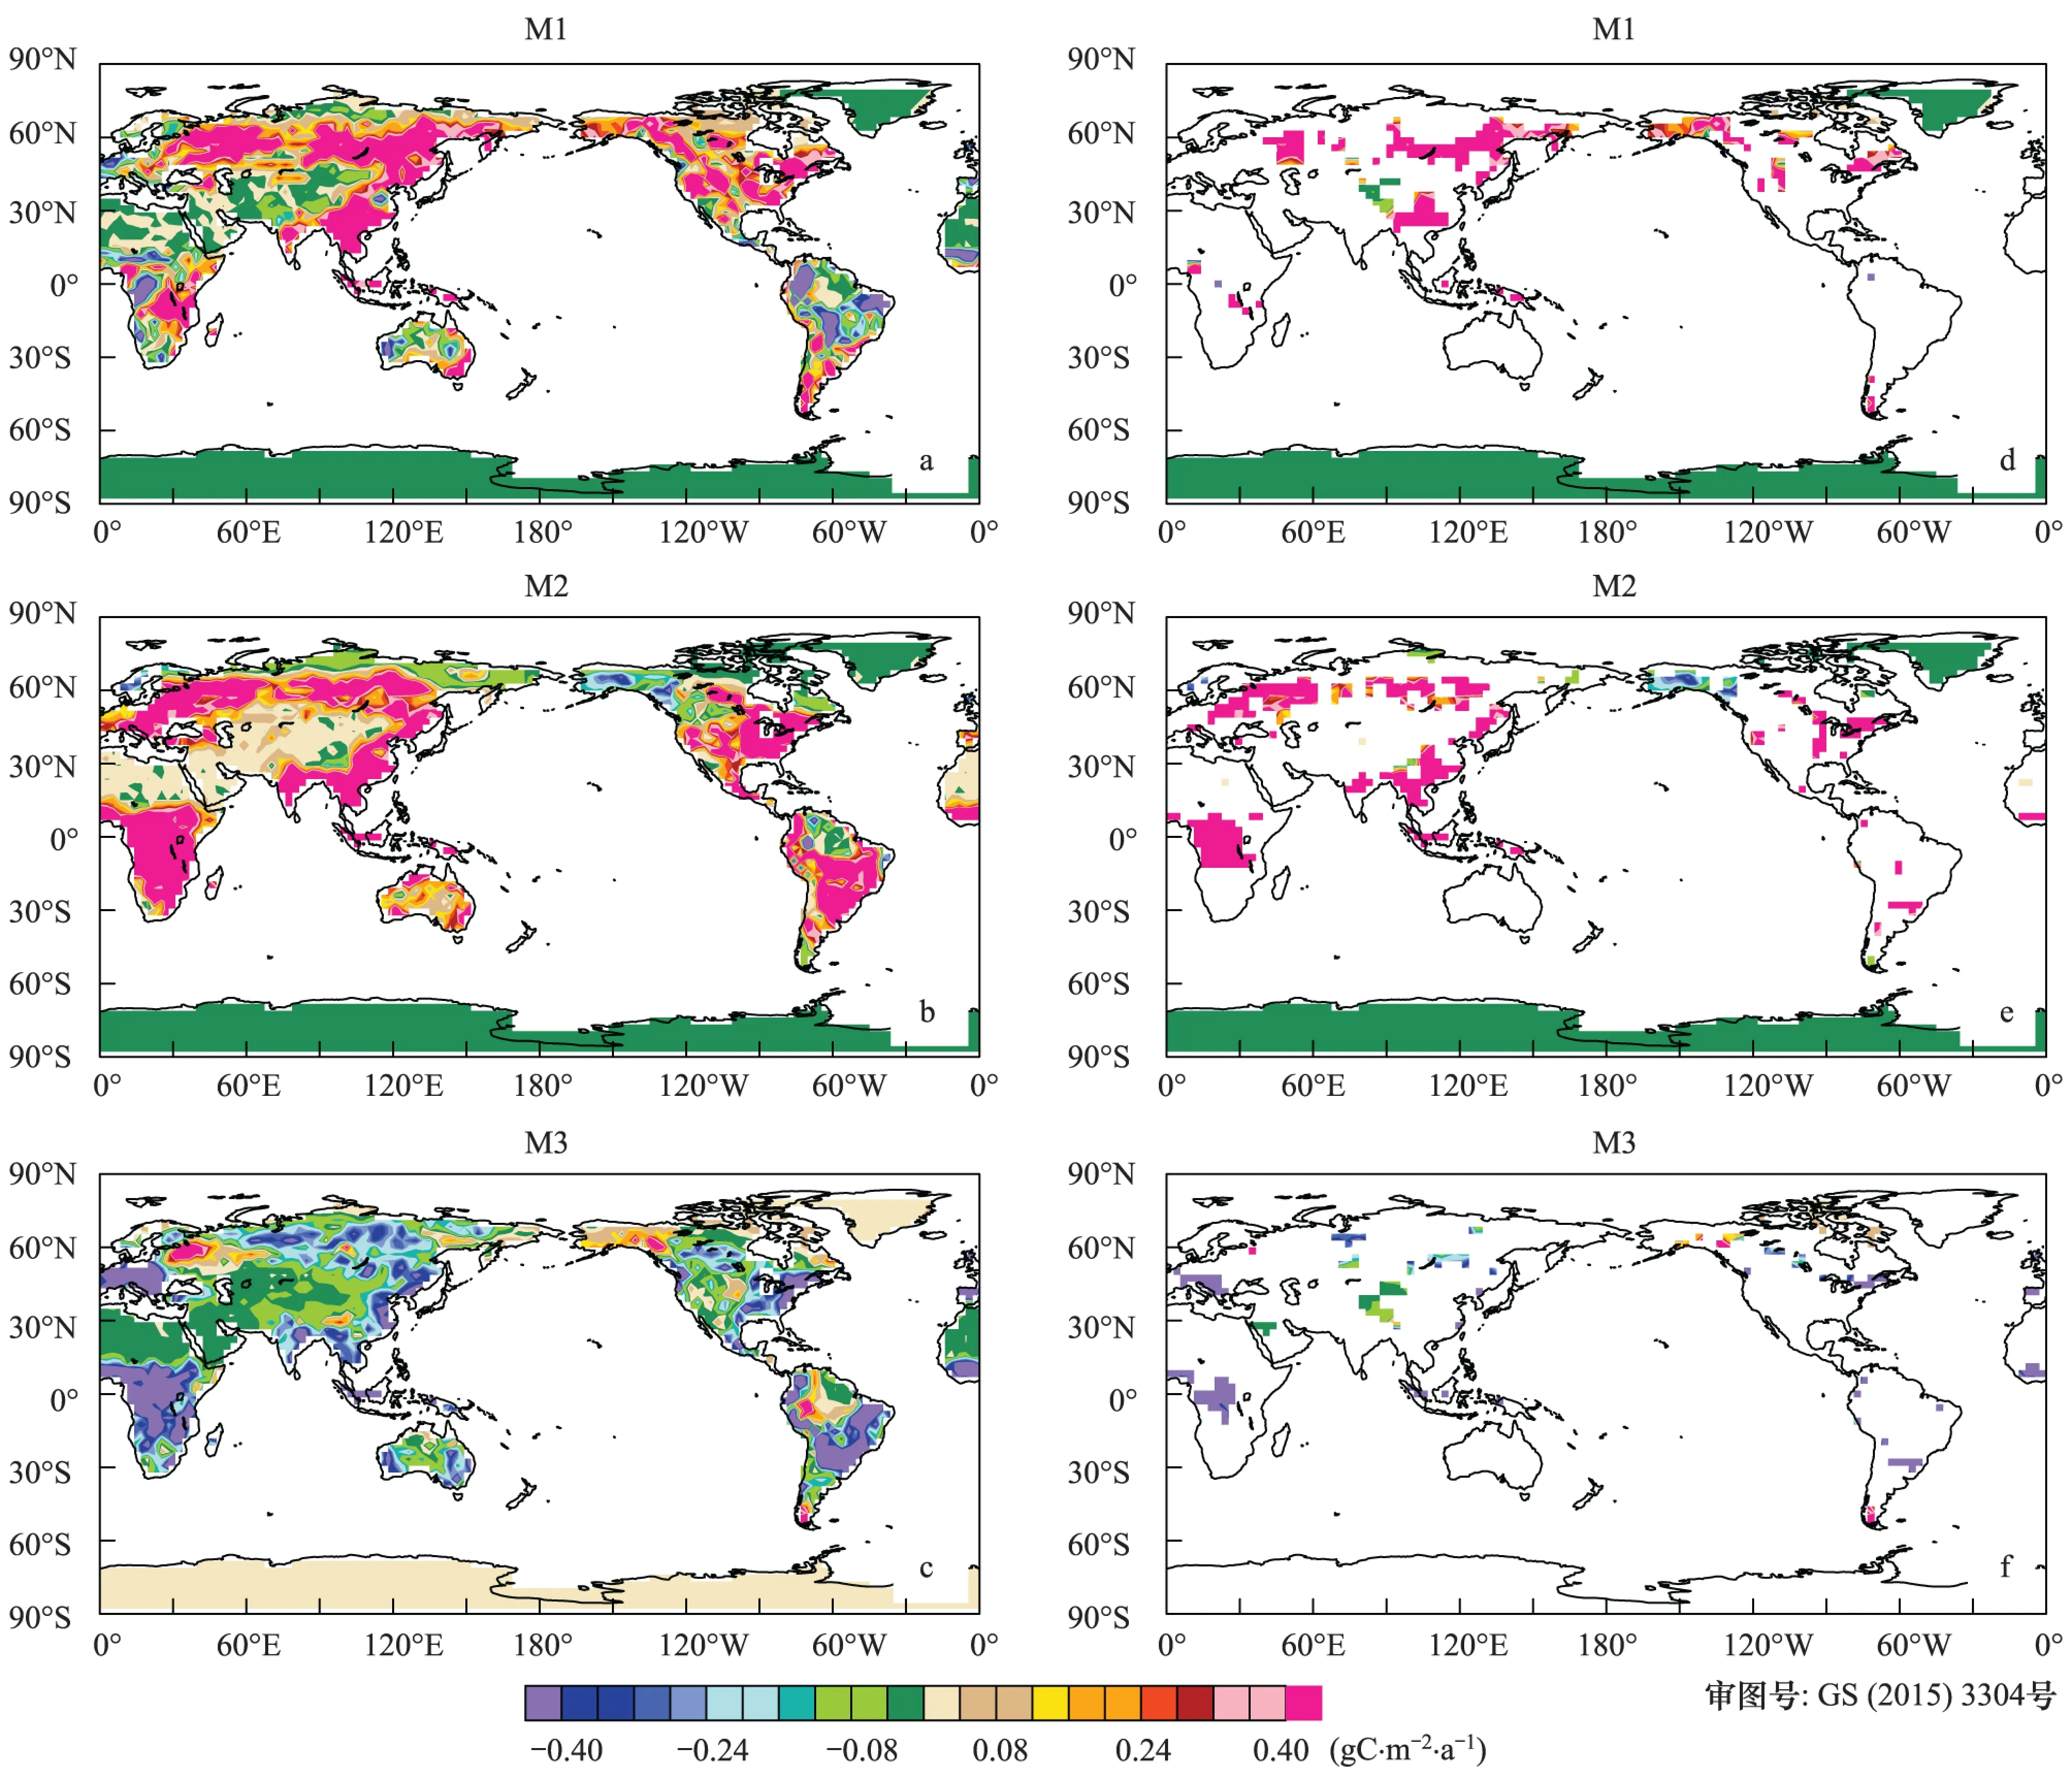
图7 净生态系统生产力变化趋势空间分布(a—c);(d—f)通过5%显著水平检验Fig.7 Spatial distribution of the trend in NEP (a—c); The trends in the (d—f) have been filtered for significance at the 0.05 level
2.3 影响陆地生态系统碳通量的驱动力分析
大气CO2浓度变化是影响陆地生态系统碳通量时间变化和空间分布的最重要的原因之一。已有研究表明,CO2的生理强迫能显著影响陆地生态系统碳循环[42-43]。这种影响主要表现在对植被的助长作用。一方面,大气中CO2浓度升高提高了植被水分利用效率[44],另一方面,能直接增强光合作用,促进植被生长。模式结果表明,CO2的生理强迫对陆地生态系统碳通量时空格局的影响显著大于CO2辐射强迫的影响。值得注意得是,本研究中并没有考虑氮素限制作用,CO2助长作用有可能被高估[45]。
陆地生态系统碳通量的变化与气候系统关系密切。尽管能量通量(例如,净辐射通量)对陆地生态系统碳通量有重要的影响,为了简化问题,选择了3个最基本的气候系统变量(气温、降水和土壤湿度),分别分析了陆地生态系统NEP与以上3个气候系统变量的关系(表2)。1850—1989年间陆地生态系统温度呈显著增加趋势(P<0.001),温升速率为0.32 ℃/10a-1。降水呈显著增加趋势,变化速率为0.37 mm/a2,土壤湿度平均变化速率为0.29 kg m-210a-1(P<0.01)(M3试验)。有研究表明,全球增暖,一方面,导致北半球中高纬度和高海拔地区生长季延长;另一方面,引起生长季植被生长加速[46-47]。方精云发现近年中国区域的植被活动在增强[48]。这些研究结果进一步印证了全球增暖促进温度受限区域的NPP和Rh增加。由于温度升高引起的Rh变化速率快于NPP变化速率,这些区域的NEP呈减少趋势,模式均模拟出NEP对Rh的响应。
低纬度地区,特别是亚马逊流域,其降水和土壤湿度变化对该区域碳通量影响显著。140年间,亚马逊流域年平均温度显著升高,降水减少(约为1.7mm/a,P<0.05),而土壤湿度也呈减少趋势(P<0.05),年平均变化速率约为-0.15 kg m-2a-1(M3试验)。这表明该区域温度显著升高,降水和土壤湿度则显著减少,该区域的干旱风险加剧。干旱导致了NPP显著减少[32],进而碳存储量呈减少变化。已有研究结果均支持了这一观点:亚马逊流域干旱导致植被生长受到限制,导致了该区域碳存储量减少[43,49]。
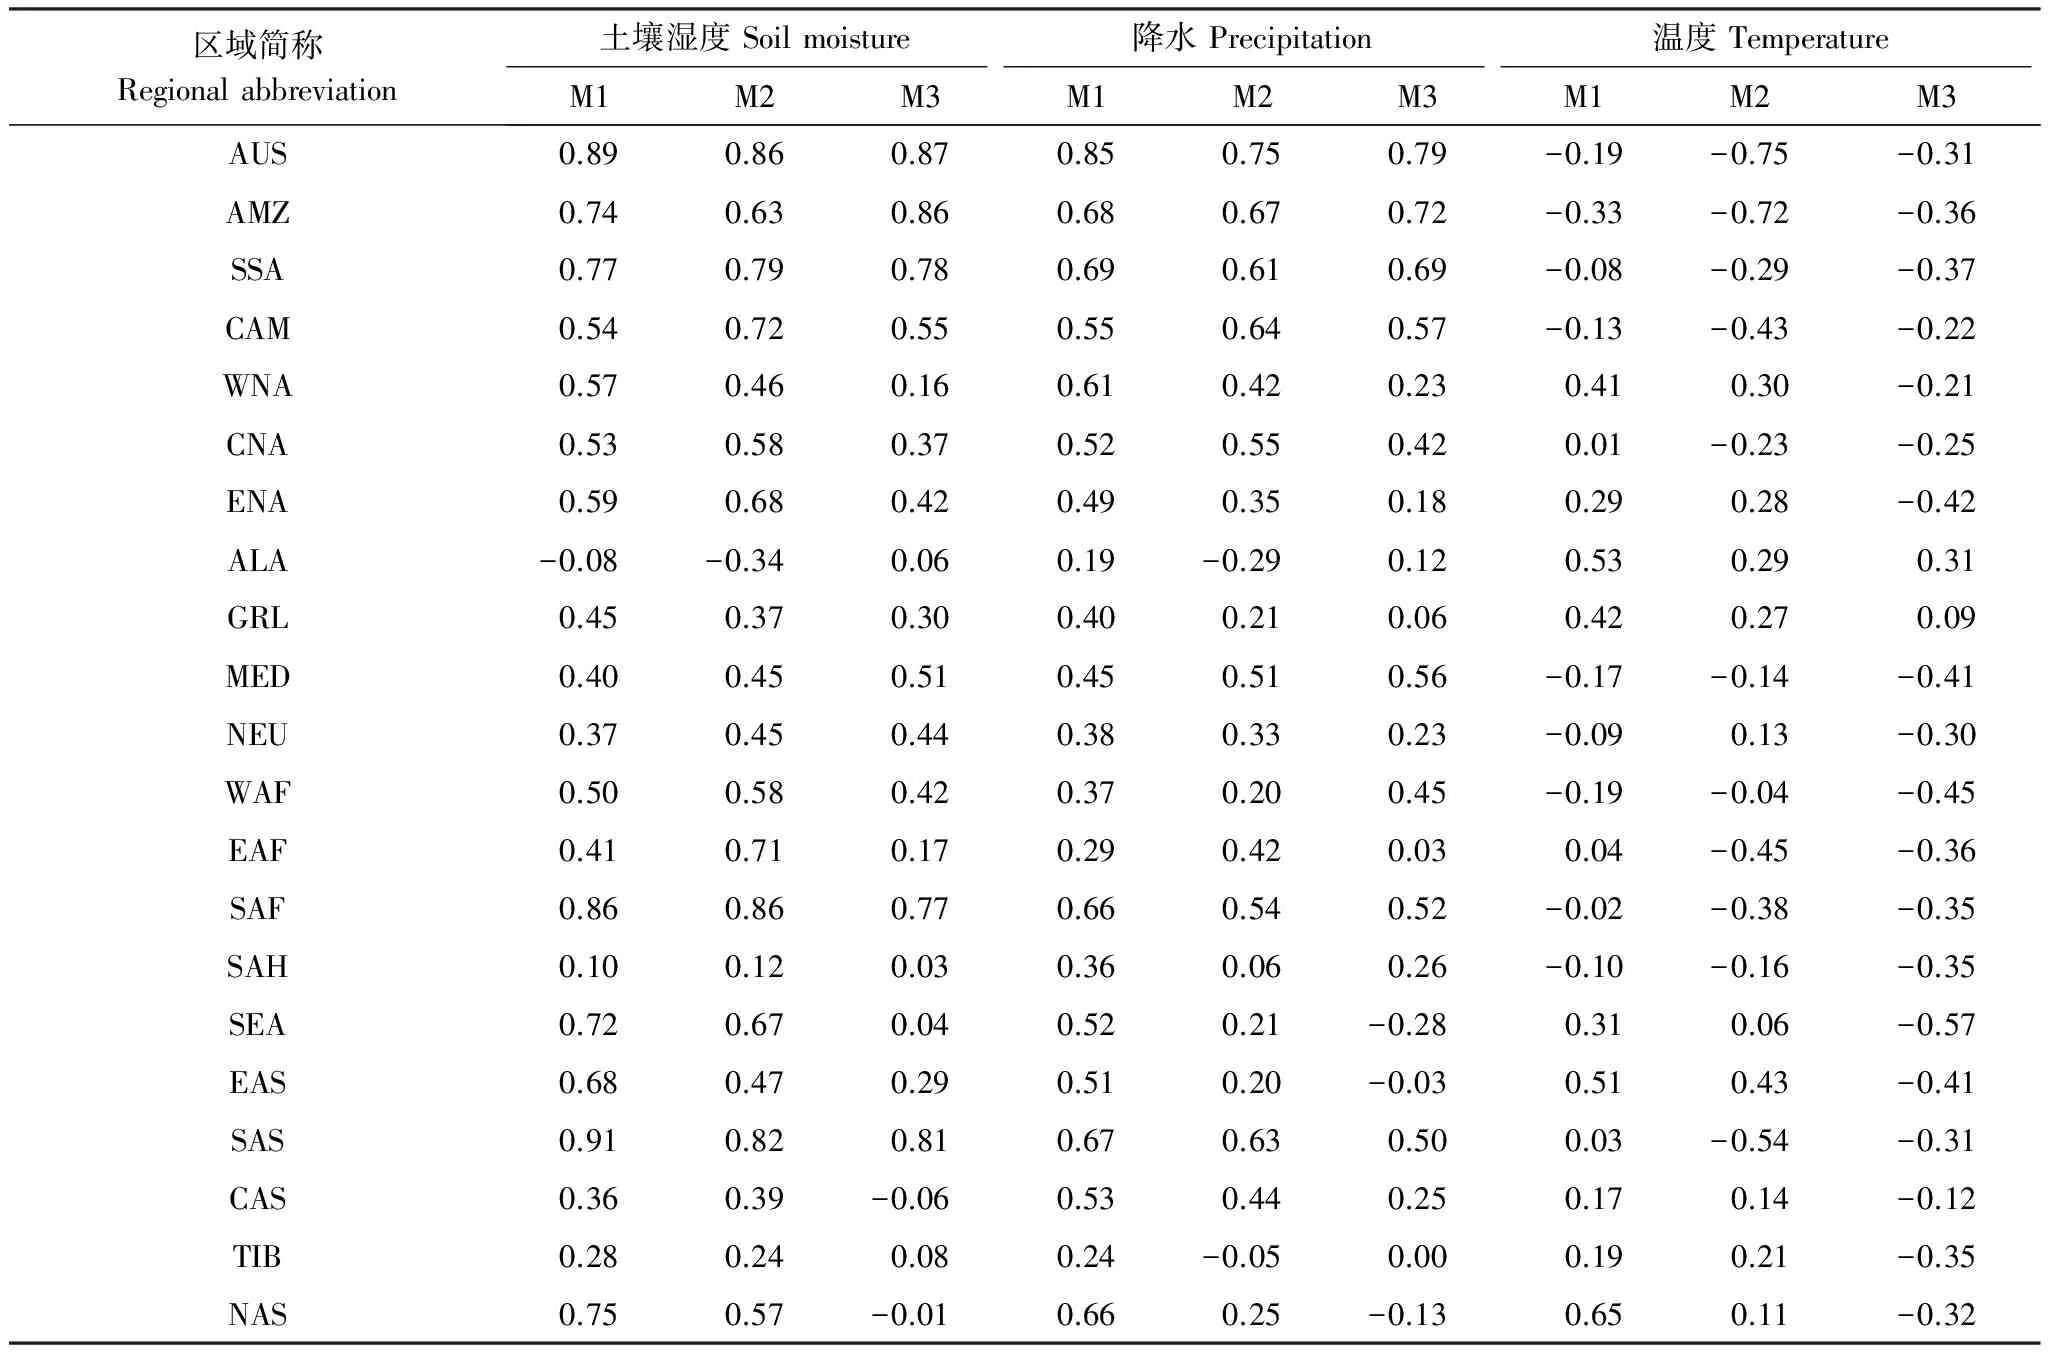
表2 不同区域的净生态系统生产力分别与土壤湿度、降水、温度的相关系数
3 结论
(1)大气中CO2浓度升高引起陆地生态系统NPP和Rh的显著增加,NEP呈增加趋势,但多数区域没有通过5%显著水平检验。近140年陆地生态系统NPP和Rh年分别增加了117.1 gC m-2a-1和98.4 gC m-2a-1,显著水平均达到了5%。这是由于CO2生理强迫导致了植被活动增强,引起了NPP显著增加,由于输入到土壤中有机碳的增加,Rh也呈显著增加趋势,说明CO2升高引起的生理强迫对全球碳通量的影响明显大于CO2辐射强迫的影响。
(2)NPP对气候变化的响应有显著的空间非均一性。在低纬度地区和南半球,NPP呈减少趋势。而在北半球的中高纬度地区,NPP呈增加趋势,这是由于全球变暖,生长季延长,植被活动增强所致。Rh对气候变化响应与NPP一致,其中北半球高纬度地区的Rh响应强度大于NPP。
(3) 当同时考虑大气CO2浓度升高和气候变化的共同影响时,亚马逊流域NPP和Rh均呈显著减少趋势(P<0.05),其平均变化趋势分别为-1.8 gC m-2a-2和-1.6 gC m-2a-2。NEP也呈减少趋势,但绝大部分区域并未达到5%显著水平。亚马逊流域NEP的变化与温度、降水和土壤湿度关系密切,其中与土壤湿度的关系最为密切,这表明干旱是影响亚马逊流域NEP变化的最重要驱动因子。
(4) 尽管本文仅基于CanEsm2单个模式数据,仍可为百年尺度CO2浓度升高和气候变化作用机制的研究提供借鉴;陆地生态系统碳通量动态变化是多因子共同作用、多尺度重叠的过程。此外,本文未分析能量通量对碳通量的影响,也未考虑土地利用方式和气溶胶均等因素的影响。
[1] 朴世龙, 方精云, 黄耀. 中国陆地生态系统碳收支. 中国基础科学, 2010, 12(2): 20- 22.
[2] Arora V K, Boer G J, Christian J R, Curry C L, Denman K L, Zahariev K, Flato G M, Scinocca J F, Merryfield W J, Lee W G. The effect of terrestrial photosynthesis down regulation on the twentieth-century carbon budget simulated with the CCCma earth system model. Journal of Climate, 2009, 22(22): 6066- 6088.
[3] Arora V K, Boer G J, Friedlingstein P, Eby M, Jones C D, Christian J R, Bonan G, Bopp L, Brovkin V, Cadule P, Hajima T, Ilyina T, Lindsay K, Tjiputra J F, Wu T W. Carbon-concentration and carbon-climate feedbacks in CMIP5 Earth system models. Journal of Climate, 2013, 26(15): 5289- 5314.
[4] Cox P M, Pearson D, Booth B B, Friedlingstein P, Huntingford C, JonesC D, Luke C M. Sensitivity of tropical carbon to climate change constrained by carbon dioxide variability. Nature, 2013, 494(7437): 341- 344.
[5] Cramer W, Bondeau A, Woodward F I, Prentice I C, Betts R A, Brovkin V, Cox P M, Fisher V, Foley J A, Friend A D, Kucharik C, Lomas M R, Ramankutty N, Sitch1 S, Smith B, White A, Young-Molling C. Global response of terrestrial ecosystem structure and function to CO2and climate change: results from six dynamic global vegetation models. Global Change Biology, 2001, 7(4): 357- 373.
[6] 王建林, 温学发, 赵风华, 房全孝, 杨新民. CO2浓度倍增对8种作物叶片光合作用, 蒸腾作用和水分利用效率的影响. 植物生态学报, 2012, 36(5): 438- 446.
[7] Friedlingstein P, Cox P, Betts R, Bopp L, Von Bloh W, Brovkin V, Cadule P, Doney S, Eby M, Fung I, Bala G, John J, Jones C, Joos F, Kato T, Kawamiya M, Knorr W, Lindsay K, Matthews H D, Raddatz T, Rayner P, Reick C, Roeckner E, Schnitzler K G, Schnur R, Strassmann K, Weaver A J, Yoshikawa C, Zeng N. Climate-carbon cycle feedback analysis: Results from the C4MIP model intercomparison. Journal of Climate, 2006, 19(14): 3337- 3353.
[8] Friedlingstein P, Fung I, Holland E, John J, Brasseur G, Erickson D, Schimel D. On the contribution of CO2fertilization to the missing biospheric sink. Global Biogeochemical Cycles, 1995, 9(4): 541- 556.
[9] Piao S, Sitch S, Ciais P, Friedlingstein P, Peylin P, Wang X., Ahlström A, Anav A, Canadell JG, Cong N Evaluation of terrestrial carbon cycle models for their response to climate variability and to CO2trends. Global Change Biology, 2013, 19, 2117-2132, doi: 10.1111/gcb.12187.
[10] 左闻韵, 贺金生, 韩梅, 吉成均, 方精云. 植物气孔对大气CO2浓度和温度升高的反应--基于在 CO2浓度和温度梯度中生长的 10 种植物的观测. 生态学报, 2012, 25(3): 565- 574.
[11] Betts R A, Boucher O, Collins M, Cox P M, Falloon P D, Gedney N, Hemming D L, Huntingford C, Jones C D, Sexton D M H, Webb M J. Projected increase in continental runoff due to plant responses to increasing carbon dioxide. Nature, 2007, 448(7157): 1037- 1041.
[12] Barton CV, Duursma RA, Medlyn BE, Ellsworth DS, Eamus D, Tissue DT, Adams MA, Conroy J, Crous KY, Liberloo M. Effects of elevated atmospheric [CO2] on instantaneous transpiration efficiency at leaf and canopy scales in Eucalyptus saligna. Global Change Biology, 2012, 18, 585- 595.
[13] Solomon S, Plattner G K, Knutti R, Friedlingstein P. Irreversible climate change due to carbon dioxide emissions. Proceedings of the National Academy of Sciences of the United States of America, 2009, 106(6): 1704- 1709.
[14] Adler R F, Gu G J, Wang J J, Huffman G J, Curtis S, Bolvin D. Relationships between global precipitation and surface temperature on interannual and longer timescales(1979- 2006). Journal of Geophysical Research: Atmospheres (1984- 2012), 2008, 113(D22): 27, doi: 10.1029/2008JD010536.
[15] Andrews T. Forcing and response in simulated 20th and 21st century surface energy and precipitation trends. Journal of Geophysical Research (1984- 2012), 2009, 114(D17), doi: 10.1029/2009JD011749.
[16] Andrews T, Doutriaux-Boucher M, Boucher O, Forster P M. A regional and global analysis of carbon dioxide physiological forcing and its impact on climate. Climate Dynamics, 2011, 36(3/4): 783- 792.
[17] Gillett N P, Arora V K, Zickfeld K, Marshall S J, Merryfield W J. Ongoing climate change following a complete cessation of carbon dioxide emissions. Nature Geoscience, 2011, 4(2): 83- 87.
[18] Piao S L, Ciais P, Friedlingstein P, de Noblet-Ducoudré N, Cadule P, Viovy N, Wang T. Spatiotemporal patterns of terrestrial carbon cycle during the 20th century. Global Biogeochemical Cycles, 2009, 23(4), doi: 10.1029/2008GB003339.
[19] Sitch S, Huntingford C, Gedney N, Levy P, Lomas M, Piao S L, Betts R, Ciais P, Cox P, Friedlingstein P, Jones C D, Prentice I C, Woodward F I. Evaluation of the terrestrial carbon cycle, future plant geography and climate-carbon cycle feedbacks using five Dynamic Global Vegetation Models(DGVMs). Global Change Biology, 2008, 14(9): 2015- 2039.
[20] IPCC. Climate Change 2007: The Physical Science Basis. Cambridge, United Kingdom and New York, NY, USA: Cambridge University Press, 2007.
[21] 王建林, 温学发. 气孔导度对 CO2浓度变化的模拟及其生理机制. 生态学报, 2010, 30(17): 4815- 4820.
[22] Li D, Ji J J. The surface energy, water, carbon flux and their intercorrelated seasonality in a global climate-vegetation coupled model. Tellus B, 2007, 59(3): 425- 538.
[23] Piao S, Ciais P, Lomas M, Beer C, Liu H, Fang J, Friedlingstein P, Huang Y, Muraoka H, Son YH, Woodward I Contribution of climate change and rising CO2to terrestrial carbon balance in East Asia: a multi-model analysis. Global and Planetary Change, 2011, 75(3): 133- 142.
[24] Beer C, Reichstein M, Tomelleri E, Ciais P, Jung M, Carvalhais N, Rödenbeck C, Arain M A, Baldocchi D, Bonan G B, Bondeau A, Cescatti A, Lasslop G, Lindroth A, Lomas M, Luyssaert S, Margolis H, Oleson K W, Roupsard O, Veenendaal E, Viovy N, Williams C, Woodward F I, Papale D. Terrestrial gross carbon dioxide uptake: global distribution and covariation with climate. Science, 2010, 329(5993): 834- 838.
[25] Randerson J T, Hoffman F M, Thornton P E, Mahowald N M, Lindsay K, LEE Y H, Nevison C D, Doney S C, Bonan G, Stöckli R, Covey C, Running S W, Fung I Y. Systematic assessment of terrestrial biogeochemistry in coupled climate-carbon models. Global Change Biology, 2009, 15(10): 2462- 2484.
[26] Arora V K, Boer G J. Uncertainties in the 20th century carbon budget associated with land use change. Global Change Biology, 2010, 16(12): 3327- 3348.
[27] Zhou T J, Yu Y Q, Liu Y M, Wang B. Flexible global ocean-atmosphere-land system model: a modeling tool for the climate change research community//Springer Earth System Sciences. Springer, 2014.
[28] Trumbore S. Carbon respired by terrestrial ecosystems-recent progress and challenges. Global Change Biology, 2006, 12(2): 141- 153.
[29] Jeong S J, Ho C H, Park T E, Kim J, Levis S. Impact of vegetation feedback on the temperature and its diurnal range over the Northern Hemisphere during summer in a 2× CO2climate. Climate Dynamics, 2011, 37(3/4): 821- 833.
[30] Ciais P, Sabine C, Bala G, Bopp L, BrovkinV, Canadell J, Chhabra A, DeFries R, Galloway J, Heimann M, Jones C, Le Quéré C, Myneni R B, Piao S, Thornton P. Carbon and other biogeochemical cycles//Stocker T F, Qin D, Plattner G K, Tignor M, Allen S K, Boschung J, Nauels A, Xia Y, Bex V, Midgley P M. Climate Change 2013: The Physical Science Basis. Contribution of Working Group I to the Fifth Assessment Report of the Intergovernmental Panel on Climate Change. Cambridge, United Kingdom and New York, NY, USA: Cambridge University Press, 2013.
[31] Peng J, Dan L, Dong W. Estimate of extended long-term LAI data set derived from AVHRR and MODIS based on the correlations between LAI and key variables of the climate system from 1982 to 2009. International Journal of Remote Sensing, 2013, 34(21): 7761- 7778.
[32] Peng J, Dong W, Yuan W, Chou J, Zhang Y, Li J. Effects of increased CO2on land water balance from 1850 to 1989. Theoretical and Applied Climatology, 2013, 111(3/4): 483- 495.
[33] Giorgi F, Francisco R. Uncertainties in regional climate change prediction: a regional analysis of ensemble simulations with the HADCM2 coupled AOGCM. Climate Dynamics, 2000, 16(2/3): 169- 182.
[34] Taylor K E, Stouffer R J, Meehl G A. An overview of CMIP5 and the experiment design. Bulletin of the American Meteorological Society, 2012, 93(4): 485- 498.
[35] 朱文泉, 潘耀忠, 阳小琼, 宋国宝. 气候变化对中国陆地植被净初级生产力的影响分析. 科学通报, 2007, 52(21): 2535- 2541.
[36] 朴世龙, 方精云,郭庆华. 1982- 1999年我国植被净第一性生产力及其时空变化. 北京大学学报, 2001, 37(4): 563- 569.
[37] Christidis N, Stott P A, Brown S, Karoly D J, Caesar J. Human contribution to the lengthening of the growing season during 1950- 1999. Journal of Climate, 2007, 20(21): 5441- 5454.
[38] 陈效逑, 亓孝然, 阿杉, 徐琳. 我国东部北亚热带植物群落季相的时空变化. 生态学报, 2011, 31(13): 3559- 3568.
[39] 张娜, 于贵瑞, 于振良, 赵士洞. 基于景观尺度过程模型的长白山净初级生产力空间分布影响因素分析. 应用生态学报, 2003, 14(5): 659- 664.
[40] 张廷军, 晋锐, 高峰. 冻土遥感研究进展: 被动微波遥感. 地球科学进展, 2009, 24(10): 1073- 1083.
[41] 杨思忠, 金会军. 冻融作用对冻土区微生物生理和生态的影响. 生态学报, 2008, 28(10): 5065- 5074.
[42] Heimann M, Reichstein M. Terrestrial ecosystem carbon dynamics and climate feedbacks. Nature, 2008, 451(7176): 289- 292.
[43] Zhao M, Running S W. Drought-induced reduction in global terrestrial net primary production from 2000 through 2009. Science, 2010, 329(5994): 940- 943.
[44] 胡中民, 于贵瑞, 王秋凤, 赵风华. 生态系统水分利用效率研究进展. 生态学报, 2009, 29(3): 1498- 1507.
[45] 马立祥, 赵甍, 毛子军, 刘林馨, 赵溪竹. 不同氮素水平下增温及[CO2]升高综合作用对蒙古栎幼苗生物量及其分配的影响. 植物生态学报, 2010, 34(3): 279- 288.
[46] 于贵瑞, 方华军, 伏玉玲, 王秋凤. 区域尺度陆地生态系统碳收支及其循环过程研究进展. 生态学报, 2011, 31(19): 5449- 5459.
[47] 赵国帅, 王军邦, 范文义,应天玉. 2000—2008 年中国东北地区植被净初级生产力的模拟及季节变化. 应用生态学报, 2011, 22(3): 621- 630.
[48] 方精云, 朴世龙, 贺金生, 马文红. 近20年来中国植被活动在增强. 中国科学, 2003, 33(6): 554- 567.
[49] Phillips O L, Aragão L E O C, Lewis S L, Fisher J B, Lloyd J, López-González G, Malhi Y, Monteagudo A, Peacock J, Quesada C A, van der Heijden G, Almeida S, Amaral I, Arroyo L, Aymard G, Baker T R, Bánki O, Blanc L, Bonal D, Brando P, Chave J, de OliveiraC A, Cardozo N D, Czimczik C I, Feldpausch T R, Freitas M A, Gloor E, Higuchi N, Jiménez E, Lloyd G, Meir P, Mendoza C, Morel A, Neill D A, Nepstad D, Patio S, Peuela M C, Prieto A, Ramírez F, Schwarz M, Silva J, Silveira M, Thomas A S, ter Steege H, Stropp J, Vásquez R, Zelazowski P, Dávila E A, Andelman S, Andrade A, Chao K J, Erwin T, Di Fiore A, Honorio C E, Keeling H, Killeen T J, Laurance W F, Cruz A P, Pitman N C A, Vargas P N, Ramírez-Angulo H, Rudas A, Salamão R, Silva N, Terborgh J, Torres-Lezama A. Drought sensitivity of the Amazon rainforest. Science, 2009, 323(5919): 1344- 1347.
The 100-year scale response of terrestrial ecosystem carbon fluxes to climate-carbon cycle caused by increasing atmospheric CO2concentration using an Earth System Model
PENG Jing, DAN Li*
KeyLaboratoryofRegionalClimate-EnvironmentforTemperateEastAsia,InstituteofAtmosphericPhysics,ChineseAcademyofSciences,Beijing100029,China
Using data from CanESM2, the second generation Earth System Model of the Canadian Centre for Climate Modelling and Analysis (CCCma), we analyze the impact of two atmospheric processes-elevated atmospheric CO2concentration and climate change through temperature and precipitation-on spatiotemporal change of the terrestrial ecosystem during the period 1850—1989. The results show that the elevated atmospheric CO2concentrations enhance the carbon fluxes, with increases of 117.1 gC m-2a-1for net primary production (NPP), 98.4 gC m-2a-1for soil respiration (Rh), and 18.7 gC m-2a-1for net ecosystem production (NEP). Increased linear trends of NPP and Rh of about 0.30 and 0.25 PgC/a2, respectively, occur across the whole terrestrial ecosystem, whereas for climate change impact, NPP has a reduced trend of -19.3 gC m-2a-1. The soil respiration reduces by -8.5 gC m-2and NEP varies by about -10.8 gC m-2. For the whole terrestrial ecosystem, linear decreased trends of NPP and Rh are approximately -0.07 PgC/a2and -0.04 PgC/a2(P<0.05). Regions show large differences of NPP distribution in response to climate change. Low latitudes and the Southern Hemisphere exhibit decreased NPP, while NPP is somewhat increased in the mid and high latitudes of the Northern Hemisphere. Enhanced vegetation growth due to the lengthened growing season associated with global warming is probably responsible for such an increase. The response of Rh to warming is consistent with that of NPP. The magnitude of increased Rh is larger than that of NPP in the high latitudes of the Northern Hemisphere. Permafrost soils in these high latitudes, which contain an enormous quantity of organic carbon, may melt with the increasing temperature, which is expected to cause increased Rh due to more dissolved organic carbon. Change in atmospheric CO2concentration is a dominant driving factor in the spatiotemporal pattern of carbon fluxes of the terrestrial ecosystem, and its impact significantly supersedes the effects of climate change. It should be noted that the model neglects the impact of nitrogen limitation, and thus the effects of elevated CO2on carbon fluxes might be overestimated. In addition, the contribution of climate change is not negligible, particularly in the Amazon basin, because reduction in precipitation and soil moisture can result in decreases in NPP and Rh. In this region, the model estimates that, in response to both rising CO2concentration and climate change, the total NPP and Rh decrease by approximately -1.8 gC m-2a-2and 1.6 gC m-2a-2, respectively. NEP also shows a decreased trend, but most areas of NEP change are not statistically significant at the 5% level. In this region, NEP change is closely related to the variation of temperature, precipitation and soil moisture, and the change correlates more to soil moisture than the other two variables. This indicates that drought is key factor driving NEP changes in this region. The terrestrial carbon fluxes are also driven by multiple factors, e.g. radiation, and the processes involved are complicated. Land use and the effect of aerosol are not considered in this paper. These factors should be incorporated into longer-term simulations to investigate the mechanisms involved in the response of the terrestrial carbon fluxes to CO2concentration and climate change.
coupled model; physiological effect; net primary production (NPP); soil respiration(Rh); net ecosystem production (NEP); temperature; precipitation; soil moisture
中国科学院知识创新工程重要方向项目(KZCX2-EW-QN208); 中国科学院战略性先导科技专项(XDA05110103);国家自然科学基金项目(41275082,41305070)
2013- 12- 02;
2016- 02- 19
10.5846/stxb201312022862
*通讯作者Corresponding author.E-mail: danli@tea.ac.cn
彭静, 丹利.百年尺度地球系统模式模拟的陆地生态系统碳通量对CO2浓度升高和气候变化的响应.生态学报,2016,36(21):6939- 6950.
Peng J, Dan L.The 100-year scale response of terrestrial ecosystem carbon fluxes to climate-carbon cycle caused by increasing atmospheric CO2concentration using an Earth System Model.Acta Ecologica Sinica,2016,36(21):6939- 6950.
