Comparison between Neuman (1975) and Jacob (1946)application for analysing pumping test data of unconfined aquifer
2016-12-11DanaMawloodJwanMustafa
Dana Mawlood, Jwan Mustafa
1 Civil Engineering Department, College of Engineering, University of Salahaddin, Erbil, Kurdistan Region of Iraq.
2 General Directorate of Dams and Reservoirs, Ministry of Agricultural and Water Resources,Erbil, Kurdistan region of Iraq.
Abstract: Pumping test of a water table aquifer is carried out to estimate the aquifer parameters, the obtained data were analysed through the solution of both Neuman (1975) and Jacob (1946) methods through AQTESOLV and Spreadsheet programs, the results of each methods are compared to evaluate the applicability and accuracy of the solution theoretically and practically. In the paper an example is presented, which is conducted for a constant rate pumping test from Ohio, in Fairborn (near Dayton), and it supplied by S.E. Norris (U.S.Geological Survey, Columbus, Ohio). The main objective of this study is to introduce both program and the way of the applications, and compare the results and the hand on of both programs in the field.
Keywords: Neuman (1975); Unconfined aquifer; Pumping test; AQTESOLV program;Microsoft Excel (Spreadsheet) program
Introduction
Groundwater plays a major role in water supply and irrigation worldwide. With the growth of the population, the abstracting water increases and the water level decreases, these may lead to effect on the groundwater management, and change the characteristics of the aquifer. The withdrawal water from the aquifer required to testing of the aquifer in order to estimate the capacity of the well and determine the accurate aquifer properties. The test data were analysed through many methods according to the situation of each locations. The first scientist was Theim in 1906 who developed a method for both confined and unconfined aquifer according to the Dupuit assumptions in 1863, who governed the equation for flow in water table aquifer for steady state (equilibrium conditions).Later, Theis (1935) based on heat transfer derived a method for transient groundwater flow in confined aquifer, then Jacob (1946) simplified Theis solution for long time of pumping test and small radial distance, both previous equations are applicable for unconfined aquifer type, if the drawdown is very small compared to the saturated thickness of the aquifer, after that Hantush M S(1960) find a solution for leaky (semi-confined)aquifer, then Neuman S P in 1975 developed a solution for unconfined aquifer type unsteady-state conditions, the application of all the previous methods are derived based on the particular assumptions. Nowadays many computer programs and application are proposed to evaluate the test data and estimating the values of Transmissivity (T)and Specific yield (Sy). In this paper the practical pumping test data are analysed through AQTESOLV program and Spreadsheet by matching Neuman and Jacob solutions and the results of each aquifer parameters are compared to evaluate the test data. There are many papers that are presented to show the flow through the water table aquifers for example Zlotnik V and Ledder G,(1992) determine the compressibility through unconfined aquifer, also Nwankwor G I et al.(1984) estimated the specific yield in unconfined aquifer, and Neuman S P (1987) presented the specific yield, and also Malama B (2011) proposed alternative linearization of water table kinematic condition (ZHAN H and Zlotnik V A, 2002;Moench A F, 2004; Tartakovsky G D and Neuman S P, 2007; Ni C F et al. 2015).
1 Hydrogeological conditions in the study area
The pumped well located within glacial sand and gravel, the pumping test is conducted in water table aquifer by constant rate of 1 080 Gpm(5 886 m3/day), the test results recorded in the observation well with a distance of 22 m. This example is taken from Ohio, in Fairborn (near Dayton), supplied by S.E. Norris (U.S. Geological survey, Columbus, Ohio). The pumping well is (26 m) deep, and is fully penetrated on the clay layer,with the saturated thickness of 23 m, the detail of the well is described in Fig. 1.
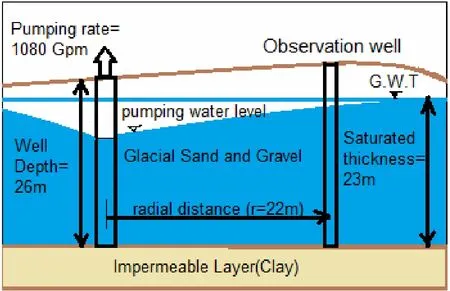
Fig. 1 Pumping well and observation well
The pumping test results are shown in Table 1:
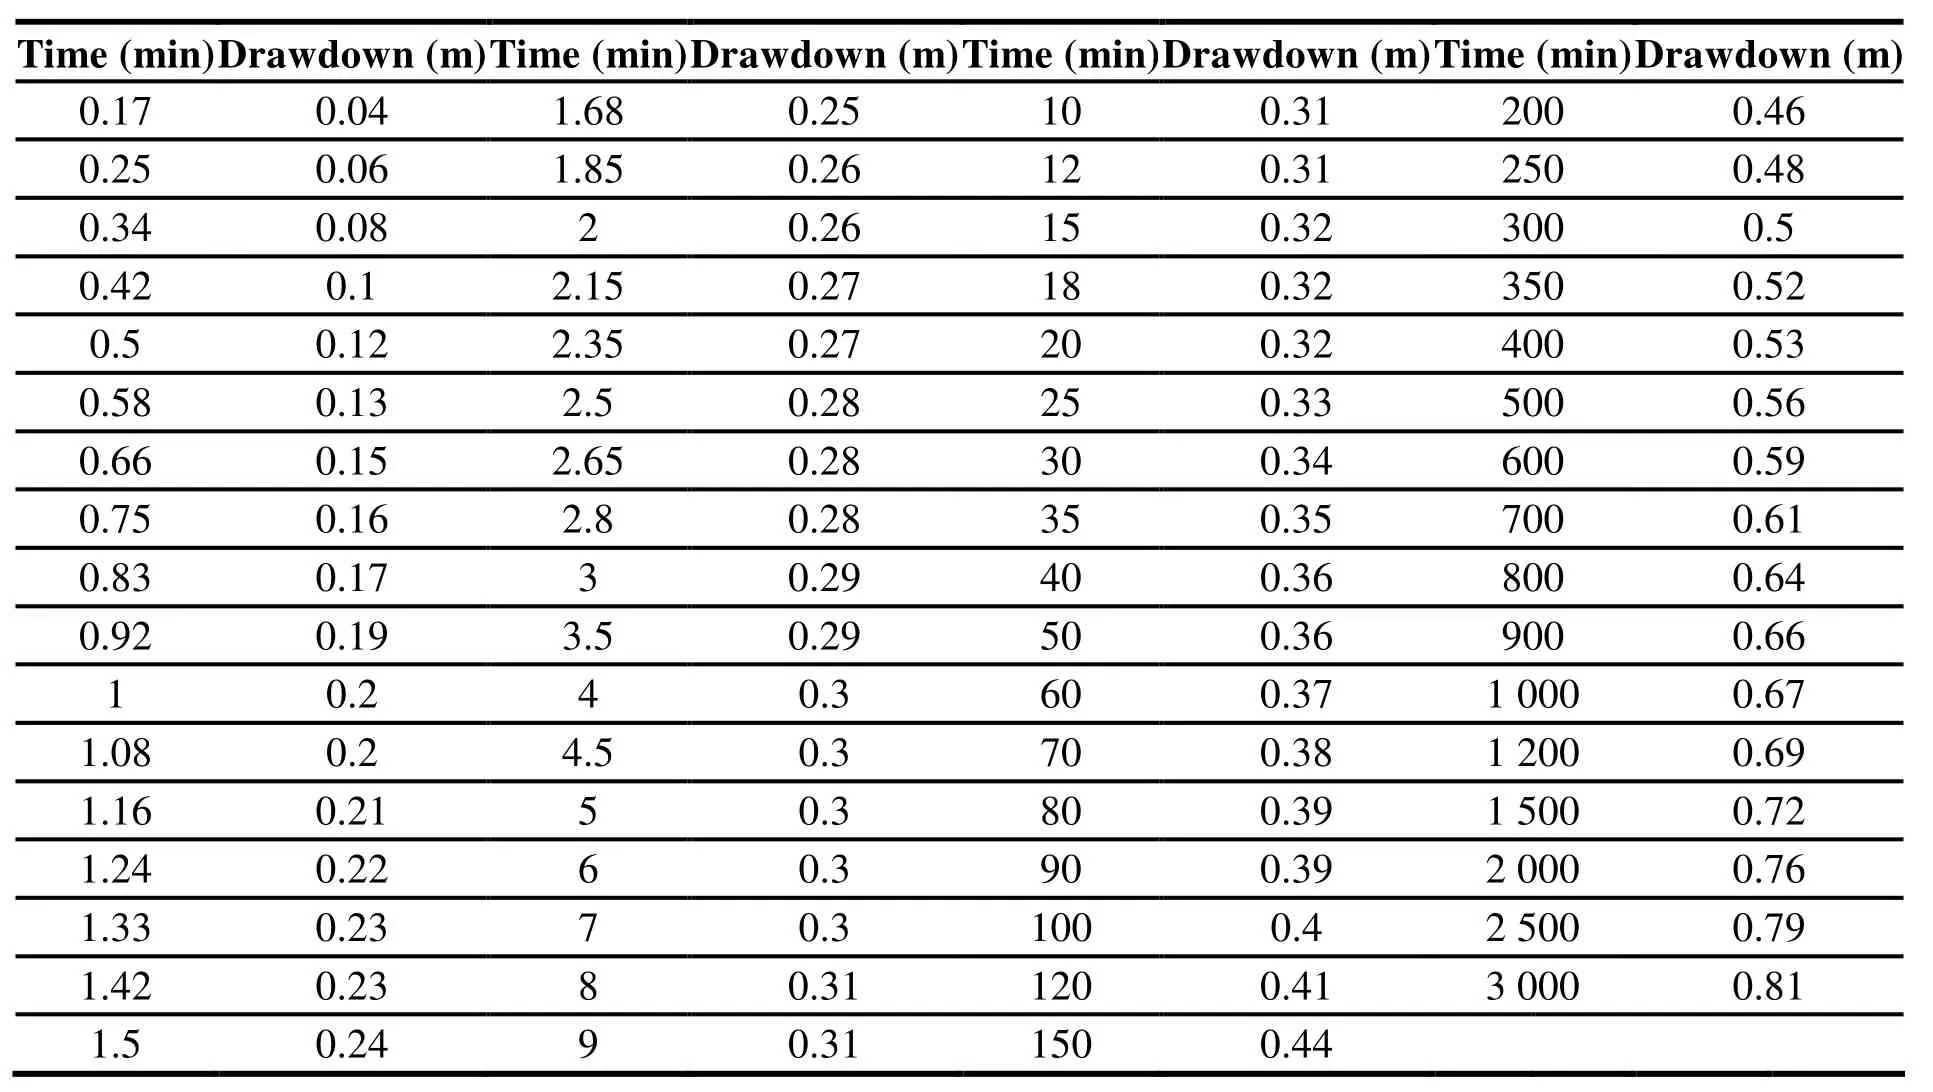
Table 1 Pumping test data results
2 Methods and data analysis
2.1 Neuman (1975) solution
Neuman (1972, 1974, 1975, 1987) published a solution for water table aquifer, which is divided into two parts, one for the time just after pumping has begun, and the other is for late time of pumping, when the water is coming out under the gravity drainage (Fetter C W, 2001). The solution developed based on the following assumptions:
• The aquifer is unconfined.
• The vadose zone has influence on the drawdown.
• Water initially is pumped due to the elastic storage.
• At the end water comes due to gravity drainage of the aquifer.
• Drawdown is negligible compared with the saturated thickness of the aquifer.
• The specific yield is 10 times of the elastic Storativity.
• The aquifer may be-but does not have to be anisotropic with the radial hydraulic conductivity different than the vertical hydraulic conductivity.
The equation for water table aquifer is proposed that the well function of W(uA, uB, Γ) for three different phases, and the drawdown equation:
where: s:is drawdown (L)
Q: is constant rate pumping test (L3/T).
T: is the Transmissivity (L2/T).
W(uA, uB, Γ): is Neuman well function.
Early time: which behaves as elastic storage, and the u value is equal to:
Intermediate time: which behaves as Leaky aquifer and given by:

Late time: which behaves as Gravity drainage:

The results of the data give S-curve shapes, (Fig. 2);
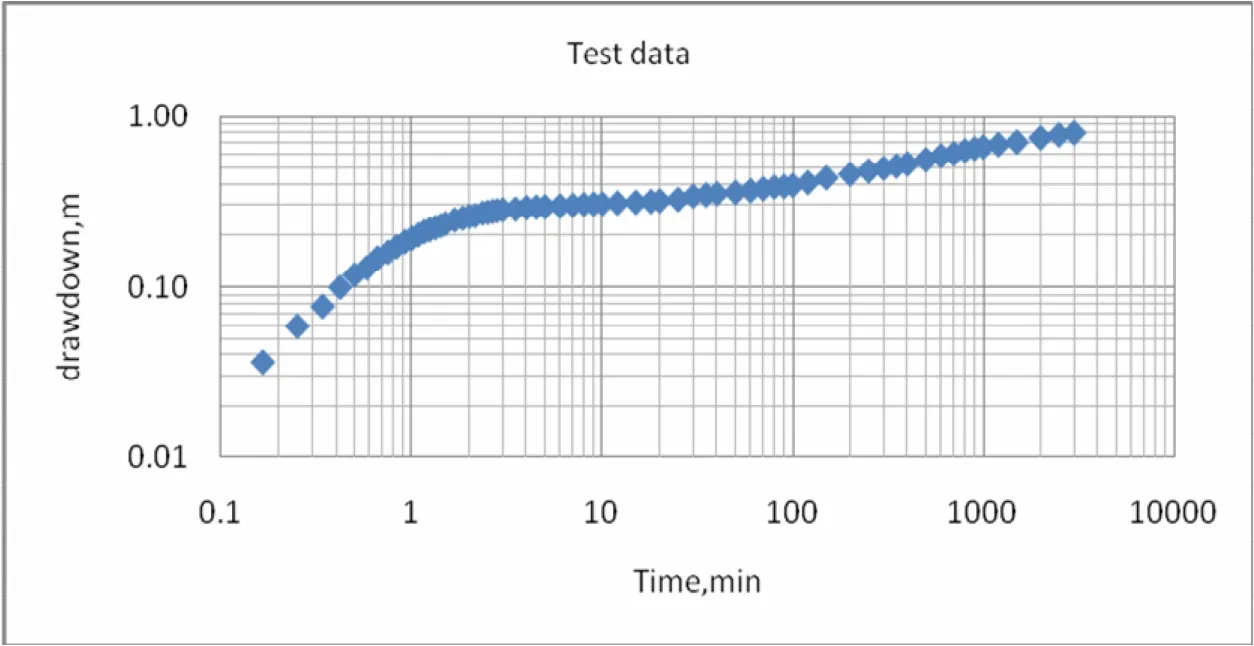
Fig. 2 Pumping test results plot time versus drawdown
2.1.1 Application of Neuman solution by AQTESOLV.
Neuman S P (1975) developed a method,which is useful for determining the Transmissivity(T), elastic storage coefficient (S), specific yield(Sy), vertical and horizontal hydraulic conductivity of water-table (Phreatic) aquifers. The solution involves matching the drawdown data collected during the pumping test. The implementation of the Neuman solution in AQTESOLV includes computational enhancements by Moench A F(1993, 1996) as presented in (Fig. 3):

Fig. 3 Neuman solution by AQTESOLV
2.1.2 Neuman solution by Carlos Molano Spread sheet program
Carlos Molano developed a program in 2011 to analyse pumping test data of unconfined aquifer through excel spreadsheet, the solution required input field data into the time versus drawdown column, to plot the field curve and matching on the type curve by input trial and error number in a set of two columns, Fig. 4 shows the design of the program and the procedure:
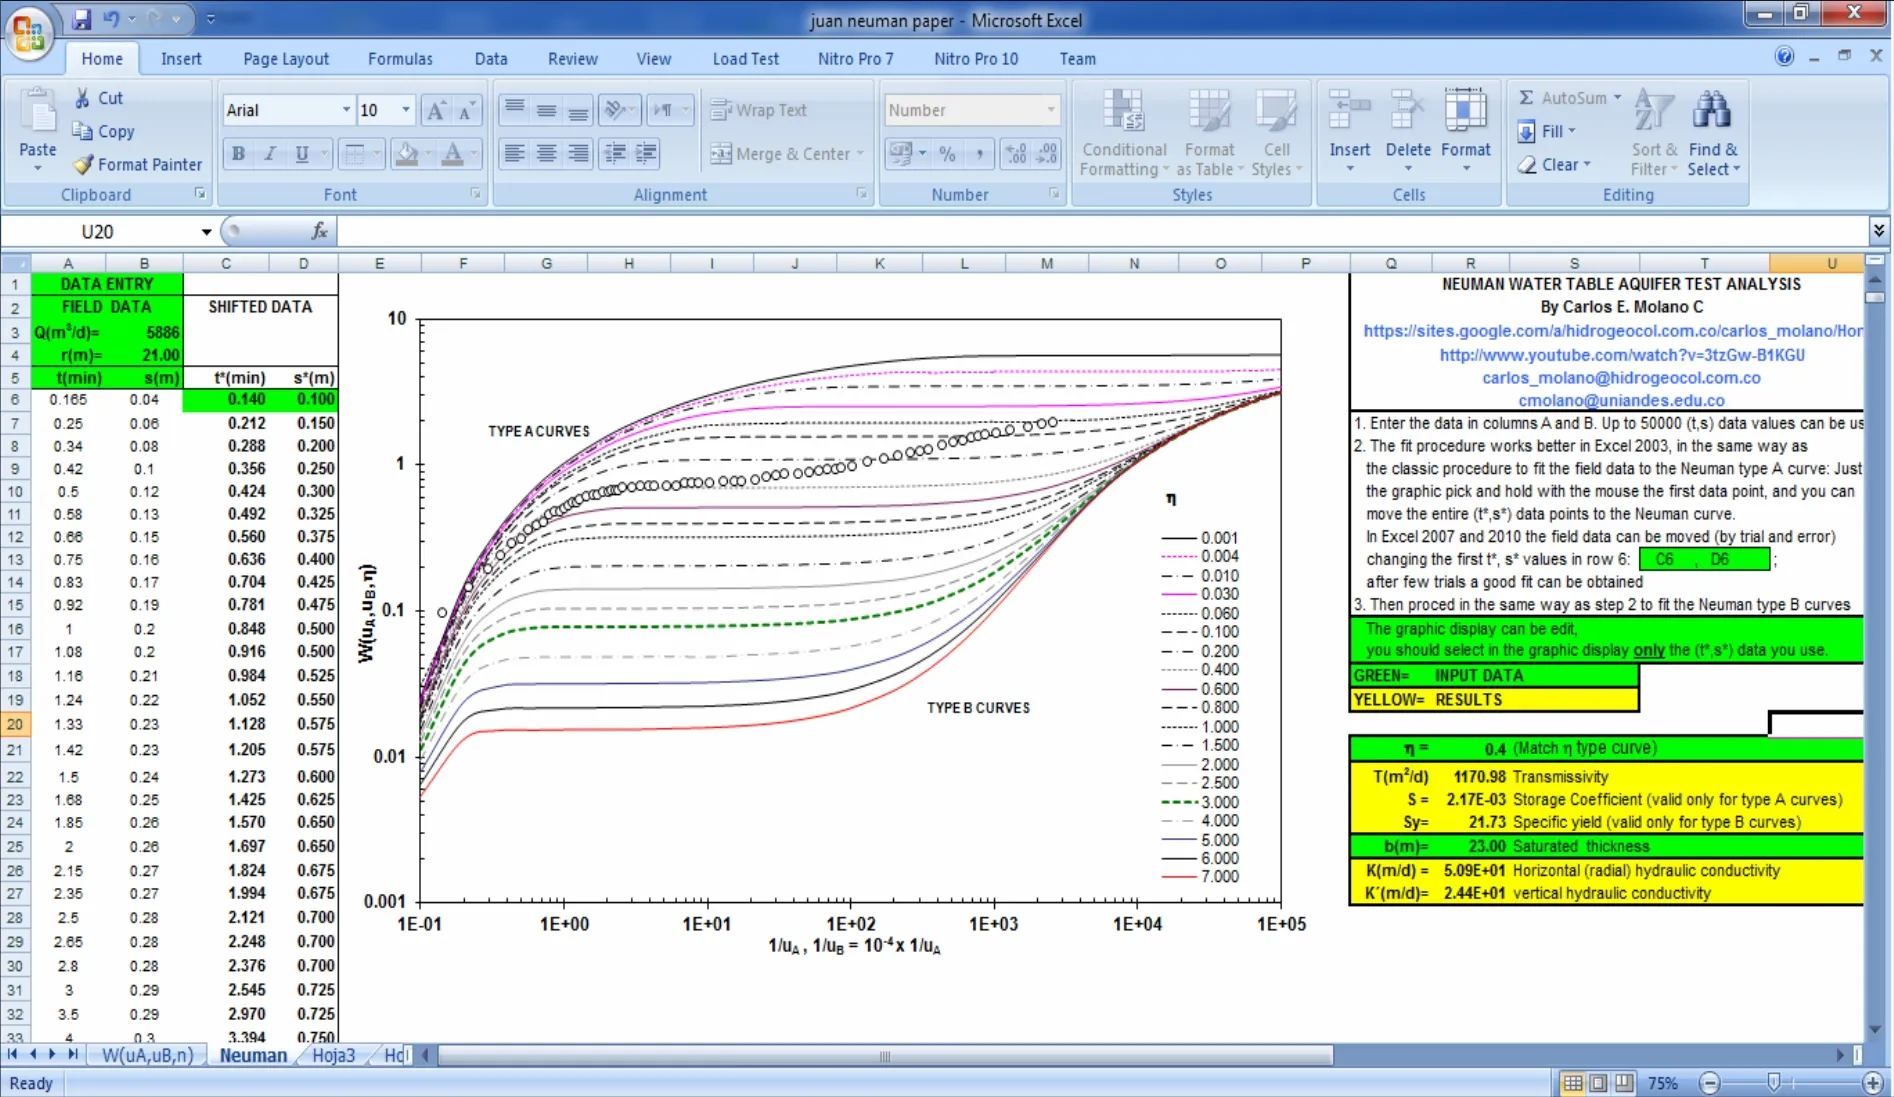
Fig. 4 Spreadsheet program designed by Carlos Molano (2011)
The procedure and detail of the work can be obtained through the following sites(http://sites.google.com/a/hidrogeocol.com.co/carl os_molano/Home,https://www.youtube.com/watch?v=oFwnragYCss)
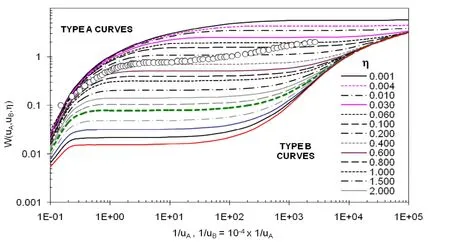
Fig. 5 Neman solution matching with Type A curve

Fig. 6 Neuman solution matching with Type B curve
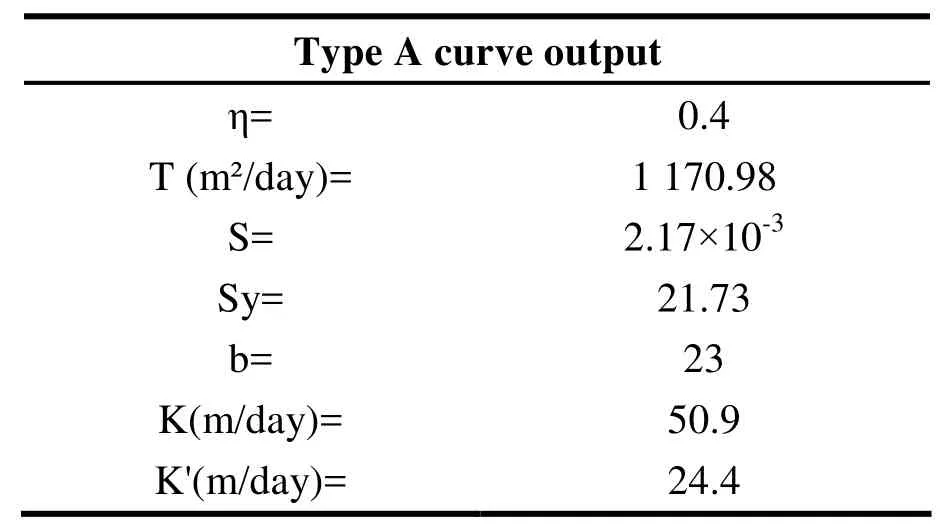
Table 2 Results of Matchingwith type A curve

Table 3 Results of Matching with type B curve
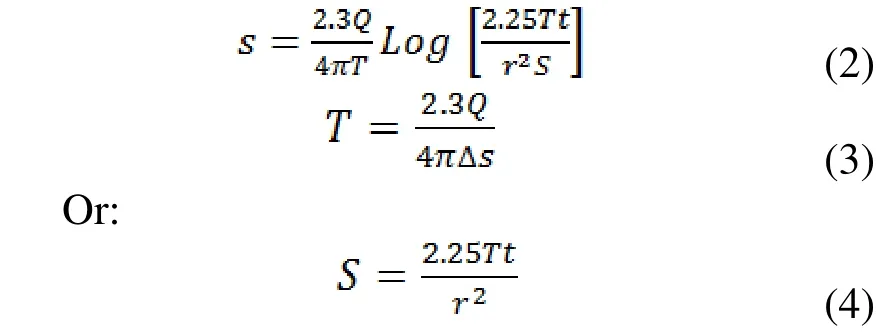
2.2 Jacob (1946) solution:
2.2.1 The test data analyses by AQTESOLV method:
Jacob (1946) developed a method for value of u<0.001, and small value of radial distance, the equation based on Theis C V (1935) equation, a straight line plotted between drawdown(s) and log of time(t) on semi-log paper, and the equation(Fetter C W, 2001):
where:
s: is drawdown [L]
Q: is constant rate pumping test [L³.T-1]
T: is Transmissivity [L².T-1]
S: is Storativity [unit less]
r: is radial distance [L]
u : is well constant
W(u): is well function
t: is time of pumping [T]
Δs: is slope of the line per one log cycle [L]
t。: is the initial time of pumping test at zero drawdown [T]
The program gives the solution by Jacob method for unconfined, if the drawdown is very small compared to the saturated thickness of the aquifer, and the adjustment should be make through the following equation:
where:
s': is the drawdown adjusted (L)
s: is the drawdown (L).
H: is the saturated thickness of the aquifer (L)
After drawdown adjustment, the Jacob solution can be used for unconfined aquifer.
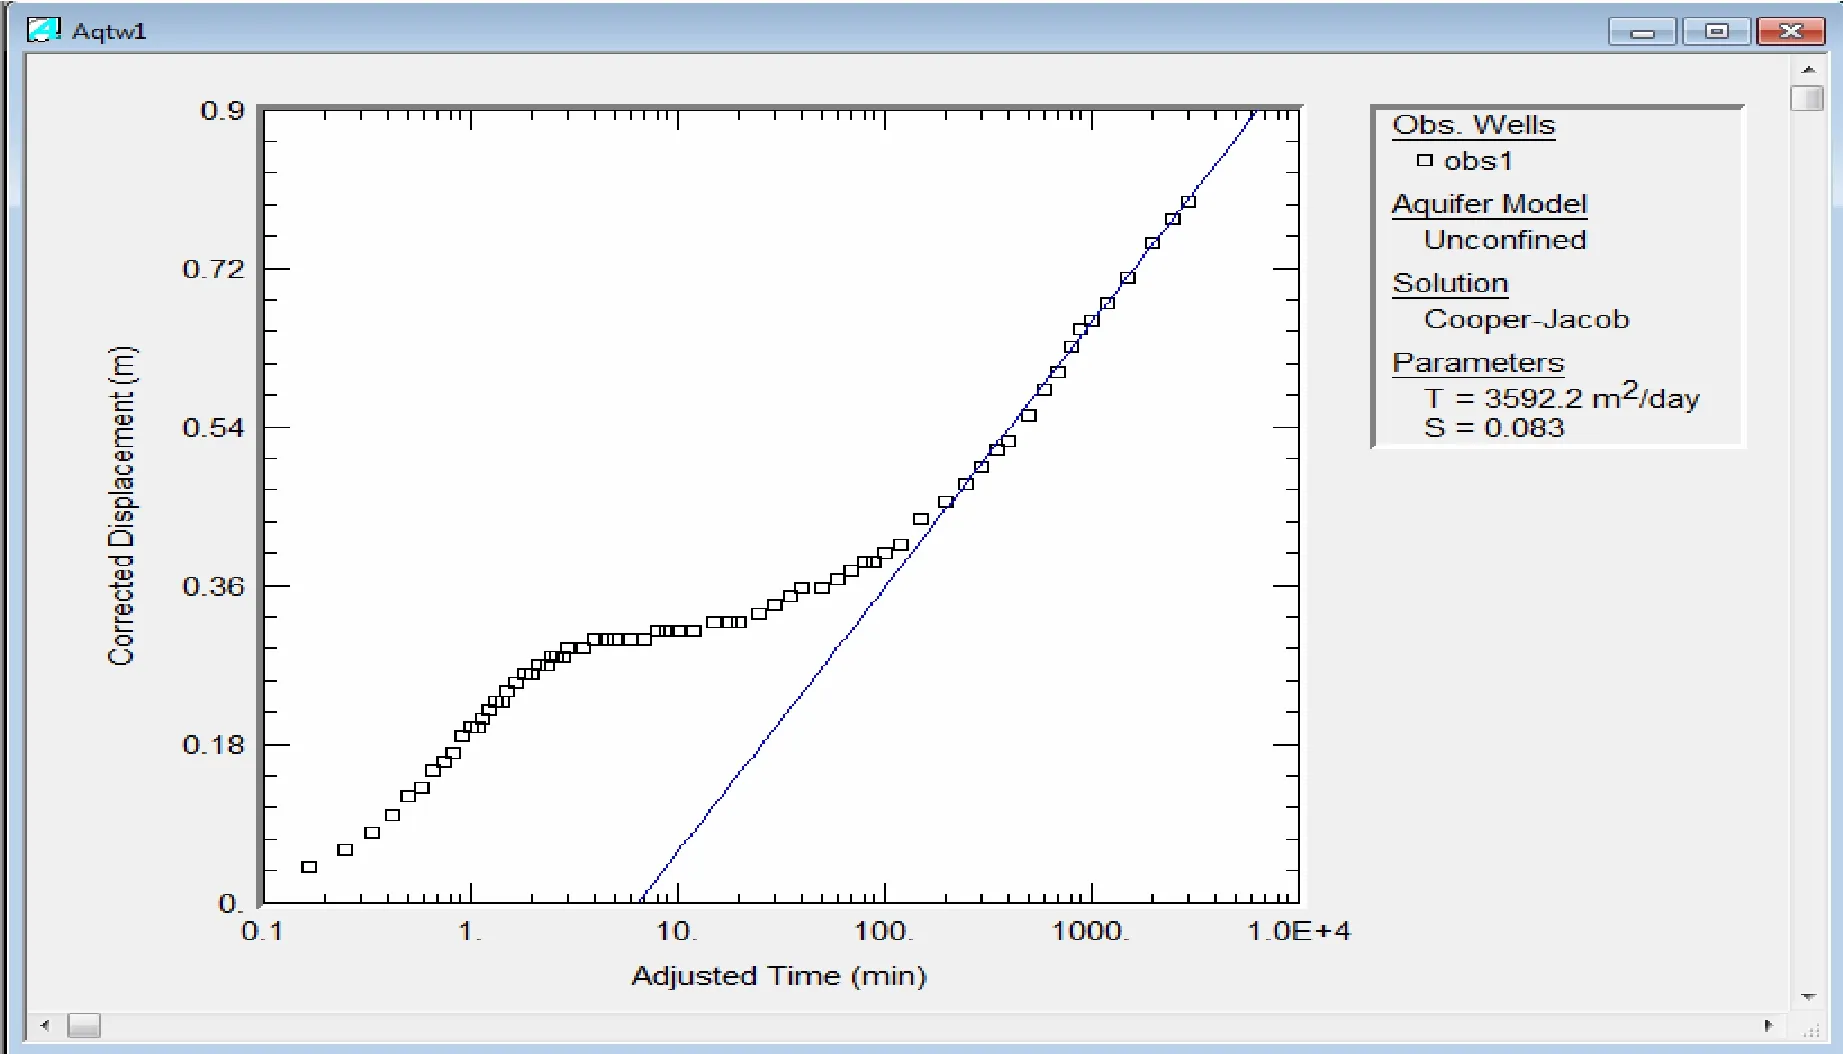
Fig. 7 Jacob solution by AQTESOLV
2.2.2 The test data analyses by Spreadsheet method:

Fig. 8 Jacob solution by Microsoft Excel(spreadsheet) program
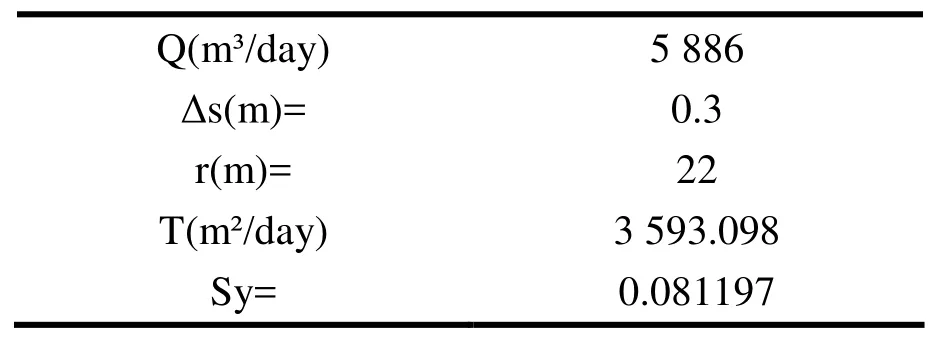
Table 4 Results of Jacob solution
2.3 Results and discussions
The results of the pumping test data analysis by each methods, which are presented in Fig. 2 to Fig. 8. The values of Transmissivity (T), and Storage Coefficient (S) are in the Table 5.
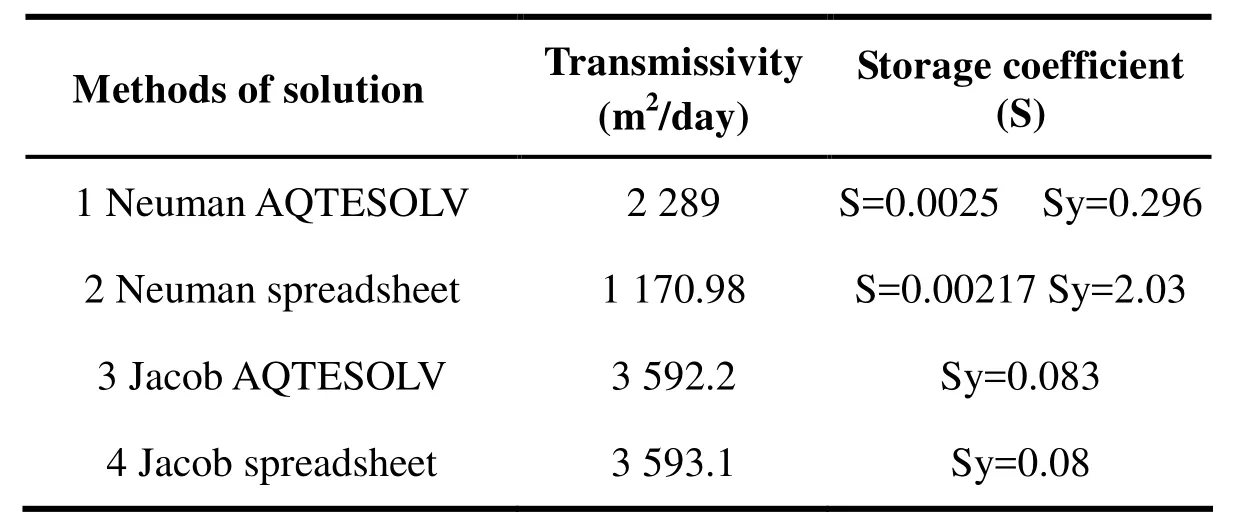
Table 5 The results of the aquifer parameters
The value of Transmissivity matches with the standard range of Transmissivity, Table 6:
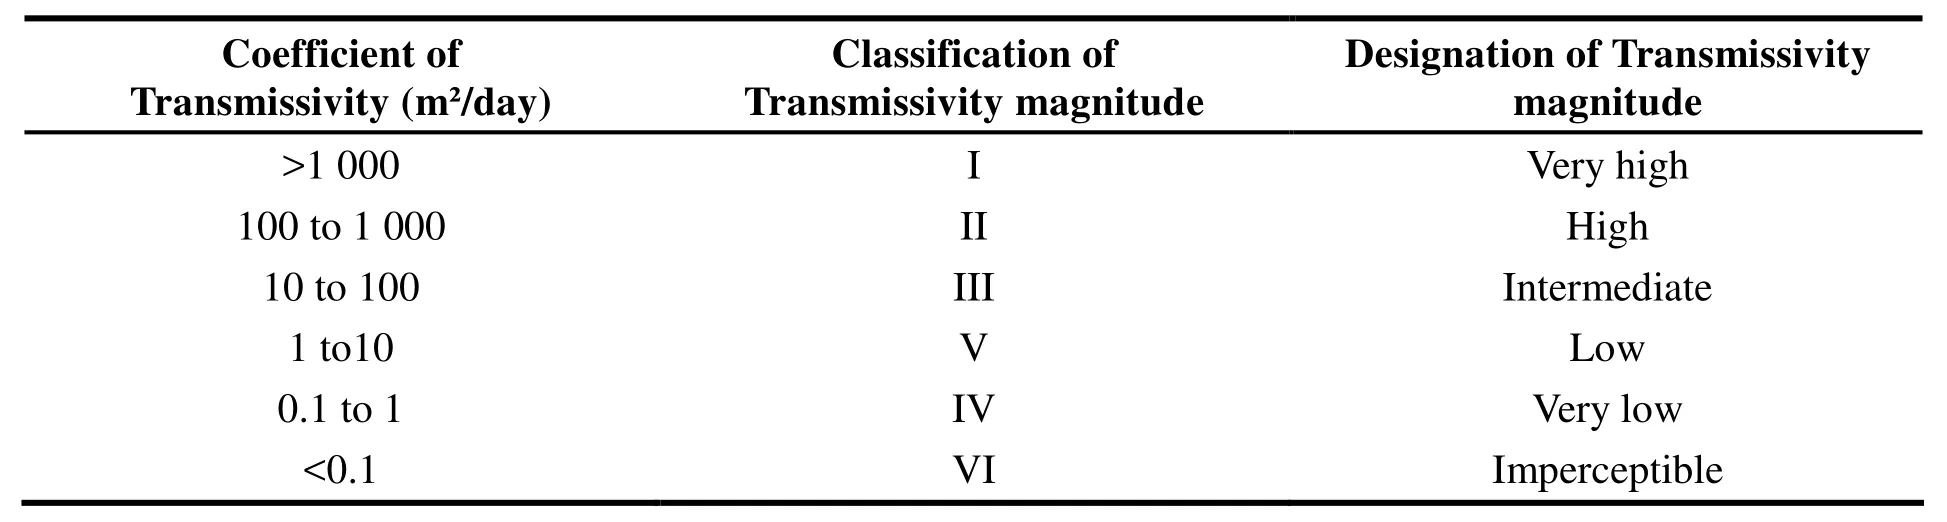
Table 6 Classification of Transmissivity value according to Krásný J (1993)
3 Conclusions
The pumping test results were analyzed using Neuman graphical solution and Jacob straight line solution, the application of both Neuman and Jacob methods are used through the AQTESOLV and spreadsheet program and the results were compared,as presented in the Table 5. The results show that the Jacob (1946) solution through both programs are the similar, which the values of the Transmissivity equal to 3 592.2 m2/day, 3 593.1 m2/day respectively and the values of the specific yield Sy=0.082,and 0.08, However the value of the Transmissivity through AQTESOLV program is equal to 2 289 m2/day and the specific yield of Sy=0.296,and Transmissivity through spreadsheet program is equal 1 170.9 m2/day and the specific yield Sy=2.03, it shows the differences between the two program results. The values of all Transmissivity are matched with the standard range of Transmissivity, if comparing Table 5 with Table 6.The reason behind is that the Neuman solution depends on the trial and error between the field data and the type curve and the superimposing the two curves faced to more difficulties during the test data analysis, however the hand on of the both program may improve the quality of the results.
Also, the results of both methods cleared that,if the drawdown adjusted for unconfined aquifer, it is more applicable to analysis the data by Jacob solution, however, the application of Neuman depends on the matching with type curve, this may produce the approximate values of results not exactly, this difference is clearly explained in results of data analysis, in contrast, in case of unconfined aquifer, the results of Transmissivity is no longer constant, which is the main difference with confined aquifer condition, and it is observed the values of the Transmissivity decrease with increasing of the drawdown under the assumptions of isotropic unconfined aquifer, so that it is recommended to adjust the drawdown in a certain measurement.
杂志排行
地下水科学与工程(英文版)的其它文章
- Dynamic influence of Holocene characteristics on vadose water in typical region of central North China Plain
- Distribution characteristics and source of BTEX in groundwater in Guangzhou, Guangdong Province, P. R. China
- Exploration on compound water circulation system to solve water resources problems of North China Plain
- Evaluation of coordinated development of regional resources and economy around Shandong Peninsula urban agglomerations
- Evaluation of water resources carrying capacity of Gonghe basin based on fuzzy comprehensive evaluation method
- Comprehensive suitability evaluation of urban geological environment in Zhengzhou-Kaifeng area