Dynamic Soft Tissue Deformation Estimation Based on Energy Analysis
2016-12-09GAODedongLEIYongandYAOBin3
GAO Dedong, LEI Yong, and YAO Bin3
Dynamic Soft Tissue Deformation Estimation Based on Energy Analysis
GAO Dedong1, 2, LEI Yong1,*, and YAO Bin1, 3
1 State Key Laboratory of Fluid Power and Mechatronic Systems, Zhejiang University, Hangzhou 310027, China;2 School of Mechanical Engineering, Qinghai University, Xining 810016, China;3 School of Mechanical Engineering, Purdue University, West Lafayette, USA
The needle placement accuracy of millimeters is required in many needle-based surgeries. The tissue deformation, especially that occurring on the surface of organ tissue, affects the needle-targeting accuracy of both manual and robotic needle insertions. It is necessary to understand the mechanism of tissue deformation during needle insertion into soft tissue. In this paper, soft tissue surface deformation is investigated on the basis of continuum mechanics, where a geometry model is presented to quantitatively approximate the volume of tissue deformation. The energy-based method is presented to the dynamic process of needle insertion into soft tissue based on continuum mechanics, and the volume of the cone is exploited to quantitatively approximate the deformation on the surface of soft tissue. The external work is converted into potential, kinetic, dissipated, and strain energies during the dynamic rigid needle-tissue interactive process. The needle insertion experimental setup, consisting of a linear actuator, force sensor, needle, tissue container, and a light, is constructed while an image-based method for measuring the depth and radius of the soft tissue surface deformations is introduced to obtain the experimental data. The relationship between the changed volume of tissue deformation and the insertion parameters is created based on the law of conservation of energy, with the volume of tissue deformation having been obtained using image-based measurements. The experiments are performed on phantom specimens, and an energy-based analytical fitted model is presented to estimate the volume of tissue deformation. The experimental results show that the energy-based analytical fitted model can predict the volume of soft tissue deformation, and the root mean squared errors of the fitting model and experimental data are 0.61 and 0.25 at the velocities 2.50 mm/s and 5.00 mm/s. The estimating parameters of the soft tissue surface deformations are proven to be useful for compensating the needle-targeting error in the rigid needle insertion procedure, especially for percutaneous needle insertion into organs.
needle insertion, tissue deformation, energy conservation
1 Introduction
Needles are commonly used to reach targets inside soft tissue in many minimally invasive surgeries. In most needle-based intervention procedures, the needle needs to avoid critical organs and vessels in its path and be able to hit the target accurately[1]. A needle placement accuracy that is within millimeters is required in some common needle-based surgeries, while a better accuracy is desirable in procedures involving the brain, eye, ear and blood vessel[2–3]. In general, human errors, imaging limitations, and needle-tissue interactions all affect the targeting accuracy[4]. Human errors can also result from the surgeon having little experience and insufficient skills, along within voluntary motions of the patients. The ineffectiveness of real-time imaging systems and poor resolution of imaging devices also limit the applications of imaging in some clinical procedures[4]. Therefore, minimizing harm factors is essential for surgical simulation and path planning of surgical robots.
The needle-tissue interaction, including needle deflection and tissue deformation, is another key problem. Several studies have examined the needle deflection for steering needles inside the tissue[5–9]. In a percutaneous surgical procedure, the needle needs to puncture the skin, muscle, and fat, then come in contact with the organ where the target is located. The target may also change its original position with respect to the reference coordinates. In many references, finite element methods are extensively used to compute the displacement of soft tissue[10–15]. DIMAIO, et al[10], regarded the tissue as a linear elastostatic model and computed the tissue deformation using the finite element method. ALTEROVITZ, et al[11], formulated the seed (target) placement error using Euclidean distance and calculated tissue deformation with a finite element model of the linearly elastic material. MISRA, et al[1], also generated finite element meshes of a prostate geometry model from segment images, taking into account the organ geometry and boundary constraints surrounding the prostate. MOSBECH, et al[12], quantified the magnitude and propagation of soft tissue by tracking corresponding makers using methods based on point-based registration[12]. However, the linearly elastic model of soft tissue and quasi-static finite element method described in the works[10–15]cannot describe the dynamic process of soft tissue deformation.
It is difficult to observe dynamic deformation of soft tissue directly. However, the surface deformation and its force response could provide more indirect information to understand the soft tissue completely. It is also essential to understand the surface deformation of organ tissue to assist surgeons or robots using steering needles in hitting the target and accurately avoiding obstacles for soft tissue procedures. For example, it is likely that a needle loading collapse and sudden expansion after penetration could lead to damage of the ventricular posterior wall in fetal cardiac procedures. Generally, organ tissue consists of multiple layers, such as membranes, skin, fat, muscles, etc. Organ surface deformation is also a dynamic process, and includes deformation, steady-penetration, and relaxation phases[16]. An energy-based fracture mechanics approach is presented to investigate the effects of needle velocity on tissue deformation by ALJA'AFREH[17]. However, quantitative tissue deformation was not addressed to guide needle steering. The surface deformation and force response results were used to characterize soft tissue behaviors[18]. However, soft tissue needle insertion procedures were not considered in their studies.
Although there have been several studies on the measurement and modeling of tissue deformation, research on quantitative tissue deformation is insufficient owing to complex behaviors and lack of dynamic information on soft tissue. In this paper, soft tissue surface deformation is explained on the basis of continuum mechanics, while a geometry model is presented to approximate the volume of tissue deformation. The dynamic process of tissue deformation is analyzed from an energy standpoint, and an analytical energy-based model is provided to calculate the volume of tissue deformation on soft tissue surfaces. The experimental setups and measuring methods are then prepared to perform simulated tests for supporting the analytical observations. Both manual and robotic needle-tissue procedures can benefit from quantitative tissue deformation, especially that of organ tissue surfaces.
The rest of this paper is organized as follows: section 2 investigates the shape of deformed tissue and quantification of tissue deformation via the image-based method. In section 3, the energy-based model is presented to analyze the needle-tissue interactive procedure under the assumption of a rigid soft tissue needle insertion. Section 4 illustrates the experimental setups and the results of sensitivity studies. Finally, conclusions and future work are presented in section 5.
2 Geometric Model of Tissue Deformation
The needle insertion procedure is divided into pre-puncture, puncture and post-puncture phases[3]. Tissue deformation mainly occurs at the pre-puncture and post-puncture phases. It is also known that needle deflection is due to flexibility and asymmetrical forces acting upon the needle shaft. This phenomenon is easily found in bevel-tip needles but not in those with symmetric tips[19]. To simplify the needle-tissue interaction, a symmetric-tip needle is assumed as a rigid rod while the tissue is an elastic deformed body, shown in Fig. 1.
Fig. 1. Diagram of a rigid needle insertion intodeformed tissue
When a rigid needle is inserted into soft tissue (the needle deflection is neglected), the volume of the tissue changes with its deformation. The change in tissue volume can be used to quantify the deformation. Fig. 2 shows examples of deformations on the surfaces of artificial tissues, where the dotted circles represent the boundaries of the tissue deformation. In Fig. 2, the dotted circles represent the boundaries of the tissue deformation. An 18G´150 mm needle with four symmetric tips was inserted into a fresh pig liver during experimentation

Fig. 2. Two pictures of typical deformation on the surfaces of artificial tissues
When the needle is inserted perpendicularly into soft tissue, displacements of the points on the soft tissue around the needle are depicted in Fig. 3, in which points 1 and 2 move to 1¢and 2¢after the tissue is deformed. From Fig. 3(a) front view, points 1 and 2 move to 1¢and 2¢after tissue deformation, and points on the tissue shown on the circle also form a circle after the deformation in Fig. 3(b) side view. Additionally,xdenotes the displacements of tissue points, whileis the maximum tissue displacement in thedirection. In other words,=Max{x} is the depth of the tissue deformation.
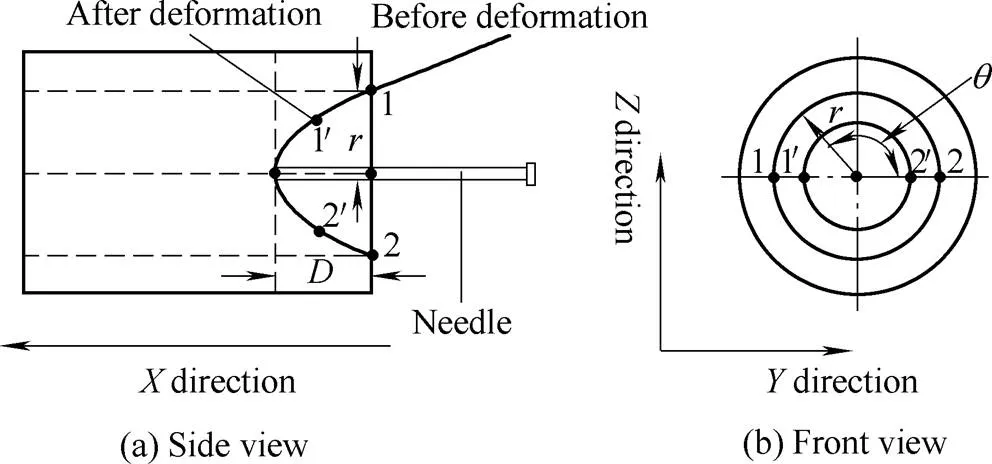
Fig. 3. Side and front view of the tissue deformation
As shown in Fig. 3, there are the following assumptions that: 1) the tissue point (a virtual point) sticking to the needle tip has a displacement in just thedirection and no displacement inanddirections, 2) as the radiusincreases, the displacement indirection attenuates to zero, while the displacements in theanddirections first increase and then attenuate to zero, 3) the displacements in theanddirections move on a circular curve, and 4) the displacements of the points on the tissue are homogeneous on the circle,namely the points on the tissue and circle also forming a circle after deformation.
On the basis of continuum mechanics, the displacement of any point of soft tissue is represented in Eq. (1)[20]:
whereu,uanduare the displacements in the,, anddirections,is the time of needle insertion into the soft tissue,is the radius of the deformation, anddenotes the angle ofwith respect to the positive direction of theaxis.0denotes the original radius, i.e.,, while0,0, and0represent the original coordinates of the point. Based on the aforementioned assumptions, the constraints of Eq. (1) are written as:
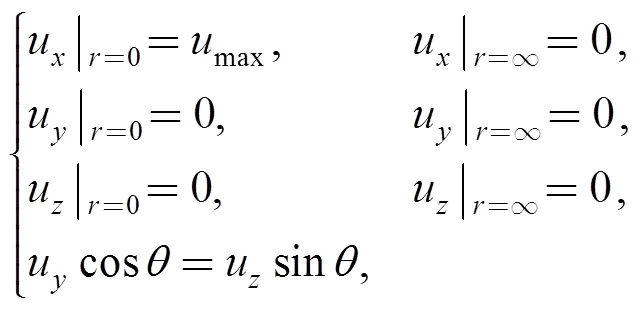
wheremaxdenotes the maximum displacement of the point on the tissue in thedirection, anddenotes the maximum value of(=Max{}), which is defined as the tissue deformation radius.
It is necessary to measure the depth and radius of tissue deformation for compensating the target error in the robotic-assisted needle insertion procedure. However, it is hard to measure the depth and radius directly during the needle insertion surgical process itself. Therefore, it is necessary to estimate the deformation using the non-destructive method.
Fig. 4 illustrates the profile of tissue deformation, which resembles nonlinear curve. The points on the surface of a cone, which satisfy the constraints in Eq. (2), can be used to approach the tissue deformation profile. Therefore, the profile of a cone can be used to approximate the soft tissue surface deformation profile, and the tissue deformation shape can be assumed to be a cone.
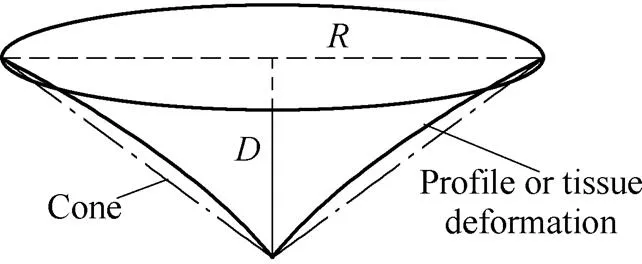
Fig. 4. Profile of tissue deformation
For a cone such as the one shown as Fig. 4, we can easily calculate its volumeVusing Eq. (3) based on knowledge of geometry if the depthand radiusof the tissue deformation are given. The volume of the cone is used to approximate the volume of tissue deformation as
3 Analysis of Needle-tissue Interaction
In this section, the needle-tissue interactive dynamic process is analyzed based on the law of conservation of energy, as well as the relationship between the insertion parameters and tissue deformation being investigated. From an energy standpoint, the needle insertion procedure can be regarded as having three stages of energy change, which includes energy accumulation, energy absorption, and energy storage. The work from needle distortion and tissue deformation is converted into elastic strain energy that is stored in both the deflected needle and deformed tissue. However, the strain energy of the deflected needle can be neglected for a rigid needle insertion into soft tissue. The interaction between the needle and soft tissue lead to frictional heat and viscous energy, which results in conversion to absorbed energy. Details of the analysis are as follows.
3.1 Needle-tissue forces
We first take a differential element from the tissue to analyze its stresses, as shown in Fig. 5(a), where the radial and axial stresses decrease with the increase of the distance to the needle shaft, and the solid and dashed lines represent the element before and after deformation.11and22denote the stresses along the needles axial and radial directions, respectively. The stresses cause the points on the soft tissue to displace along the axial and radial directions. The radial and axial stresses also decrease as the distance to the needle shaft increases. Therefore, points near the needle shaft have bigger displacements with respect to their original position, as shown in Fig. 3.

Fig. 5. Forces analysis of the needle-tissue interaction
The forces acting on the rigid needle are illustrated in Fig. 5(b), where the normal forces are loaded on the needle shaft are equal1=2.1and2are the normal forces exerted on the needle shaft by the tissue.is the needle insertion force, which can be measured using force sensors, andfis the resultant force of the needle loaded by the soft tissue. Other values includem, which is the mass of the rigid needle, and, which is the gravity acceleration constant. For the rigid needle, the analysis of forces is depicted in Eq. (4):
wherexis the needle displacement along the axis of insertion, andfis the sum of all the stiffness, friction, and cutting forces. Because there are no friction or cutting forces at the pre-puncture phase and the stiffness is zero during the post-puncture phase[4], we can infer Eq. (5):
wherestiffnessis the stiffness force before the needle punctures the tissue,fis the frictional force between the needle and the tissue, andfis the cutting force that fractures the tissue. In terms of distance parameters,xis the critical displacement where the needle punctures the tissue at the puncture phase,x<xdenotes the pre-puncture phase, andx>xdenotes the post-puncture phase.
3.2 Energy analysis of needle-tissue interaction
Although the needle insertion procedure was considered a quasi-static process in the readings[21–22], it is actually a dynamic process with energy transitions and crack propagation[23]. More specifically, the external insertion work is converted into the potential, kinetic, elastic strain, viscous, and frictional energies.
The needle insertion process is illustrated in Fig. 6 at two different time frames. During the time period of d, the needle moves fromxtox+dxand the soft tissue crack is propagated under the insertion force. Based on the law of conservation of energy, the external workWis converted to energy in the needle and soft tissue, which is written as Eq. (6):
whereWis the external work,is the potential energy,is the work done by friction and cutting forces,is the viscous energy of soft tissue,is the kinetic energy, andis the elastic strain energy of the soft tissue. A combination ofandis what constitutes the dissipated energy. However, the elastic strain energy of the needle is neglected because the needle is assumed to be a rigid rod.
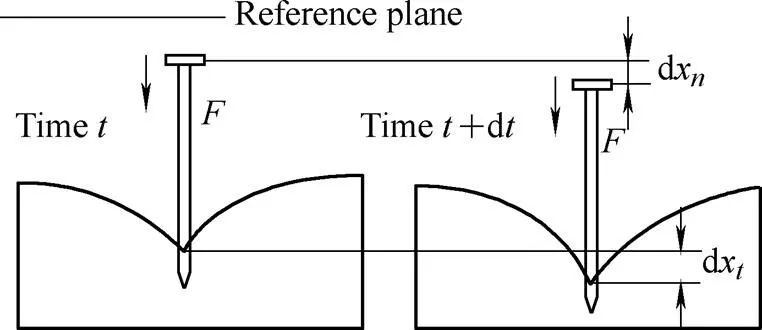
Fig. 6. Two time frames of the needle insertion
The external work is applied from the needle insertion forceand gravitational force, and can be expressed as
Both the potential and kinetic energies constitute the two types of energy in the needle and tissue. The reference plane is taken as it is Fig. 6, and the potential energy is written as Eq. (8):
wheremis the mass of the tissue andxis the displacement of the tissue with respect to the reference plane. As mentioned above, in the pre-puncture phase we have Max{x}=x. When the needle penetrates into the tissue, the tissue displacement is so small with respect to the needle displacement that the incremental potential energy of the soft tissue can be neglected in Eq. (8). Thus, Eq. (8) can be rewritten as Eq. (9):
Similarly, the kinetic energy is written as Eq. (10):
which also includes the kinetic energy of the needle and soft tissue. In Eqs. (9) and (10),ρandVrepresent the density and changed volume of the tissue, respectively. During the whole needle insertion process, the density of the soft tissue can be assumed as a constant. For the needle insertion procedures with a constant velocity, the kinetic energy of the needle can be written aswhich consequently allows the kinetic energy for insertion with a constant velocity to be approximated as Eq. (11):
In the pre-puncture phase, the maximum velocity of the soft tissue is equal to the needle insertion velocity, i.e.,. In the post-puncture phase, the velocity of soft tissue is so small with respect to the needle insertion velocity that the kinetic energy of the soft tissue can also be neglected.
. In the post-puncture phase, the needle-tissue interactions generate dissipated energy, which includes heat generated by the friction, the fracture work used for cutting the tissue, and the viscous energy for overcoming the viscosity of soft tissue. According to the modified Karnopp friction model, the friction depends on the insertion velocity, insertion depth, and the geometry of needle. It should be noted that it is not constant throughout the entire needle insertion process[4]. MOORE, et al[24], also discussed how the tip geometry effects the cutting force. For any given needle, the friction mainly depends on the needle insertion velocity and depth, i.e.,. However, the cutting force can be considered a constant for any given tip-type needle[4], and the friction also can be approximated with a quadratic polynomial equationif[25]. Here,,andare the undetermined coefficients. Thus, the combination of frictional heat energy and the fracture work can be written as Eq. (12):
The viscous energy is calculated by Eq. (13):
whereis the viscosity coefficient that reflects the viscous property of soft tissue. Based on the assumptions mentioned aboveat the pre-puncture phase along withandat the post-puncture phase, Eq. (13) can be approximated as Eq. (14):
With that, the total dissipated energyEcan be rewritten as Eq. (15):
. When the needle is inserted into the tissue, some elastic strain is caused from needle deflection and tissue deformation. While the strain energy of the deflected needle is neglected, the strain energy of soft tissue is considered here. At a given time step, such as dx=0, the elastic strain energy of the tissue deformationUis defined as Eq. (16):
whereσandεare the stress and strain components of the tissue, respectively. Fung, et al[20], suggested that the strain energy per unit volume of rabbit mesentery is an exponential function of the applied stretch and can be extended for application to other tissues. With that, the strain energy rateJmust be employed to describe the strain energy of the soft tissue, which is defined in Eq. (17):
Jrepresents the elastic property of the soft tissue, which correlates with tissue stiffness. Thus, the strain energy can be calculated using
3.3 Energy-based tissue deformation model
During the whole needle insertion process, the needle displacement changes from 0 toxand Eq. (6) can be rewritten as Eq. (19):
Based on Eqs. (7), (9), (10), (12), (18), and (19), the energy conservation expression in the needle-tissue interactive procedure can be written as Eq. (20):
In this equation,Wdenotes the work that is stored or dissipated by the tissue, i.e.,, anddenotes the needle displacement inside the tissue. The change of tissue volumeVcan be taken from Eq. (21) as
4 Experimental Setup and Results
4.1 Experimental setup and materials
The experimental setup consists of a linear actuator, force sensor, needle, tissue container, camera, and light as shown in Fig. 7.
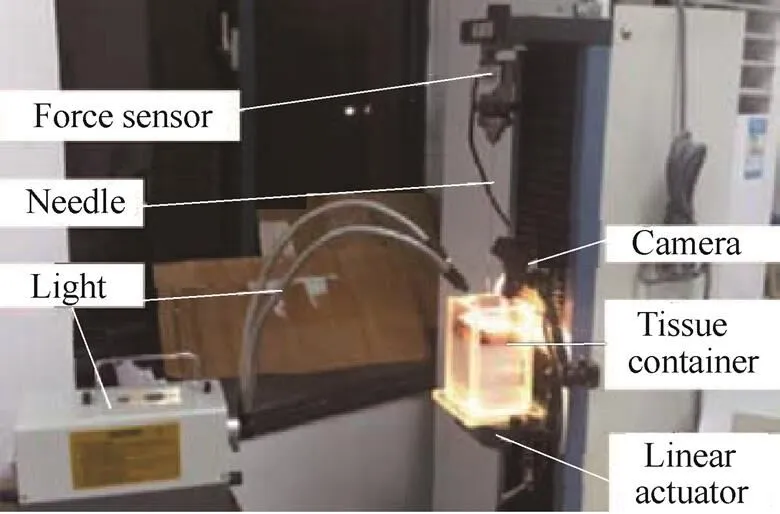
Fig. 7. Needle insertion experimental setup
An 18G´150 mm PTC needle with a trimmed plastic hub (provided by Bard Peripheral Vascular, Inc.) is clamped with a holder instrumented with a force sensor (±0.01 N accuracy, provided by Transcell Technology Inc.). The PTC needle consists of two parts which include the inner solid trocar and outside hollow cannula. A trocar with a symmetrical tip is also used in the experiments. The force and position data are collected with a data acquisition software as the needle is inserted into the tissue sample. The soft material used to mimic real tissue is made of polyvinyl chloride (PVC) modified with plastisol, which was used by Podder, et al[26–27]. A ToupCam microscopic camera (Maximum resolution 1600´1200, Frame rate 30 fps) provided by Hangzhou ToupTek Photonics Co. Ltd., is also exploited to record the radius of tissue deformation. Two 150 W lights, powered by a direct current source, are used to illuminate the artificial tissue from above the container for short exposure. The pictures from the camera are then processed to recognize the edges of the tissue deformation using an edge detection algorithm. From this, the radius of tissue deformation can be obtained through coordinate transformation.
The phantom specimen is created using regular liquid plastic and plastic softener (M-F Manufacturing, TX) in a 12:1 ratio. The artificial tissue is placed in a 120 mm´60 mm´60 mm tissue container that is fixed on a linear actuator, having the ability to move along a slide stage at different velocities. The phantom, of which the Young’s modulus and Poisson’s ratio are 2.5 kPa and 0.50 respectively, has similar mechanical properties to that of a pig liver (Young’s modulus: 3.0–4.0 kPa, Poisson’s ratio: 0.45). Consequently, artificial tissue specimens with a 12:1 ratio are used to approximate real soft tissue in the following experiments. In order to have consistent specimens in all experiments, one mixture batch was produced and cut into three separate 100 mm´60 mm´60 mm artificial tissue blocks.
4.2 Methods for measuring tissue deformation
. Before the needle punctures the tissue, the maximum displacement of soft tissue is equal to the displacement of the needlex, i.e., Max{x}=xand=x. For the post-puncture phase, the relationship between the needle displacementxand the tissue deformation depthis shown in Fig. 8.
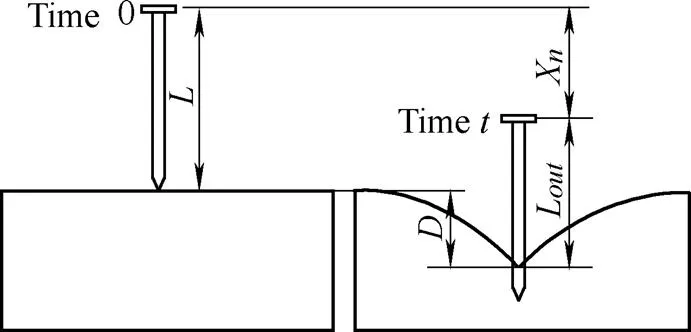
Fig. 8. Relationship between the needle displacement and the tissue deformation depth in the post-puncture phase
Based on Fig. 8, the tissue deformation depth is related to the rigid needle displacement in the post-puncture phase. The depth of tissue deformation|is then calculated as
where|is the tissue deformation depth at time,is the length of the rigid needle,Lt|is the length of the needle outside the tissue at timewhen the needle penetrates the tissue, andx|is the needle displacement at time.
. It is hard to measure tissue deformation radius with a ruler. The image-based method is instead exploited to obtain the tissue deformation radius, and an edge detection algorithm is used to pinpoint the edges of the tissue[28]. A camera is used to capturepictures from the time stepsto+Δ, after which|is measured and calibrated at each time step as
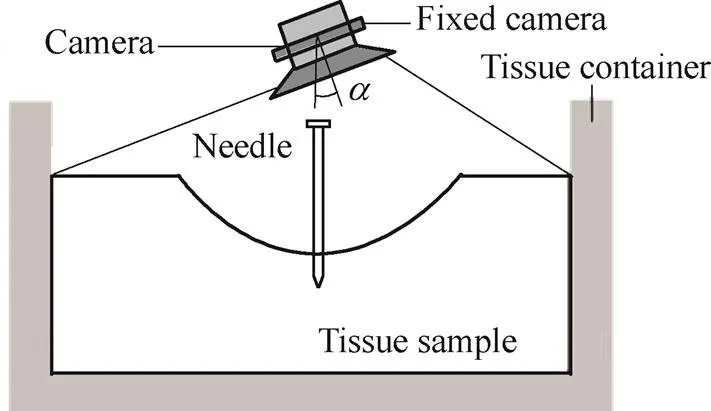
Fig. 9. Image-based measuring system
The measurements of the tissue deformation radius are calibrated using Eq. (25):
whereNis the measured pixel value from theth picture,0is the real dimension,0is the measured pixel value of a standard template, andis the cameras fixed inclination where if<10°, the calibration can be considered reliable[29]. The camera needs to be perpendicularly fixed as much as possible to the tissue deformation surface, which can decrease the angle of fixed inclinationand increase the measurement accuracy[29].
When the tissue deformation is considered to be cone shaped, the height and base radius are replaced byand. Substituting|and|into Eq. (3), the volume of tissue deformation at time,V|is approximately calculated as
4.3 Experimental results and analysis
A series of needle insertion tests were performed on five artificial tissue specimens with the stated dimensions. Fig. 10 shows the relationship between the needle displacementxand the insertion force, depth, and radiusof the soft tissue deformation, and .the bold line indicates the puncturing point, wherex=xandandare at their maximum values.
In Fig. 10, one trocar needle was inserted into five artificial tissue specimens all at the same velocity of 2.5 mm/s. Before the insertion experiment, the needle tip was positioned on the surface of the artificial tissue through operation of the linear actuator. The trocar needle was inserted 50 mm into the artificial tissue with the depth and the radius of the tissue deformation being measured every 0.8 s. The average values of the measurements in the three tests were used in Fig. 10. The relative standard deviations for the insertion force, depth, and radiuswere less than 8%, 10%, and 13%, respectively. Thus, the volume of soft tissue deformationVcould be approximated using Eq. (26).
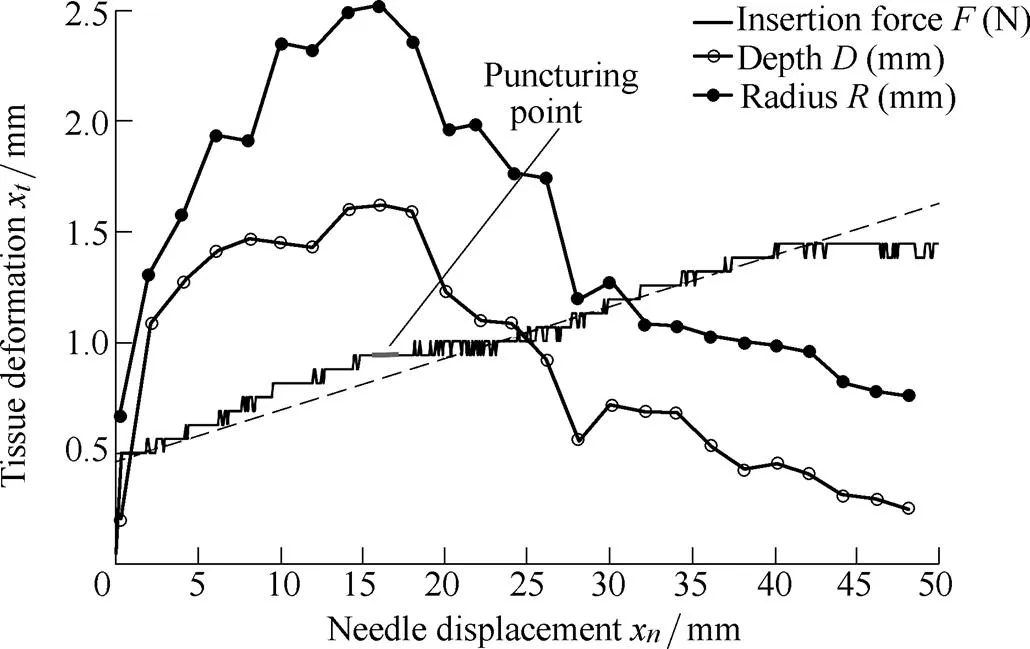
Fig. 10. Relationship between needle displacement and the insertion force, depth, and radius of the soft tissue
In Fig. 10, the dashed line shows the line of best fit of the curve representing needle displacement versus insertion force, indicating that the artificial tissue specimens are relatively homogeneous. The bold line indicates the puncturing point, wherex=x. After the puncturing point the needle is in the post-puncture phase, where the critical displacement is calculated asx=16 mm. Ref. [18] reported that the relationship between the radius and depth of tissue deformation can be fitted with a 1st order exponential function in the pre-puncture phase. However, this relationship is not valid for the post-puncture phase.
It is shown from Eq. (21) that an increasing needle velocitywill decrease tissue deformation. Fig. 11 shows the tissue deformations at velocities of 2.50 and 5.00 mm/s.
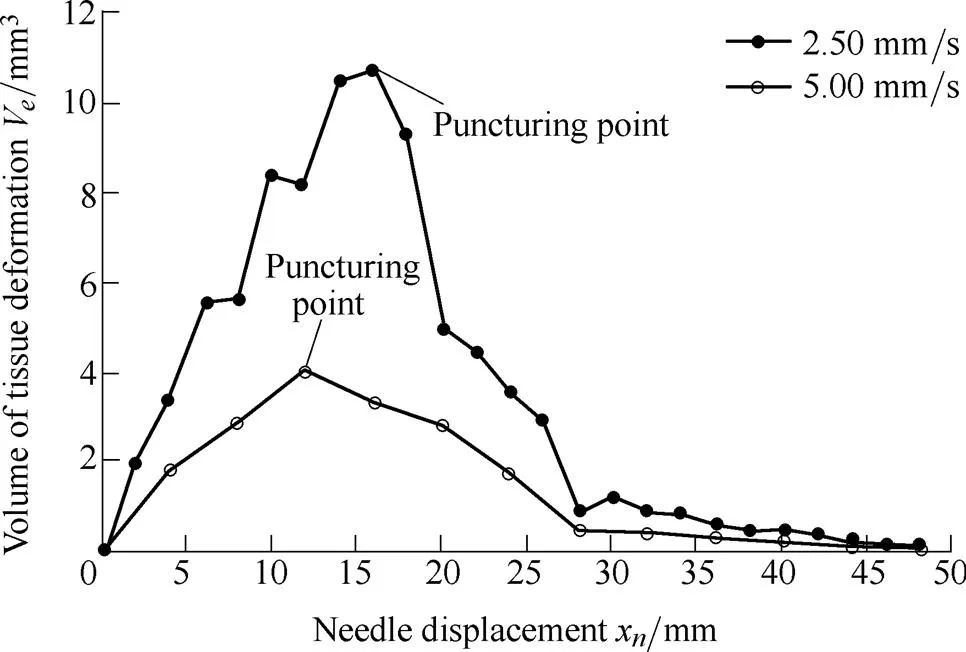
Fig. 11. Tissue deformation at velocities of 2.50 mm/s (x=16 mm) and 5.00 mm/s (x=12 mm)
The volume of tissue deformations in Fig. 11 are calculated using Eq. (26). The higher velocity can increase the needles kinetic energy as well as increasing frictional heat and viscous energy, which results in smaller tissue deformations. Similar results were reported by Mahvash, et al[23, 30].
In practice, it is hard to obtain the strain energy rateJand viscosity coefficientin Eq. (22). However, the parameters (exceptx,, andf) can be considered constants when the needle is inserted into the soft tissue at a given velocity.is dependent on the needle displacementx, andfis approximated with a quadratic polynomial[25]. Thus, Eq. (22) can be replaced by an analytical fitting model, written as
where1,2,3,4,5,6, and7are the undetermined coefficients. The coefficients in the fitted model are dependent upon the properties of the soft tissue and needle insertion velocities. Using the least squares method, the coefficients are calculated to be1=50.32,2=0.542,3=55.65,4=–8.658´10–3,5=0.101 4,6=–3.955, and7=51.82 at a velocity of 2.50 mm/s, while1=11.83,2=–1.08,3=23.35,4=–5.99´10–5,5=0.011 1,6= –0.615 4, and7=10.83 at a velocity of 5.00 mm/s. The fitting model and data from the measurements are compared in Fig. 12.
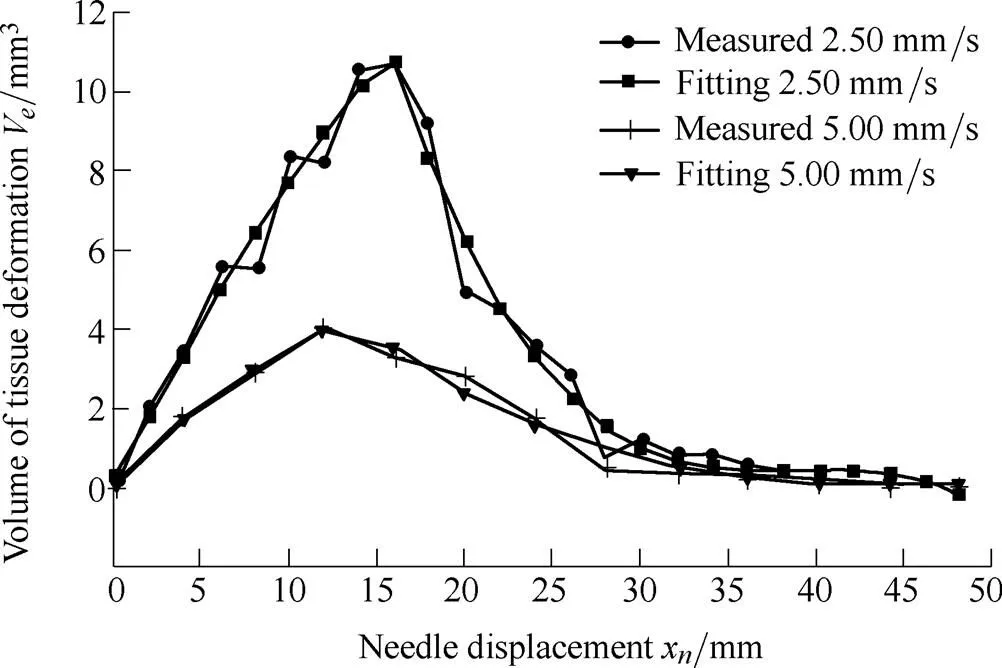
Fig. 12. The fitted model versus experimental results
The root mean squared errors (RMSE) of the fitted model and experimental data were 0.61 and 0.25 at velocities of 2.50 and 5.00 mm/s, respectively. The experimental data accorded well with the fitted model, which can be used for estimating the tissue deformation volume at a given velocity. At the puncturing point (x=x), the tissue deformation volume reaches its maximum value due to work from the needle being converted into dissipated energies after the needle penetrates the tissue.
Although the coefficients in Eq. (27) are different, the geometric profiles of the surface deformations would not change for the same organs and needle insertion surgeries. Therefore, if deformation results against a constant velocity could be obtained, the surface deformation of soft tissue could be estimated. Tissue deformation itself can be obtained from a 3D endoscope or other imaging devices, and the coefficients of the fitted model can furthermore be solved. Since it is difficult for the force sensor to provide dynamic mechanical information, the energy-based analytical idea can be exploited to predict the deformation on the organ surface.
5 Conclusions and Future Work
(1) The geometry of tissue deformation is analyzed, resulting in a cone model being used to approximate the shape of the tissue deformation and to calculate its volume. The external work is converted into frictional heat and fracture work as well as potential, kinetic, viscous, and strain energies during needle-tissue interactions.
(2) The quantitative tissue deformation model is presented based on the law of conservation of energy. An analytically fitted model is also introduced to estimate the volume of the tissue deformation. It is shown that the maximum tissue deformation occurs at the puncturing point, and deformation decreases with an increase in needle displacement during the post-puncture phase because more external work is converted into dissipated energies. Also, deformation decreases with an increase in insertion velocity because more kinetic and dissipated energies are generated at higher velocities. The measurement technique presented in this paper can quantitatively approximate the surface deformation, which is useful for computing visual deformations in surgical simulators.
(3) The energy-based analytical deformation model can also be exploited to identify soft tissue or organ properties with the assistance of image-based measurements, which can be useful for developing a complete physical organ tissue model. Furthermore, the tissue surface deformation dataset and force response could provide more information for characterizing tissue properties[18].
(4) Future work will focus on flexible needle insertion into soft tissue, especially regarding energy generated by needle deflection. The tip shape, size, and insertion velocity of the needle will be tested, with the ex-vivo real soft tissue and boundary conditions of the experiments being employed to verify in particular the tissue deformation model. The estimating parameters of soft tissue surface deformation will be used for compensating the needle-targeting error in the rigid needle insertion procedure, especially in the case of percutaneous needle insertions into organ tissue.
[1] MISRAS, MACURA K, RAMESH K, et al. The importance of organ geometry and boundary constrains for planning of medical interventions[J]., 2009, 31(2): 195–206.
[2] GAO D, LEI Y, ZHENG H. Needle steering for robot-assisted insertion into soft tissue: A survey[J]., 2012, 25(4): 629–638.
[3] YANG X, WANG H, SUN L, et al. Operation and force analysis of the guide wire in a minimally invasive vascular interventional surgery robot system[J]., 2015, 28(2): 249-257.
[4] ABOLHASSANI N, PATEL R, MOALLEM M. Needle insertion into soft tissue: A survey[J]., 2007, 29(4): 413–431.
[5] OKAMURA A M, SIMONE C, O'LEARY M D. Force modeling for needle insertion into soft tissue[J]., 2004, 51(10): 1707–1716.
[6] WAN G, WEI Z, GARDI L, et al. Brachytherapy needle deflection evaluation and correction[J]., 2005, 32(4): 902–909.
[7] ABOLHASSANI N, PATEL R V, AYAZI F. Minimization of needle deflection in robot-assisted percutaneous therapy[J]., 2007, 3(2): 140–148.
[8] GOKSEL O, DEHGHAN E, SALCUDEAN S E. Modeling and simulation of flexible needles[J]., 2009, 31(9): 1069–1078.
[9] WANG Y, CHEN R K, TAI B L, et al. Optimal needle design for minimal insertion force and bevel length[J]., 2014, 36(9): 1093–1100.
[10] DIMAIO S P, SALCUDEAN S E. Interactive simulation of needle insertion models[J]., 2005, 52(7): 1167–1179.
[11] ALTEROVITZ R, GOLDBERG K Y, POULIOT J, et al. Sensorless motion planning for medical needle insertion in deformable tissues[J]., 2009, 13(2): 217–225.
[12] MOSBECH T H, ERSBOLL B K, CHRISTENSEN L B. Quantification and validation of soft tissue deformation[C]//, 2009, 7262: 72621D-1-8.
[13] GAO D, GAO Y, ZHENG H. A finite element approach for simulating soft tissue deformation during needle insertion[J]., 2009, 21(11): 1601–1605.
[14] SEDEH R S, AHMADIAN M T, JANABI-SHARIFI F. Modeling, simulation, and optimal initiation planning for needle insertion into the liver[J]., 2010, 132(4): 041001-1-11.
[15] GOKSEL O, SALCUDEAN S E.[M]. Arizona: Springer, 2010.
[16] AZAR T, HAYWARD V.[M]. London: Springer, 2008.
[17] ALJA'AFREH T. Investigating the needle dynamic response during insertion into soft tissue[J]., 2010, 224(4): 531–540.
[18] AHN B, KIM J. Measurement and characterization of soft tissue behavior with surface deformation and force response under large deformations[J]., 2010, 14(2): 138–148.
[19] MISRA S, REED K B, SCHAFER B W, et al. Mechanics of flexible needles robotically steered through soft tissue[J]., 2010, 29: 1640–1660.
[20] COWIN S C, DOTY S B.[M]. New York: Springer, 2007.
[21] GLOZMAN D, SHOHAM M. Flexible needle steering for percutaneous therapies[J]., 2006, 11(4): 194–201.
[22] ZHENG H, YAO W, GAO D, et al. Projecting beam model for robot-assisted flexible needle insertion[J]., 2011, 51(8): 1078–1083.
[23] MAHVASH M, DUPONT P E. Mechanics of dynamic needle insertion into a biological material[J]., 2010, 57(4): 934–943.
[24] MOORE J Z, MALUKHIN K, SHIH A J, et al. Hollow needle tissue insertion force model[J]., 2011, 60(1): 157–160.
[25] GUO J, GAO D, LI L. Experimentation and insertion force modeling of needle insertion into soft tissue[J]., 2014, 32(3): 37–42.
[26] PODDER T K, CLARK D P, SHERMAN J, et al. Effects of tip geometry of surgical needles: an assessment of force and deflection[C]//, Prague, Czech Republic, 2005, 11(1): 1727–1983.
[27] MCGILLl C S, SCHWARTZ J A, MOORE J Z, et al. Precision grid and hand motion for accurate needle insertion in brachytherapy[J]., 2011, 38(8): 4749–4759.
[28] DUAN R, LI Q, LI Y. Summary of image edge detection[J]., 2005, 3(3): 415–419.
[29] LIU Y, XI A, TAN L, et al. Effects of camera assembly angle to robot working[J]., 2005, 18: 54–55.
[30] MAHVASH M, DUPONT P E. Fast needle insertion to minimize tissue deformation and damage[C]//, Kobe, Japan, 2009: 3097–3102.
Biographical notes
GAO Dedong, born in 1980, is currently a PhD candidate at, as well as working as an associate professor at. He received his master degree from, in 2007. His research interests include computer simulation and bio-manufacturing.
Tel: +86-135-19764535; E-mail: gaodd@qhu.edu.cn
LEI Yong, born in 1976, is currently an associate professor at. He received his PhD degree from, in 2007. His research interests include fault analysis, intelligent maintenance, and precision control.
Tel: +86-153-06522727; E-mail: ylei@zju.edu.cn
YAO Bin, received the B.E. degree in applied mechanics from, in 1987, the M.E. degree in electrical engineering fromin 1992, and the Ph.D. degree in mechanical engineering from the, in 1996. Since 1996, he has been with the, where he was promoted to the rank of associate professor in 2002 and professor in 2007. He was honored as a Kuang-piu Professor in 2005 and a Chang Jiang Chair Professor in 2010 at Zhejiang University, as well. His research interests include the design and control of intelligent high performance coordinated control of electro-mechanical/hydraulic systems, optimal adaptive and robust control, nonlinear observer design and neural networks for virtual sensing, modeling, fault detection, diagnostics, and adaptive fault-tolerant control, and data fusion. He has published significantly on the subjects with well over 150 technical papers while enjoying the application of the theory through industrial consulting.
E-mail: byao@purdue.edu
Received January 25, 2016; revised July 6, 2016; accepted September 9, 2016
Supported by National Natural Science Foundation of China (Grant No. 51665049, 51165040), Science Fund for Creative Research Groups of National Natural Science Foundation of China (Grant No. 51521064), and Qinghai Provincial Natural Science Foundation of China (Grant No. 2015-ZJ-906)
© Chinese Mechanical Engineering Society and Springer-Verlag Berlin Heidelberg 2016
10.3901/CJME.2016.0909.111, available online at www.springerlink.com; www.cjmenet.com
E-mail: ylei@zju.edu.cn
杂志排行
Chinese Journal of Mechanical Engineering的其它文章
- Surface Topography and Roughness of High-speed Milled AlMn1Cu
- Integrated Simulation Method for Interaction between Manufacturing Process and Machine Tool
- Engineering the Smart Factory
- Exploring Barriers and Opportunities in Adopting Crowdsourcing Based New Product Development in Manufacturing SMEs
- Development of the Supply Chain Oriented Quality Assurance System for Aerospace Manufacturing SMEs and Its Implementation Perspectives
- Collaborative Simulation Method with Spatiotemporal Synchronization Process Control
