An hybrid RANS/LES model for simulation of complex turbulent flow*
2016-12-06QunWEI魏群HongxunCHEN陈红勋ZhengMA马峥
Qun WEI (魏群), Hong-xun CHEN (陈红勋), Zheng MA (马峥)
1. Shanghai Institute of Applied Mathematics and Mechanics, Shanghai University, Shanghai 200072, China
2. School of Civil Engineering and Architecture, Nanchang University, Nanchang 330031, China,
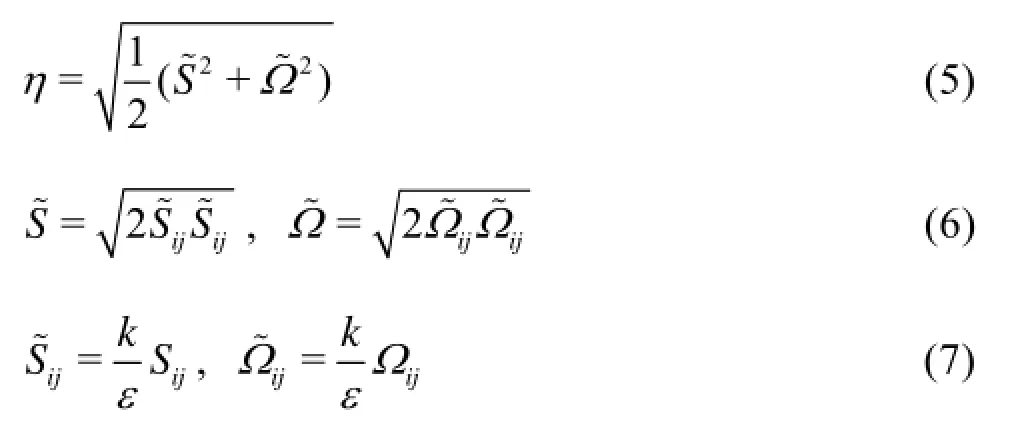
3. China Ship Scientific Research Center, Wuxi 214082, China
E-mail: weiqun210@163.com
An hybrid RANS/LES model for simulation of complex turbulent flow*
Qun WEI (魏群)1,2, Hong-xun CHEN (陈红勋)1, Zheng MA (马峥)3
1. Shanghai Institute of Applied Mathematics and Mechanics, Shanghai University, Shanghai 200072, China
2. School of Civil Engineering and Architecture, Nanchang University, Nanchang 330031, China,
3. China Ship Scientific Research Center, Wuxi 214082, China
A non-linear eddy viscosity model (NLEVM) and a scalable hybrid Reynolds averaged Navier-Stokes/ large eddy simulation (RANS/LES) strategy are developed to improve the capability of the eddy viscosity model (EVM) to simulate complex flows featuring separations and unsteady motions. To study the performance of the NLEVM, numerical simulations around S809 airfoil are carried out and the results show that the NLEVM performs much better when a large separation occurs. Calculated results of the flow around a triangular cylinder show that the NLEVM can improve the precision of the flow fields to some extents, but the error is still considerable, and the small turbulence structures can not be clearly captured as the EVM. Whereas the scalable hybrid RANS/LES model based on the NLEVM is fairly effective on resolving the turbulent structures and can give more satisfactory predictions of the flow fields.
turbulence model, non-linear eddy viscosity model (NLEVM), hybrid Reynolds averaged Navier-Stokes/ large eddy simulation (RANS/LES)
Introduction
The computation of turbulent flows in engineering applications is carried out dominantly by the Reynolds averaged Navier-Stokes (RANS) models for their robustness and low computation costs[1]. The standard -kε eddy viscosity model performs well in applications, but less effective for flows with a high mean shear rate or a massive separation. And this kind of models also suffers from the inability to capture the scale effects of the transient flow for the inherent damping of the unsteady motion[2-4].
The large eddy simulation (LES) can resolve a large range of turbulent scales with the sub-grid-scale eddies modeled and capture the unsteady flow features more accurately[5,6]. A correct LES should have to resolve all the turbulent scales in the flow, including most of the turbulent kinetic and Reynolds shear stresses in a local region[7]. In the LES simulations, the scales which are roughly proportional to the distance from the wall in the turbulent spectrum are very small in the wall boundary layers, so an excessively high resolution is required, almost as high as that in the Direct eddy simulation (DNS). Therefore it is not yet feasible for the LES to simulate flows of high Reynolds numbers in industrial applications.
The hybrid RANS/LES[8-10]is a good compromise between the LES of high computational cost and the RANS of low precision (for unsteady cases). Many studies were devoted to constructing hybrid RANS/LES methods over the past decades, aiming at increasing the accuracy of the simulation and capturing the large scale turbulent structures and flow unsteadiness at affordable costs. There are a large variety of hybrid RANS/LES models. Wall stress models[11,12]are one type, which set the level of the wall stress according to the outer flow, and as a feedback in return an additional drag is added in the near-wall layers to the outer flow LES. This method allows the use of the LES in the outer flow without resolving the viscous and buffer region near the wall, similar to a wall function employed in the high Reynolds number modelling RANS simulation. DES[13]is another type of thehybrid model, in which the same eddy viscosity transport equation is resolved in both RANS and LES regions. The switch location is directly determined by the numerical grid generated, which might lead to a grid-induced separation. Improved DES[14,15]is developed to address that defect by introducing a blending function to limit the length scale. Nichols and Nelson[16]proposed an algebraic hybrid model based on the -kε model. Menter and Egorov developed the Scale-Adaptive Simulation method[17], which introduces the von Karman length scale into the equation system, allowing the model to adjust its behavior to the resolved scales. It was proved that the SAS[18]model behaves very similar to the DES in many flows,but with less explicit impact of the grid used for the simulation.
In this paper, a non-linear RANS model is developed and a new hybrid strategy is introduced, in which the von Karman length scale is imported to switch between the RANS and the LES. The flow around a wind-turbine airfoil S809 is tested to verify the effectiveness of the NLEVM, and then the flow around a triangular cylinder is simulated to study the behavior of these two numerical strategies with the general purpose CFD code ANSYS CFX 12.1.
1. Scalable hybrid RANS/LES model
1.1Non-linear EVM
The eddy viscosity model is widely used in the engineering applications always with good results. But in the flows with a strong flow separation and adverse pressure gradients or streamline curvatures, it fails to provide accurate predictions. The main reason is the use of the linear Boussinesq approach, in which the Reynolds stress tensor is assumed to be proportional to the mean velocity gradients,
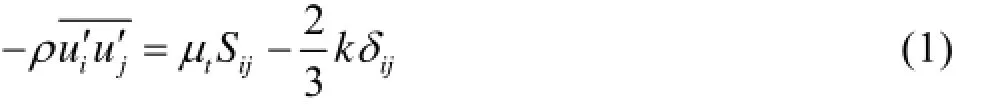
wheretμ is the eddy viscosity, which must be modeled to enclosure the RANS equations.
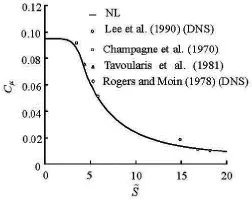
Fig.1 The curve of Cμ
The standard -kε model assumes that the turbulence viscosity could be modeled by the turbulence kinetic energy k and the dissipation ε, as
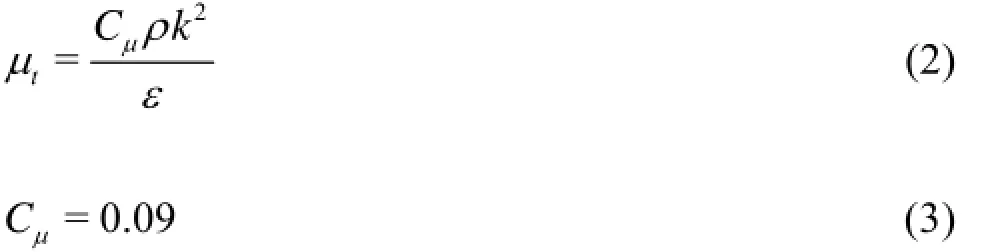
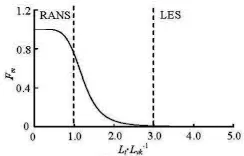
Fig.2 The curve of smooth functionmF
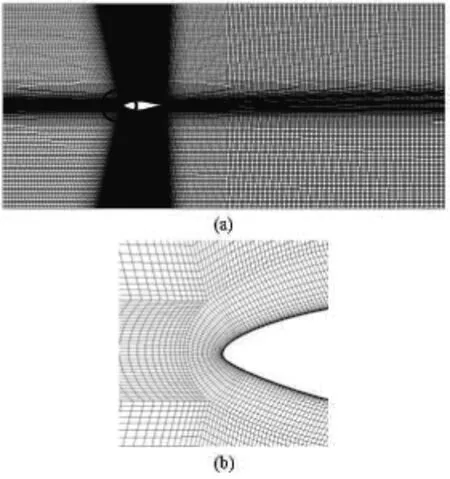
Fig.3 General and amplified detail view of grids around S809
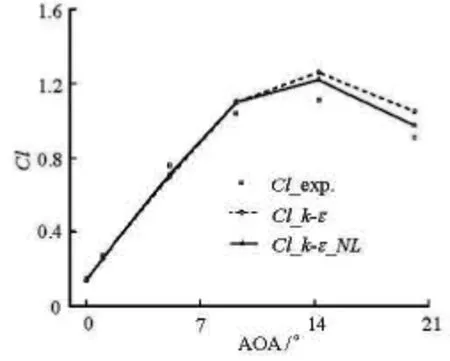
Fig.4 Lift coefficient at various angles of attack
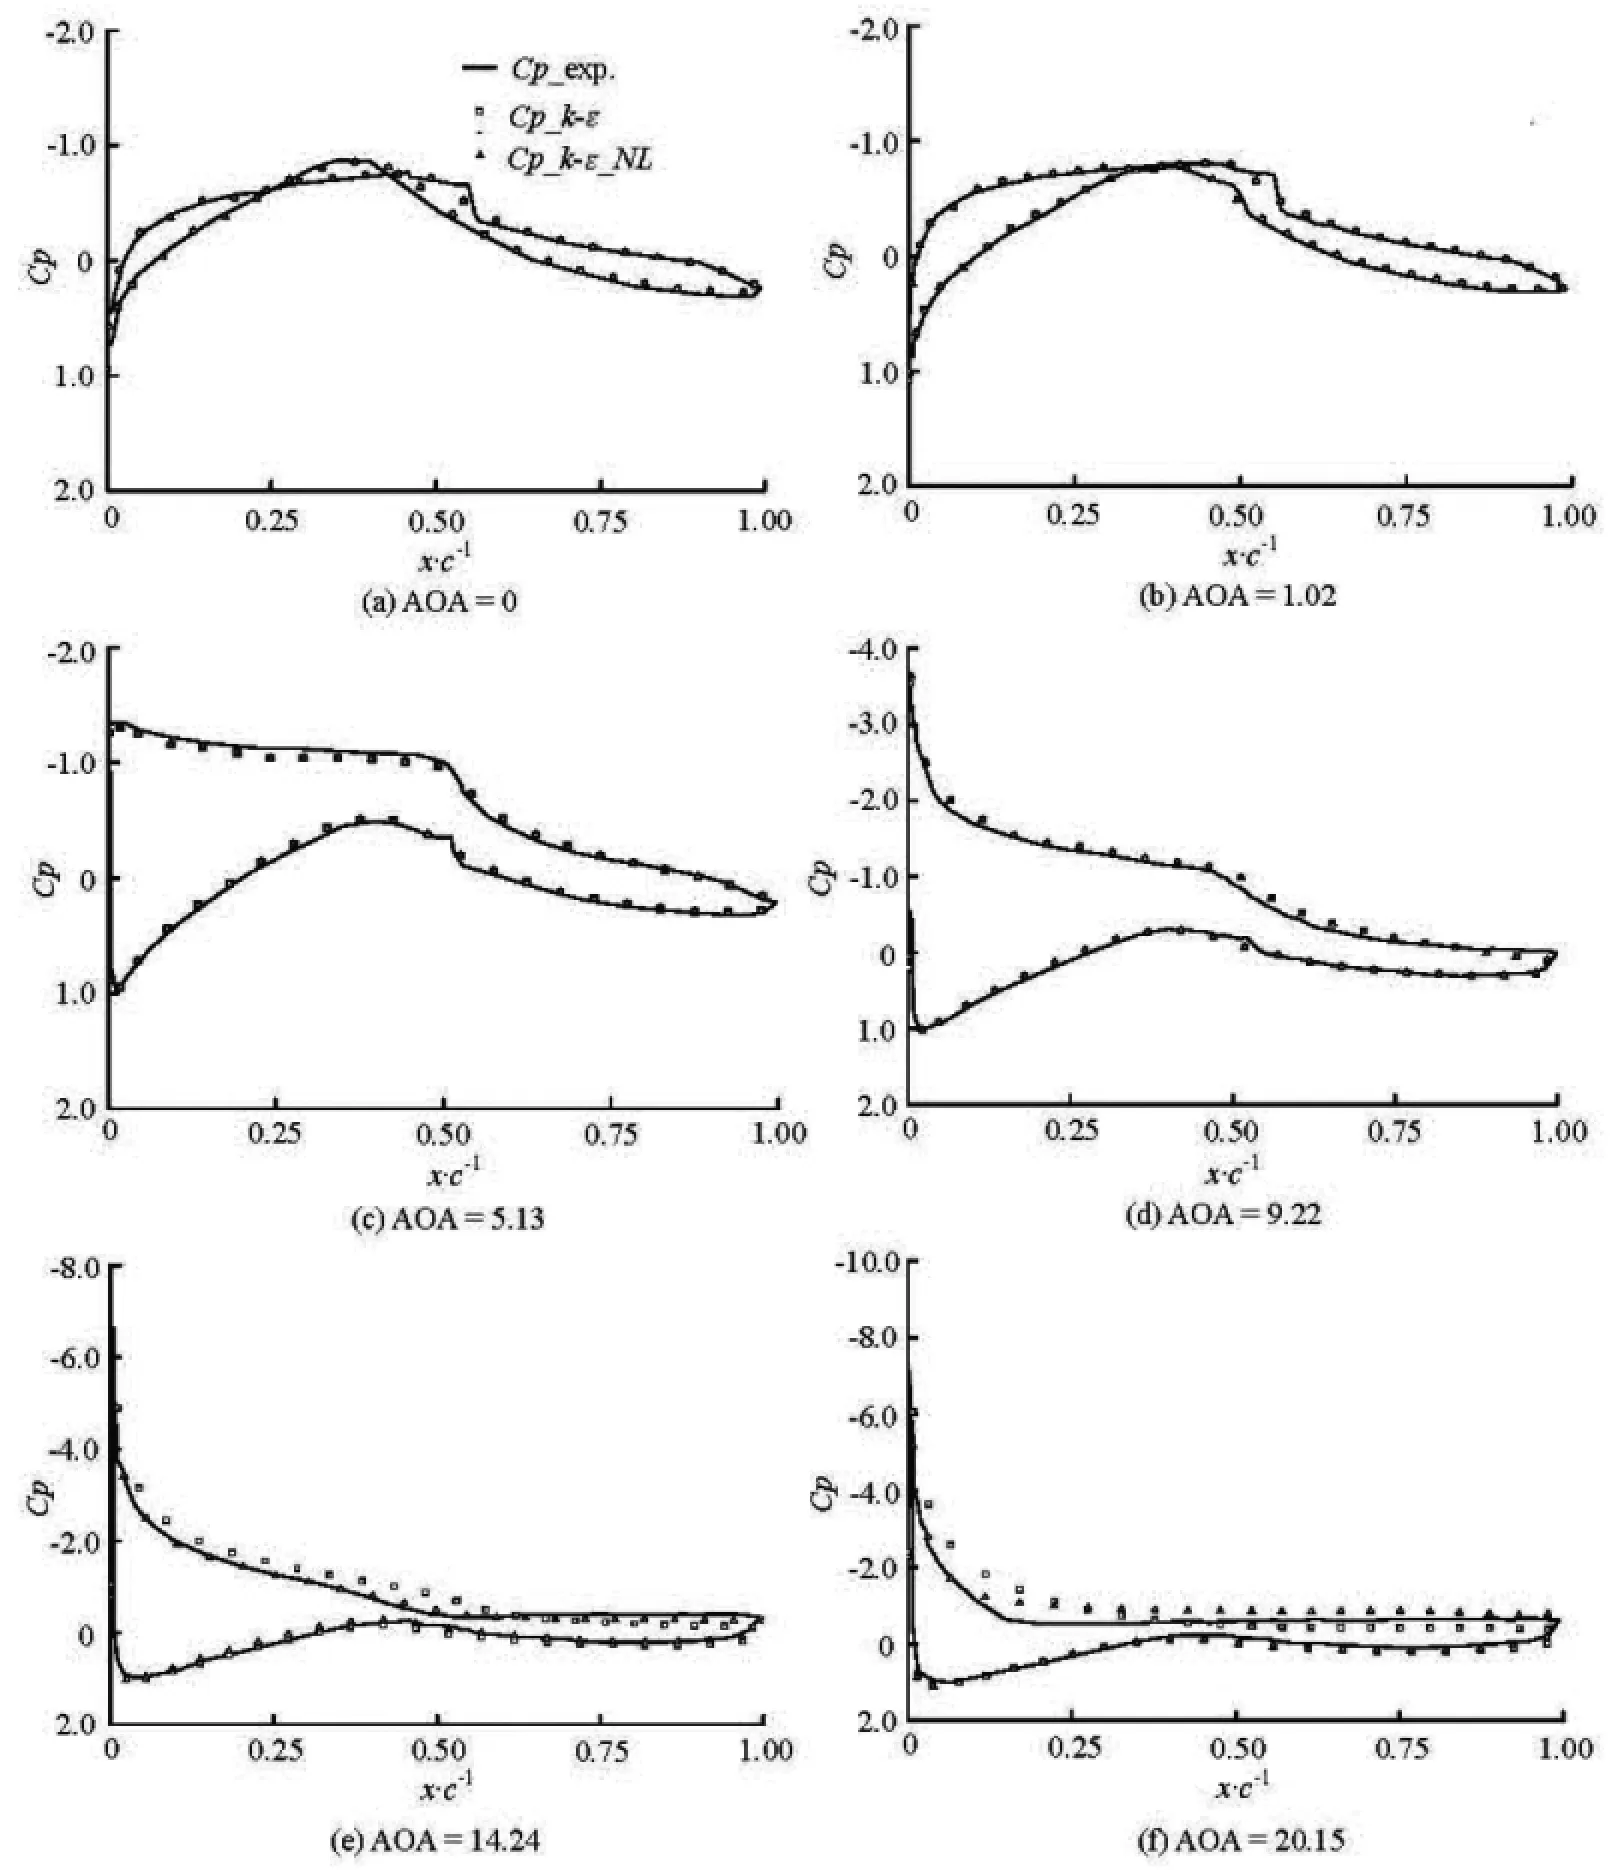
Fig.5 Pressure coefficient distribution on the surface of S809
But many experiments on homogeneous shear and boundary layer flows indicate that the value of Cμis quite different for different S~. For example, in the inertial sub-layer of a flat boundary layer of =S~ 3.3, Cμis about 0.09, and in a homogeneous shear flow of =6.0S~, Cμis about 0.05. So a function based on the strain rate would be used more properly instead of a constant. It was shown by Cooper (1997)and Raisee (1999) that to get more reasonable predictions in the regions of flow separation the value of Cμin the regions of low strain rate should not exceed that in the local-equilibrium region of boundary-layer flows and the Cμvariation should be smooth to avoid the instability. So the function of Cμwas constructed as a piecewise function according to the experiments and the DNS by curve-fitting, as
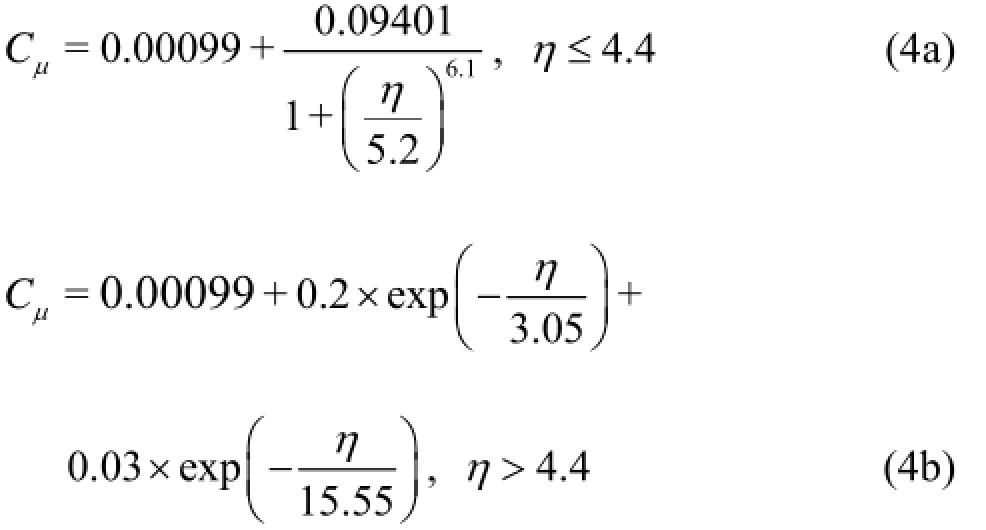
The plotted curve of Cμis shown in Fig.1.
1.2Hybrid RANS/LES model
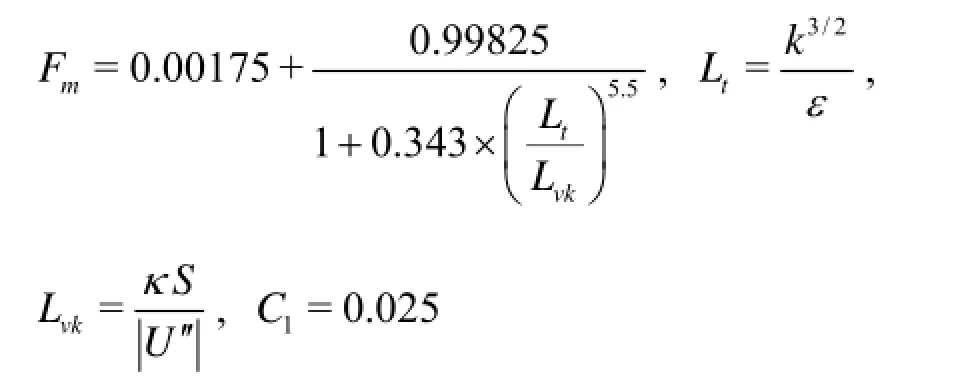
A new hybrid strategy is proposed to allow the adoption of the RANS in the near-wall region and the LES in the outer unstable flow region. It is shown that the von Karman length scalevkL is effective to adjust the turbulence model to the resolved scales, so it is introduced as the critical parameter to determine the transition instead of the local grid size in this hybrid RANS/LES frame system. To guarantee the calculation stability and reduce the mismatch of the velocity profile and the minimum non-physical turbulence physics at the interface, a smooth transition between the RANS and the LES is necessary. A smooth function is established to provide a smooth variation of the eddy viscosity. The eddy viscosity and the smoothing function are as follows:
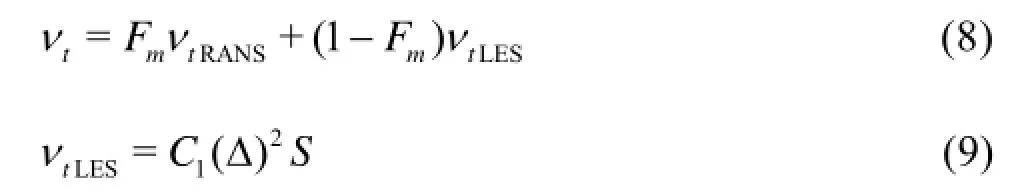
where
2. Tests and discussions
2.1Flow around S809
To verify the effectiveness of the NLEVM, the flow around the wind-turbine airfoil S809 is calculated here, which is a 21% thick airfoil, designed specifically for HAWT applications. The 0.6 m-chord S809 airfoil model was tested in the 1.8 m×1.25 m low-turbulence wind tunnel at the Delft University of Technology (1989), the results of which are used here for comparison with the numerical calculation. The geometry is simplified to a 2-D figure, fixed within an 11C long and 5C wide square cross test section. The mesh is generated with -Ctype structured grids of about 340 elements along the airfoil's surface and 24 cells normal to the surface in the -Ctype grid topology. The grids are shown in Fig.3. All calculations are made at a Reynolds number of 2×10⁶.
Unsteady simulations are carried out for angles of attack of 0o, 1.02o, 5.13o, 9.22o, 14.24oand 20.15ousing the standard k-ε and k-ε_NL model, respectively. From Fig.4, it is observed that the simulated lift coefficient is accurate when the angle of attack is belowo
5. Above this angle, the calculated lift coefficients are over-predicted, which may be due to the fact that these two models can not simulate the airfoil's stall precisely. But generally the -_kNLε model significantly improves the precision of the lift coefficient, especially, for large angles of attack.
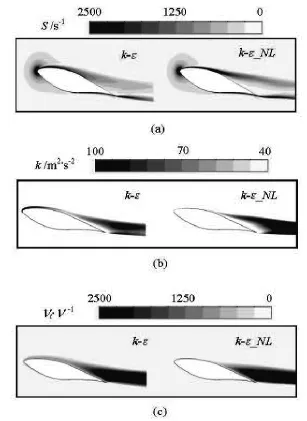
Fig.6 Distribution contour of shear strain rate, turbulence kinetic energy and eddy viscosity ratioo(AOA=14.14)
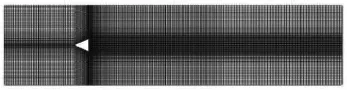
Fig.7 General view of grids around triangular cylinder
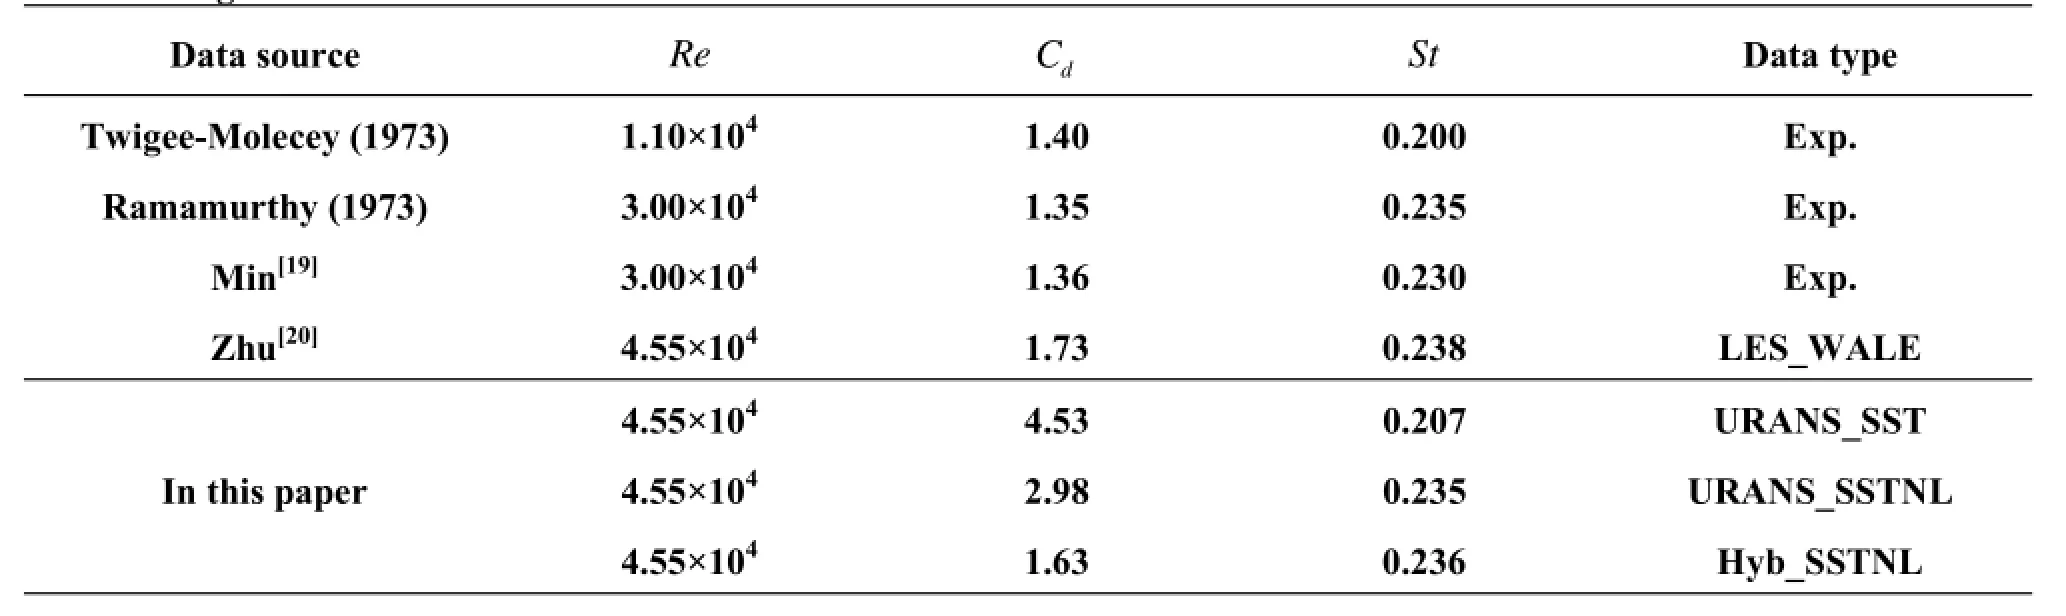
Table 1 Drag coefficients and Strouhal number
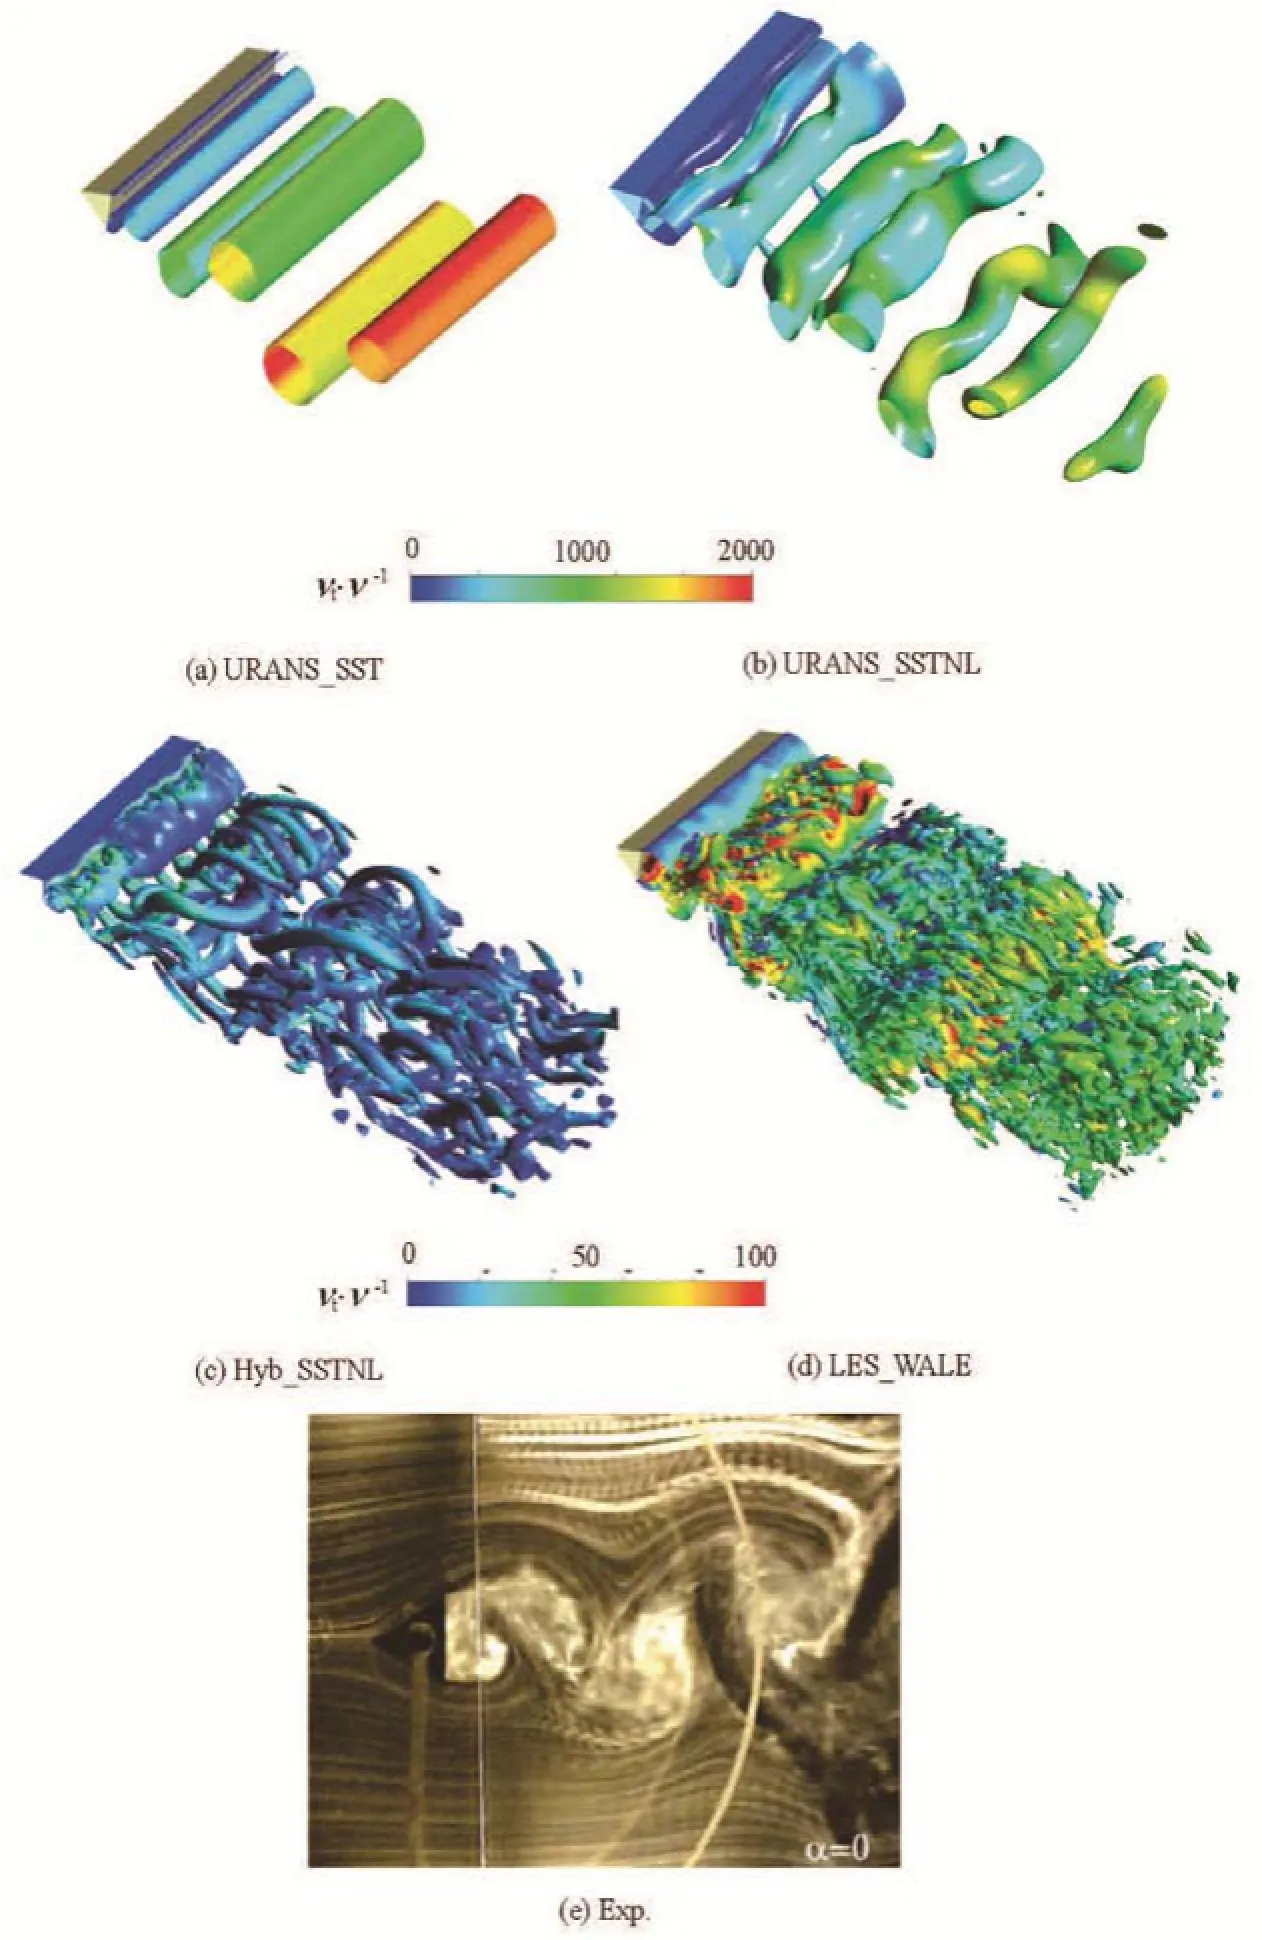
Fig.8 (Color online) Flow structures for flow around triangular cylinder
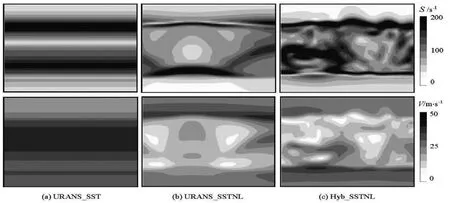
Fig.9 The shear strain rate and velocity contour of cross section =2mx
Figure 5 shows the pressure distribution comparisons at various angles of attack. It can be seen that both calculated pressure distributions are almost the same and agree well with the experiment for 0o, 1.02oando5.13 except the transition bubble, because the model adopted here is a full turbulence model without considering the transition. ForoAOA=9.22, both two turbulent models fail to model the separation occurring on the last 10% of the airfoil. Ato14.24,the distribution contour of the shear strain rate S, the turbulence kinetic energy k and the eddy viscosity ratio (which is the ratio of eddy viscosity to dynamic viscosity νt/ν) are shown in Fig.6, which shows that the shear strain rate is quite large from the leading edge to the center of the airfoil on the suction side, the turbulence kinetic energy and the eddy viscosity predicted by the -_kNLε model are much lower than those predicted by the standard -kε model, and the pressure distribution of the -_kNLε around the airfoil agrees better with the experimental one than that predicted by the standard -kε model. Experimental results show that the aft 50% of the suction surface is the separation region, but the -kε model calculation only predicts the separation over the aft 35%, while the -_kNLε model calculation does predict the aft 50% separation region. ForoAOA=20.15, the calculated amount of separation by the -_kNLε model agrees better with the experiment, in which the flow is separated almost from the leading edge of the foil on suction surface, whereas from the results of the -kε model, the separation is seen only on the aft 50% of the suction surface of the airfoil.
2.2Flow around triangular cylinder
The flow around a triangular cylinder is a classical example of unstable flows. The 2-D section of the grids used is shown in Fig.7. The computation domain is 20a×6a×6a, with 188×80×80 cells in respective directions, where =1ma is the edge length of the triangle. There are 1.47×10⁸hexahedral cells in the overall grids. The Reynolds number based on the free stream velocity and the edge length is 45 500 with the inlet velocity of 17.3 m/s. Periodic boundary conditions are applied in the span wise direction. Unsteady simulations are carried out with a time step of 10-3s and the total time of 30 s, with the initial values of corresponding steady simulation results.
This case is computed with the URANS_SST,URANS_SSTNL and the scalable Hybrid RANS/LES based on the SSTNL model (Hyb_SSTNL), respectively. The experimental drag coefficient and Strouhal number for Re=4.55×10⁴are not available, but those of the same order of magnitude (Re=1.10×10⁴, Re=3.00×10⁴)[19]are very close, which can be used for reference. The results listed in Table 1 show that the calculated drag coefficients are generally larger than the experimental values, with the discrepancy of the URANS_SST the largest, over three times of the experimental value. The URANS_SSTNL reduces the deviation, but the Hyb_SSTNL offers the smallest discrepancy. Except the URANS_SST, the other three models can predict the St correctly.
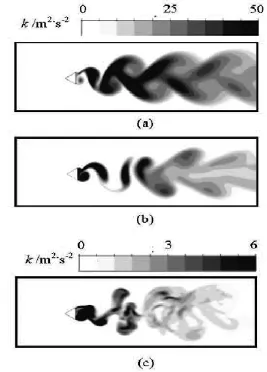
Fig.10 Turbulence kinetic energy
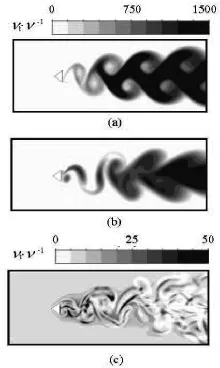
Fig.11 Eddy viscosity ratio
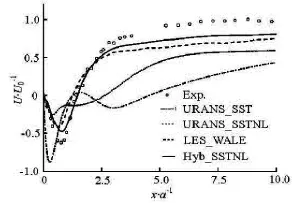
Fig.12 Mean axial flow velocity along centre line behind triangular cylinder
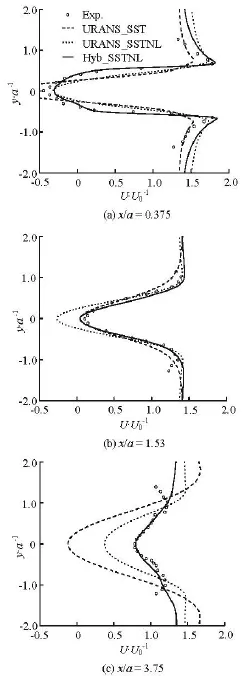
Fig.13 Velocity profiles for different stations downstream the triangular cylinder
In order to explore the capability of identifying the scale effects, some results of the LES_WALE[20]are given here. Figure 8 shows the comparison of the calculated turbulent structures with Q=100l/s2and the experimental ones, which reveals that all models can capture the periodic vortex shedding, but the URANS_SST simulation can only produce the firstorder modal vortex structure, the URANS_SSTNL performs better than the URANS_SST, whereas the Hyb_SSTNL can provide a multi-order vortex structure. As a second order central scheme is used for theLES for the advection terms instead of an upwind scheme for the Hyb_SSTNL as the RANS, the LES_WALE provides much more vortex structures.
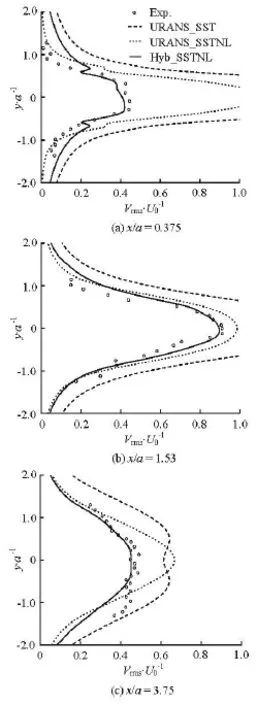
Fig.14 Turbulence velocity profiles at different stations
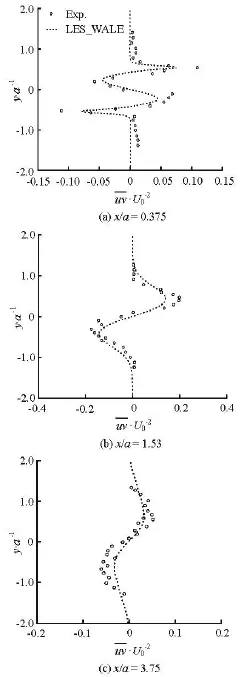
Fig.15 The statistical Reynolds stress profile
Figures 8, 9 show that the URANS_SST can only reveal the 2-D flow feature, on the other hand, the URANS_SSTNL and the Hyb_SSTNL can reveal the 3-D flow characterisitcs. In the SST model, the averaged and fluctuating quantities are introduced to establish the unsteady RANS equations, which represent the mean flow quantities only, while modeling the turbulence effects by the Reynolds stress. Figures 10, 11 display the contours of the eddy viscosity ratio νt/ν and the turbulence kinetic energy k on the central plane, the images show that the eddy viscosity and the turbu len ce k inetic ener gy are th e l argest in t herear zoneofthetriangularcylinderaspredictedbythe URANS_SST, which is followed by those predicted by the URANS_SSTNL and the Hyb_SSTNL. And the eddy viscosity predicted by the Hyb_SSTNL is much lower than that predicted by the two URANS models. The analysis suggests that the SST damps out small scales quickly with the highest eddy viscosity, which accounts for the filtering of turbulence fluctuations in the z coordinate direction and the exhibition of the averaged 2-D flow character. The eddy viscosity is reduced in the SSTNL to some extent with the nonlinear function of the shear strain rate introduced in Cμ,so more unsteady motions along the z coordinate direction are captured with less damping effects, but no better performances on the scale effects because its eddy viscosity is in the same order as that of the SST. The hybrid model behaves the best in capturing theunsteady characters and the scale effects for its scalable feature to adjust to the resolved scales.
The time-averaged axial velocity along the centerline behind the cylinder is shown in Fig.12 in comparison with the experimental data. The velocity profiles at three stations downstream the triangular cylinder(x/a=0.375, x/a=1.530, x/a=3.750) are shown in Figs.13,14. It is concluded that the results of the Hyb_SSTNL agree well with the experimental values,both the URANS_SST and URANS_SSTNL fail to simulate the flow behind the cylinder correctly.
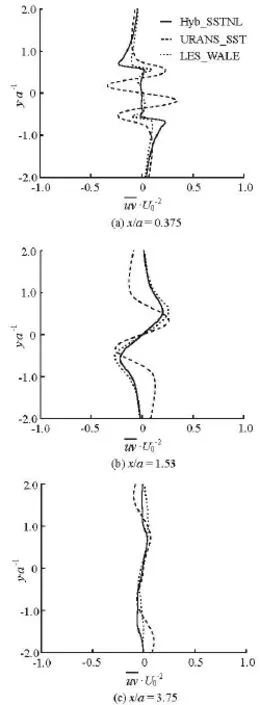
Fig.16 The Reynolds stress by arithmetic velocity correlation profiles
In the LES runs of the Ansys CFX, the Reynolds stress components are automatically generated using the running statistics of the instantaneous transient velocity field, but not for the RANS model. Figure 15 shows the statistical Reynolds stress comparison with experimental data, it indicates that the Reynolds stress predicted by the LES_WALE matches well with the experimental data. In the simulation of the Hyb_SSTNL model and the URANS_SST model, the statistical Reynolds stress is not available, the velocity correlation uv is arithmetically averaged on behalf of the Reynolds stress uv. The arithmetically averaged velocity correlation uv profile of the URANS_SSTNL is analogous with that of the URANS_SST. So one of them is shown here comparing with other two results. Figure 16 displays the velocity correlation uv profiles of the LES, the Hyb_SSTNL and the URANS at different positions. It is observed that the Reynolds stress for the Hyb_SSTNL shows a similar character to that of the LES_WALE and it performs better than the URANS.
Generally, the SST fails to predict the unstable turbulence flow, the SSTNL improves the simulation precision including the 3-D effects and the dynamic character to some extent, but the Hyb_SSTNL is a more suitable means for unstable flows, and can simulate flow fields more accurately and resolve the scale effects.
3. Conclusion
To reproduce complex flows featuring separation and unsteady characteristics more correctly, a nonlinear EVM and a scalable hybrid RANS-LES model are constructed in this paper. Testing cases show that non-linear -kε model can greatly improve the simulation accuracy for a large separation flow. Calculation of the flow around a triangular cylinder featuring unstable characteristics indicates that the EVM is not suitable for this kind of flows, the non-linear EVM can improve the prediction accuracy to some extent including the 3-D effect and the unstable character, but the error is still too large and it fails to provide the scale effects. The scalable hybrid RANS-LES based on the NLEVM performs good in simulating the flow field and capturing the unsteady turbulent structures. It is an effective way to capture the scale effects of the transient flow with affordable computation costs.
References
[1]MA Zheng, HUANG Shao-feng and ZHU De-xiang. Study on applicability of turbulenc model in ship computational fluid dynamics[J]. Chinese Journal of Hydrodynamics,2009, 24(2): 207-216(in Chinese).
[2]TUCKER P. G. Computation of unsteady turbomachinery flows: Part 1-Progress and challenges[J]. Progress in Aerospace Sciences, 2011, 47(7): 522-545.
[3]ZHANG Wei, YU Yun-chao and CHEN Hong-xun. The turbulence simulation of off-design condition in centrifugal impellers[J]. Journal of Drainage and IrrigationMachinery Engineering, 2010, 28(1): 38-42(in Chinese).
[4]ZHU B., CHEN H. and WEI Q. Numerical and experimental investigation of cavitating characteristics in centrifugal pump with gap impeller[J]. International Journal of Turbo and Jet-Engines, 2014, 31(1): 1-10.
[5]ZHANG Hui, YANG Jian-min and XIAO Long-fei et al. Large-eddy simulation of flow past both finite and infinite circular cylinders at Re=3900[J]. Journal of Hydrodynamics, 2015, 27(2): 195-203.
[6]TUCKER P. G. Computation of unsteady turbomachinery flows: Part 2-LES and hybrids[J]. Progress in Aerospace Sciences, 2011, 47(7): 546-569.
[7]VENGADESAN S., NITHIARASU P. Hybrid LES-review and assessment[J]. Sadhana, 2007, 32(5): 501-511.
[8]XIAO Zhi-xiang, XIAO Hai-xin and CHEN Qi-bing et al. Simulation of separation flows with RANS/LES hybrid methods[J]. Acta Aerodynamica Sinica, 2006, 24(2): 218-222(in Chinese).
[9]BHUSHAN S., ALAM M. F. and WALTERS D. K. Evaluation of hybrid RANS/LES models for prediction of flow around surface combatant and suboff geometries[J]. Computers and Fluids, 2013, 88(12): 834-849.
[10] CHAOUAT B., DCHIESTEL R. Hybrid RANS/LES simulations of the turbulent flow over periodic hills at high Reynolds number using the PITM method[J]. Computers and Fluids, 2013, 84(19): 279-300.
[11] CABOT W., MOIN P. Approximate wall boundary conditions in the large-eddy simulation of high Reynolds number flows[J]. Flow Turbulence and Combustion, 1999,64(1): 269-291.
[12] VENGADESAN S., NAKAYAMA A. Evaluation of LES models for flow over bluff body from engineering application perspective[J]. Sadhana, 2005, 30(1): 11-20.
[13] SPALART P. R. Strategies for turbulence modelling and simulations[J]. International Journal of Heat and Fluid Flow, 2000, 21(3): 252-263.
[14] SPALART P. R., DECK S. and SHUR M. et al. A new version of detached-eddy simulation, resistant to ambiguous grid densities[J]. Theoretical and Computational Fluid Dynamics, 2006, 20(3): 181-195.
[15] GRITSKEVICH M. S., GARBARUK A. V. and SCHUETZE J. Development of DDES and IDDES formulations for the -kω shear stress transport model[J]. Flow Turbulence and Combustion, 2012, 88(3): 431-449.
[16] NICHOLS R. H., NELSON C. C. Application of hybrid RANS/LES turbulence models[C]. 41st Aerospace Science Meetings and Exhibit. Reno, Nevada, USA, 2003,AIAA 2003-0083.
[17] MENTER F. R., EGOROV Y. The scale-adaptive simulation method for unsteady turbulent flow predictions. Part 1: Theory and model description[J]. Flow Turbulence and Combustion, 2010, 85(1): 113-138.
[18] STAMOU A. I., PAPADONIKOLAKI G. Modeling the 3-D flow around a cylinder using the SAS hybrid model[J]. Global Nest Journal, 2014, 16(5): 901-918.
[19] MIN M. H. A study in flow past triangular cylinders with different apex angles[D]. Doctoral Thesis, Singapore: National University of Singapore, 2004.
[20] ZHU Bing. Researh on the mechanism of performance improving in low specific speed centrifugal pump with gap drainage blades[D]. Doctoral Thesis, Shanghai,China: Shanghai University, 2014(in Chinese).
E-mail: weiqun210@163.com
(July 10, 2015, Revised November 9, 2015)
* Project supported by the National Natural Science Foundation of China (Grant Nos. 51179100, 51279184).
Biography: Qun WEI (1978-), Female, Ph. D., Lecturer
Hong-xun CHEN,
E-mail: chenhx@shu.edu.cn
杂志排行

水动力学研究与进展 B辑的其它文章
- Sharp interface direct forcing immersed boundary methods:A summary of some algorithms and applications*
- On the modeling of viscous incompressible flows with smoothed particle hydrodynamics*
- Flow characteristics of the wind-driven current with submerged and emergent flexible vegetations in shallow lakes*
- Reverse motion characteristics of water-vapor mixture in supercavitating flow around a hydrofoil*
- Study of fluid resonance between two side-by-side floating barges*
- Modelling of a non-buoyant vertical jet in waves and currents*