3D finite-difference modeling algorithm and anomaly features of ZTEM*
2016-12-02WangTaoTanHanDongLiZhiQiangWangKunPengHuZhiMingandZhangXingDong
Wang Tao, Tan Han-Dong♦, Li Zhi-Qiang, Wang Kun-Peng, Hu Zhi-Ming, and Zhang Xing-Dong
3D finite-difference modeling algorithm and anomaly features of ZTEM*
Wang Tao1, Tan Han-Dong♦1, Li Zhi-Qiang1, Wang Kun-Peng1, Hu Zhi-Ming1, and Zhang Xing-Dong1
The Z-Axis tipper electromagnetic (ZTEM) technique is based on a frequencydomain airborne electromagnetic system that measures the natural magnetic field. A survey area was divided into several blocks by using the Maxwell’s equations, and the magnetic components at the center of each edge of the grid cell are evaluated by applying the staggered-grid finite-difference method. The tipper and its divergence are derived to complete the 3D ZTEM forward modeling algorithm. A synthetic model is then used to compare the responses with those of 2D finite-element forward modeling to verify the accuracy of the algorithm. ZTEM offers high horizontal resolution to both simple and complex distributions of conductivity. This work is the theoretical foundation for the interpretation of ZTEM data and the study of 3D ZTEM inversion.
Z-Axis tipper electromagnetic, finite-difference method, tipper, three-dimensional forward modeling, airborne electromagnetic
Introduction
The transmitting frequencies of artificial sources in aeroelectromagnetic (AEM) methods are in the range 200–195000 Hz, and the effective recognition depth is limited to several hundred meters under the surface (Wang and Wang, 2011). In contrast, natural-source electromagnetic methods are capable of detecting geoelectric structures at greater depths. Thus, it is reasonable to attempt integrating the two methods and produce a natural-source airborne electromagnetic technique in which the responses of three-dimensional structures are depicted using tipper data. The audio frequency magnetic method (AFMAG) can recognize conductive targets and was initially proposed by Ward (1959), who used a scalar tipper to characterize the AFMAG responses. However, the polarization direction of the inductive electromagnetic field varies randomly over time, which leads to variations in the strength of the vertical magnetic field component. As a result, the derived scalar tipper also varies constantly. Vozoff (1972) redefined the tipper data in tensor format to overcome the limitation of AFMAG. The development of AFMAG was slow until Labson et al. (1985) developed a technique to measure the magnetic field with horizontal and vertical coils on the surface, from which the tipper data are derived, and solved the aforementionedproblem. Geotech Inc. improved the data acquisition using the Labson et al. (1985) method and developed the Z-Axis tipper electromagnetic (ZTEM) system.
Owing to its large exploration depth and high working efficiency, the forward modeling approach of the ZTEM system is attractive. Holtham and Oldenburg (2010b) completed the 3D inversion of ZTEM and the joint inversion of ZTEM and MT using the Gauss–Newton algorithm based on the work of Farquharson et al. (2002). Additionally, as a departure from the 2D Occam inversion algorithm, Sattel and Witherly (2012) studied the 2D forward modeling and inverse problem of ZTEM and analyzed various factors affecting the tipper responses.
The most important advantage of ZTEM is the use of the directly observed tipper data. The studies on tipper in China were mainly concentrated on the MT method. Hu et al. (1997) and Chen et al. (2007) studied the characteristics of MT tipper data that were affected by an underground anomalous sphere. Yu et al. (2014) studied the fracture structures using MT tipper data and the results suggested that fracture zones in tunnels could be identified. Lin et al. (2011b) studied the 3D conjugate gradient inversion of tipper data and discussed the 3D full-information inversion that incorporates the tipper and tensor impedance. In addition, the work on the characteristics of the MT tipper data in 2D and 3D has greatly progressed (Tong et al., 2011; Yu et al., 2014).
We adopt the staggered-grid finite-difference method in 3D forward modeling. The discretized Maxwell’s equations in the magnetic field are solved. The accuracy of the algorithm is verified by comparing the forward modeling results with those from other algorithms. Furthermore, the ZTEM responses induced by typical geoelectric models are analyzed in detail. The forward modeling algorithm proposed in this study is the foundation for studying the corresponding 3D inversion algorithm.
The ZTEM model
Workflow and characteristics of ZTEM
The source of ZTEM is the same as that in the MT method; thus, the horizontal magnetic field can be treated as a vertically incident homogeneous plane wave (Lo and Zang, 2008). The vertical components of the magnetic field are measured at a certain height over the entire survey area, whereas the horizontal components of the magnetic field are measured at a ground-based reference station. The workflow is shown in Figure 1.

Fig.1 Workflow of ZTEM.
The ZTEM data acquisition system was developed by Geotech Inc. in 2007. In this system, a horizontal coil is dragged by a helicopter to measure the vertical magnetic field components, while two orthogonally placed vertical coils are used to measure the horizontal magnetic field at a relatively flat area close to the survey area. Time series of the magnetic field are recorded at fixed sampling frequencies and the tipper data are obtained after data processing in the frequency domain. In practice, the frequencies actually applied range from 25 Hz to 720 Hz. Typically, six frequencies of 25 Hz, 37 Hz, 75 Hz, 150 Hz, 300 Hz, and 600 Hz are chosen as the transmitting frequencies. As the large-scale tipper data of the natural magnetic field can be collected in short time, ZTEM is the ideal approach for mapping the subsurface geoelectric structures in three dimensions.
Construction of the tipper parameters
By taking the ratio of the local vertical magnetic field to the remote horizontal magnetic field, the tipper data are obtained and the effect of the unknown source is removed (Labson et al., 1985). The MT tipper data are the ratios of the vertical field component to the two horizontal field components, which are recorded at the same station, whereas the ZTEM tipper data are transfer functions that relate the vertical magnetic fields at a certain height to the horizontal magnetic field at a fixed reference station. The relation is given by (Holtham and Oldenburg, 2010a)

where r is the sampling site of the vertical field, r0is the sampling site of the horizontal magnetic components, and Tzxand Tzyare the tipper components.
First, two polarizations are computed via forward modeling (Tan et al., 2004). The horizontal magnetic field recorded at the reference station is denoted as Hx(1)and Hy(1)in the Ex–Hypolarization, and the vertical magnetic field recorded by the helicopter is denotedas Hz. The horizontal magnetic field recorded at the reference station is denoted as Hx(2)and Hy(2)in the Ey–Hxpolarization, whereas the recorded vertical magnetic field is denoted as Hz(2). The relations between the horizontal and vertical magnetic fields satisfy the following expressions (Holtham and Oldenburg, 2010a)
and solving them yields the following expressions for the tipper data
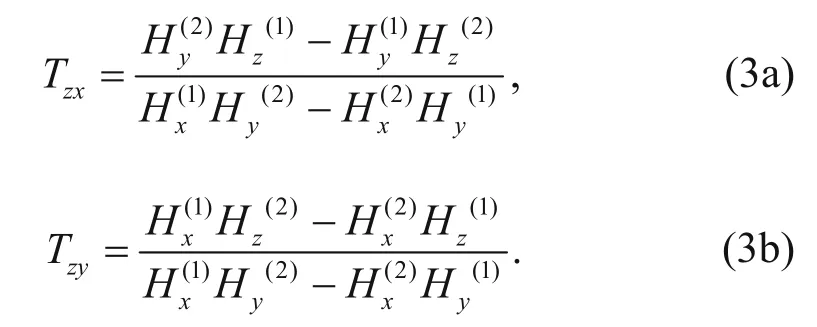
Divergence in the tipper data
To integrate the information carried by the two components of the tipper data into a single parameter, the divergence of the tipper data is specified as (Lo and Zang, 2008)

which is used to characterize the ZTEM responses.
3D finite-difference modeling of the ZTEM field
We assume that the magnetic permeability is constant and equal to the free space μ0. In the practical frequency range, the displacement current can be ignored and the time dependence is chosen as e-iωt. Then, the relation between the electric field E and the magnetic field H can be expressed with the following equations (Lin et al., 2008)

where J is the current density, σ is the conductivity, and ω is the angular frequency.
Similar to the forward modeling of the MT method (Mackie et al., 1993; 1994), the survey area is discretized into a staggered grid in which the magnetic field components are sampled at the center of each edge of the grid cell, whereas the electric field components are sampled at the center of each face of the grid cell. Then equations (5) and (6) are discretized and expressed as a system of linear equations (Tan et al., 2003)

where A is a large symmetrical sparse matrix, H is the vector of the magnetic field to be solved, and b is a vector related to the source and boundary conditions. Furthermore, we denote the magnetic field and the righthand side of the two polarizations as H(1)and b(1)and H(2)and b(2), respectively. Then, the forward modeling equations can then be expressed as

The conjugate gradient method can be used to solve large systems of linear equations and the convergence speed is related to the condition number of A. To improve the condition number of the coefficient matrix A, in which the diagonal part is

the incomplete Cholesky decomposition is chosen as the preconditioner M ≈ CTC. The MR relaxation iteration method, which is an improvement of the conjugate gradient method, is used to solve large complex linear equations. In the relaxation iteration, the divergence correction with respect to the magnetic field is applied to accelerate the iterations.
Starting with equation (3) and in order to obtain the ZTEM tipper responses, the horizontal magnetic components at the reference station and the vertical magnetic field at a certain height are calculated. Considering a given polarization, the magnetic field Hjat site j can be interpolated according to the following equation by using the vector H

hat the
tation is located at the grid cell (i0, j0, k0), and Hxand Hyare defined at the center of the upper surface of the grid cell. Then, equation (9) is transformed to
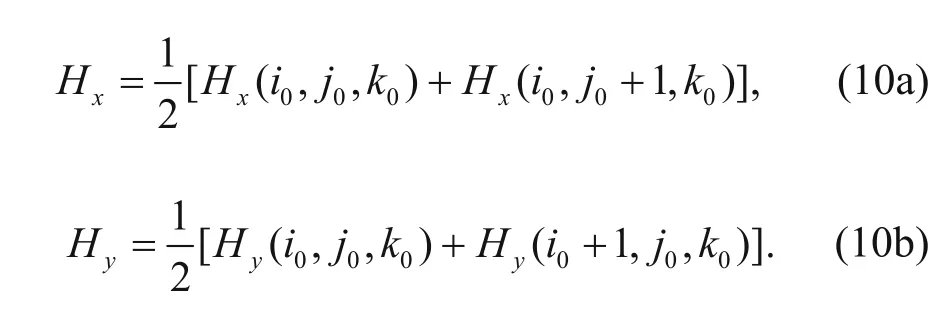
We consider an observation site at grid cell (i, j, kair) with vertical magnetic component Hz. The vertical magnetic component is interpolated by the four adjacent vertical magnetic field components

Substituting H(1)and H(2)into equation (9), the horizontal magnetic fields Hx(1), Hy(1), and Hx(2)and Hy(2)at the reference station, and the vertical magnetic fields at height Hz(1)and Hz(2)can be obtained. We sub stitute these components into equation (3) and obtain the tipper data of the 3D ZTEM.
Algorithm accuracy
To verify the 3D forward modeling algorithm, the 2D prism model of Sattel and Witherly (2012) is modeled numerically. The strike of the prism model is along the y direction, and the prism dimensions on the x–z profile are 100 m × 300 m. The abnormal and background resistivities are 10 Ω·m and 1000 Ω·m, respectively. As shown in Figure 3, the vertical magnetic field is measured at 100 m height. The two horizontal magnetic field components are measured at the fixed station(9500 m, 0 m, 0 m). The tipper responses of the prism are calculated and compared with the 2D finite-element modeling results.
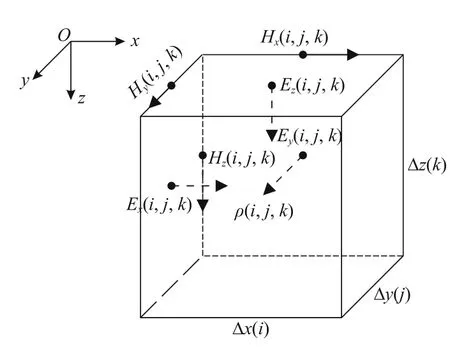
Fig.2 The (i, j, k) grid cell.
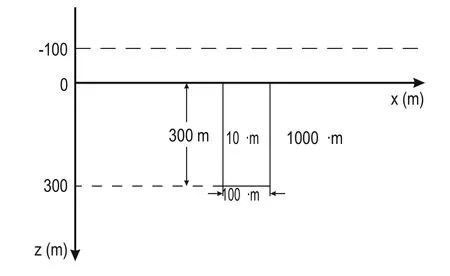
Fig.3 Schematic of the 2D prism.
Figures 4a and 4b are the real and imaginary components of Tzxat 25 Hz and 600 Hz. There is good agreement between the 3D and 2D finite-difference modeling results, which suggests that the proposed 3D finite-difference modeling is reliable.
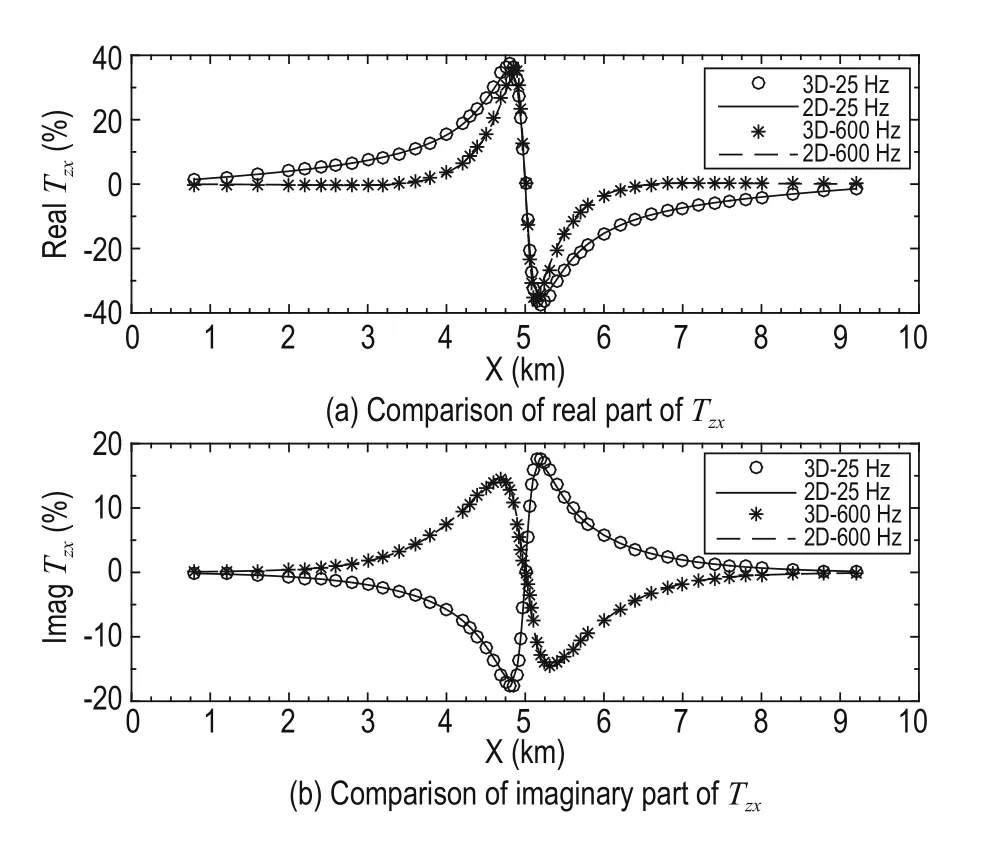
Fig.4 Comparison of the tipper response between the 2D and 3D finite-element modeling results for the 2D prism model.
The ZTEM response characteristics
To study the response characteristics in ZTEM, a simple conductive prism model and a complex model in homogeneous half-space are examined. Then, the plane views of the real and imaginary components of T and the divergence DT are given as well as the pseudosections of T. The response characteristics of ZTEM are discussed in detail below.
Conductive prism model
Figure 5 shows that the 3D conductive prism is embedded in a 100 Ω·m homogeneous half-space. The conductive prism dimensions are 1 km × 2 km × 0.7 km and its resistivity is 1 Ω·m. The top of the conductive prism is at 0.25 km depth. The vertical magnetic field is measured at 100 m above the surface and the two horizontal components of the magnetic field are measured at a fixed point (5750 m, 5750 m, 0 m) on the surface.

Fig.5 Schematic of the three-dimensional prism model.
1. Horizontal characteristics of the tipper data and divergence
Figure 6 shows the tipper responses at 50 Hz. The white solid line denotes the projection of the conductive prism on the x–y plane. As shown in the planar view, for 50 Hz frequency, the real and imaginary components of Tzx on the boundaries along the x and y directions generate positive and negative circular regions, respectively, and at symmetric positions with respect to the center of the conductive prism, the positive and negative absolute values are equal. This denotes the boundary of the conductive prism along the x and y directions. The real and imaginary components of Tzxand Tzyhave the same magnitude. However, the anomalous region of the real components is smaller than in the imaginary components. The real components better reflect the boundaries of the anomaly. Therefore, the horizontal boundary of the target can be identified by the real components of the tipper, even the boundary width of the target. The horizontal position of the conductive prism is between the extremes of the real components, which suggests high horizontal resolution.

Fig.6 Contours of the ZTEM tipper responses Tzxand Tzy, and DT at 50 Hz (conductive prism model).
We calculate the lateral derivative of the two tipper components along their respective directions and the results better reflect the shape of the anomaly in the x–y plane. Figures 6e and 6f show the responses of the real and imaginary components of DT, and the white solid line is the projection of the conductive prism in the x–y plane. The responses of the real and imaginary components of DT are manifested as local positive peaks above the conductive prism; therefore, DT is a better parameter to show the horizontal position of the target. 2. Characteristics of the tipper pseudosection
Figure 7 shows the pseudosections of the real and imaginary components of Tzx(y = 0) and Tzy(x = 0). The pseudosections of the real and imaginary tipper components are sensitive to the horizontal heterogeneity of the geoelectrical structure and form positive and negative wedge regions on the boundaries of the prism along the x and y directions , respectively. The horizontal location of the target is located between the symmetric positive and negative wedges. The anomalies associated with real components tend to appear at lower frequencies than the imaginary components, and the imaginary components contain more information than the real components at higher frequencies. The pseudosections of the real and imaginary components of Tzxand Tzyare not closed. This suggests that the tipper data do not reflect the bottom of the target. Therefore, ZTEM cannot identify the vertical boundary of the target, which is one of the shortcomings of the method.

Fig.7 Pseudosections of the ZTEM tipper responses Tzxand Tzyat different frequencies (conductive prism model).
Complex model
To investigate the tipper responses in more complex cases, a synthetic example consisting of a conductive periphery and a highly resistive core embedded in 100 Ω•m homogeneous half-space, as shown in Figure 8, is modeled numerically. The dimensions of the 10 Ω·m conductive periphery and the 10000 Ω·m resistive core are 3 km × 4 km × 0.7 km and 1 km × 2 km × 0.7 km in the x, y, and z directions, respectively. The depth of the anomaly, the sampling height of the vertical magnetic field, and the site of the horizontal magnetic field are the same as in the previous example.

Fig.8 Schematic for the three-dimensional prism model.
1. Horizontal characteristics of tipper and divergence
Figure 9 shows the tipper responses of the complex model. The white solid line represents the projection of the model on the x–y plane. The responses at the interfaces between the conductive periphery and the resistive core have alternating signs and are symmetric, which suggests that they are the boundaries of the complex model in the x and y directions. The ranges of the real parts of Tzxand Tzyare smaller than the imaginary parts; however, the magnitudes of the real parts arelarger, which leads to better reflection of the horizontal boundaries. The extremes of the responses of the real parts mark the horizontal dimensions of the anomaly. The synthetic example demonstrates that the tipper data can better identify the horizontal conductivity interfaces.
The divergence of the tipper DT shows even better correspondence to the anomaly as suggested by the responses. Nevertheless, the real components are better than the imaginary components in indicating the horizontal position of the anomaly.

Fig.9 Contours of the ZTEM tipper responses Tzxand Tzy, and DT at 50 Hz (complex prism model).
2. Characteristics of the tipper pseudosection
As shown in the pseudosections of the tipper (Figure 10), the horizontal interface of conductivity can be identified by tracing the sign-alternating responses. The anomalies in the real components tend to appear at lower frequencies than in the imaginary components. Blocked by the conductive periphery, the responses of the imaginary components at the boundaries of the resistive core close up, which suggests that the imaginary components are more sensitive at higher frequencies. Apparently, the tipper data are useful in resolving the horizontal heterogeneities of conductivity; however, their capability in reflecting the vertical conductivity interface is very limited.

Fig.10 Pseudosections of the ZTEM tipper responses Tzxand Tzyat different frequencies (complex prism model).
Conclusions
ZTEM, a new airborne electromagnetic method, measures the natural vertical magnetic field by using an airborne electromagnetic data acquisition system. The magnetic field is converted into the vertical field transfer function or tipper and its divergence to identifythe horizontal conductivity heterogeneity. The data acquisition procedure of ZTEM is highly efficient, which makes it a promising fast-scanning geophysical method that can be applied to large-scale geological surveys and mapping of the distribution of 3D electric structures.
The horizontal and vertical features of the tipper and its divergence are studied in detail and suggest that owing to the lack of electric field data, ZTEM does not reflect the vertical boundaries of geological bodies well enough. Therefore, integration with other geophysical methods is recommended. The proposed forward modeling algorithm is stable and robust, provides an efficient approach to understand the ZTEM method, and guides the design and development of ZTEM instruments and exploration.
Acknowledgments
The authors express their sincere thanks to Professors Deng Juzhi and Hu Wenbao, whose critical and constructive comments and suggestions greatly improved the final paper.
References
Chen, Q. L., Hu, W. B., Li, J. M., and Yan, L. J., 2007, Characteristics of tipper response of buried sphere: Journal of Oil and Gas Technology (in Chinese), 29(3), 75-78.
Farquharson, C. G., Oldenburg, D. W., and Haber, E., 2002, An algorithm for the three-dimensional inversion of magnetotelluric data: In Proceedings of the 72nd Annual International Meeting, SEG, Expanded Abstracts, 649-652.
Holtham, E., and Oldenburg, D. W., 2010a, Threedimensional inversion of ZTEM data: Geophysical Journal International, 182, 168-182.
Holtham, E., and Oldenburg, D. W., 2010b, Threedimensional inversion of MT and ZTEM data: 80th Annual International Meeting, SEG, Expanded Abstracts, 655-659.
Hu, W. B., Su, Z. L., Chen, Q. L., Yan, L. J., and Zheng, R. S., 1997, Character of tipper data and application: Oil Geophysical Prospecting (in Chinese), 32(2), 202-213.
Labson, V. F., Becker, A., Morrison, H. F., and Conti, U., 1985, Geophysical exploration with audio-frequency natural magnetic fields: Geophysics, 50(4), 656-664.
Lin, C. H., Tan, H. D., and Tong, T., 2008, Three dimensional conjugate gradient inversion of magnetotelluric sounding data, Applied Geophysics, 5(4), 314-321.
Lin, C. H., Tan, H. D., and Tong, T., 2011a, Threedimensional conjugate gradient inversion of tipper data: Chinese Journal of Geophysics, 54(4), 1106-1113.
Lin, C. H., Tan, H. D., and Tong, T., 2011b, Three-dimensional conjugate gradient inversion of magnetotelluric full information data: Applied Geophysics, 8(1), 1-10.
Lo, B., and Zang, M., 2008, Numerical modeling of ZTEM (airborne AFMAG) responses to guide exploration strategies: 78th Annual International Meeting, SEG, Expanded Abstracts, 27(1), 1098-1102.
Mackie, R. L., Madden, T. R., and Wannamaker, P. E., 1993, Three-dimensional magnetotelluric modeling using difference equations-Theory and comparisons to integral equation solutions: Geophysics, 58(2), 215-226
Mackie, R. L., Smith, J. T., and Madden, T. R., 1994, Threedimensional electromagnetic modeling using finite difference equations: The magnetotelluric example: Radio Science, 29(4), 923-935.
Sattel, D., and Witherly, K., 2012, The modeling of ZTEM data with 2D and 3D algorithms: 82th Ann International Meeting, SEG, Expanded Abstracts, 1-5.
Tan, H. D., Wei, W. B., Deng, M, and Jin, S., 2004, General use formula in MT tensor impedance: Oil Geophysical Prospecting (in Chinese), 39(1), 114-116.
Tan, H. D., Yu, Q. F., Booker J., and Wei, W. B., 2003, Magnetotelluric three-dimensional modeling using the staggered-grid finite difference method: Chinese Journal of Geophysics (in Chinese), 46(5), 705-711.
Tong, X. Z., Liu, J. X., Liu, Y., Gan, J. X., and Zhang, L.W., 2011, Calculating tipper response in two-dimensional magnetotelluric using finite element method. Journal of Jilin University (Earth Science Edition) (in Chinese), 42(Sup.1), 349-354.
Vozoff, K., 1972, The magnetotelluric method in the exploration of sedimentary basins: Geophysics, 37(1), 98-141.
Wang, W. P., and Wang, S. T., 2011, Frequency-domain aero-electromagnetic method and its application: Geology Press, Beijing, 2-6.
Ward, S. H., 1959, AFMAG-airborne and ground: Geophysics, 24(4), 761-789.
Yu, N., Hu, X. Y., Wang, X. B., and Li, J., 2014, Twodimensional magnetotelluric tipper and apparent tipper: simulation and application: Journal of Southwest Jiaotong University (in Chinese), 49(2), 268-275.

Wang Tao received his B.Sc. in geophysics from the China University of Geosciences (Beijing) in 2011. He is presently a graduate student at the School of Geophysics and Information Technology, China University of Geosciences in Beijing. His main research interests are algorithm for electromagnetic prospecting. Email: cugbwt@hotmail.com.
Manuscript received by the Editor June 19, 2015; revised manuscript received July 17, 2016.
*This work was supported by the Natural Science Foundation of China (No. 41374078) and Geological Survey Projects of Ministry of Land and Resources of China (No. 12120113086100 and 12120113101300).
1. Key Laboratory of Geo-detection Ministry of Education and School of Geophysics and Information Technology, China University of Geosciences, Beijing 100083, China.
♦Corresponding author: Tan Han-Dong (Email: thd@cugb.edu.cn)
© 2016 The Editorial Department of APPLIED GEOPHYSICS. All rights reserved.
杂志排行
Applied Geophysics的其它文章
- Broadband seismic illumination and resolution analyses based on staining algorithm*
- Anomalous astronomical time-latitude residuals: a potential earthquake precursor*
- Spherical cap harmonic analysis of regional magnetic anomalies based on CHAMP satellite data*
- Three-dimensional numerical modeling of fullspace transient electromagnetic responses of water in goaf*
- Coherence estimation algorithm using Kendall’s concordance measurement on seismic data*
- 3D modeling of geological anomalies based on segmentation of multiattribute fusion*
