A Solely Radiance-based Spectral Angular Distribution Model and Its Application in Deriving Clear-Sky Spectral Fluxes over Tropical Oceans
2016-11-25LeiSONGandYinanWANG
Lei SONGand Yinan WANG
Institute of Atmospheric Physics,Chinese Academy of Sciences,Beijing 100029
A Solely Radiance-based Spectral Angular Distribution Model and Its Application in Deriving Clear-Sky Spectral Fluxes over Tropical Oceans
Lei SONG∗and Yinan WANG
Institute of Atmospheric Physics,Chinese Academy of Sciences,Beijing 100029
The radiation budget at the top of the atmosphere plays a critical role in climate research.Compared to the broadband flux,the spectrally resolved outgoing longwave radiation or flux(OLR),with rich atmospheric information in different bands, has obvious advantages in the evaluation of GCMs.Unlike methods that need auxiliary measurements and information,here we take atmospheric infrared sounder(AIRS)observations as an example to build a self-consistent algorithm by an angular distributionmodel(ADM),basedsolelyonradianceobservations,toestimateclear-skyspectrallyresolvedfluxesovertropical oceans.As the key step for such an ADM,scene type estimations are obtained from radiance and brightness temperature in selected AIRS channels.Then,broadband OLR as well as synthetic spectral fluxes are derived by the spectral ADM and validated using both synthetic spectra and CERES(Clouds and the Earth's Radiant Energy System)observations.In most situations,the mean OLR differences between the spectral ADM products and the CERES observations are within±2 W m-2,which is less than 1%of the typical mean clear-sky OLR over tropical oceans.The whole algorithm described in this study can be easily extended to other similar hyperspectral radiance measurements.
hyperspectral radiance,spectral angular distribution model,scene type,atmospheric infrared sounder
1.Introduction
The global outgoing longwave radiation or flux(OLR)at the top of the atmosphere(TOA)is uniquely important because of its reflection of the net radiation budget of the climate system.For a long time,OLR has been a critical quantity in climate research,both observationally and in simulations(Ramanathan et al.,1989;Wielicki et al.,2002;Allan et al.,2004).The spectrally resolved radiance(or flux)has significant advantages in evaluating climate models due to its rich information about various atmospheric and surface physical parameters(Goody et al.,1998).One of the advantages of using spectrally resolved flux to evaluate models is the ability to avoid the compensating errors from different bands in a GCM(Huang et al.,2006;Huang et al.,2007).However, the application of spectrally resolved radiance and flux is not as prevalent as that of broadband OLR,mainly because of the difficulties involved in taking measurements.
Satellite instruments can only obtain radiances measured at a certain viewing zenith angle,while fluxes require information from all angles.One working method to convert measured radiance to radiative fluxes is using an angular distribution model(ADM)(Smith et al.,1986;Suttles et al.,1992;Green and Hinton,1996;Loeb et al.,1999).The ADM is usually constructed for different scene types and even for different sub-scene types(hereafter,discrete intervals),which are defined by surface and atmospheric physical quantities (Wielicki and Green,1989;Loeb et al.,2000,2003,2005). These physical quantities largely determine the anisotropic distribution at the TOA and always have to be estimated by utilizing multiple measurements.For example,ADMs applied by the Clouds and the Earth's Radiant Energy System(CERES)for broadband OLR have to combine the cloud mask product and the cloud and aerosol product of MODIS (Moderate Resolution Imaging Spectroradiometer)(Loeb et al.,2003,2005).Modern satellite sensors such as the atmospheric infrared sounder(AIRS)(Aumann et al.,2003a; Chahine et al.,2006),the cross-track infrared Sounder(Bingham et al.,2010),the tropospheric emission spectrometer (Beer et al.,2001),and the infrared atmospheric sounding interferometer(Clerbauxetal.,2009),canprovidehighspectral resolution infrared spectra with rich information about the atmosphere and surface.Numerous studies on the reliability of products of atmospheric and surface parameters retrieved by AIRS radiances have demonstrated an abundance of information content in thermal-IR spectra(e.g.,Susskind et al.,2003; Wu et al.,2005;Le Marshall et al.,2006;Zheng et al.,2015). Hence,we are motivated to explore whether it is possible to develop a solely radiance-based algorithm to derive the spec-trally resolved flux according to hyperspectral measurements, such as those from AIRS.
©Institute of Atmospheric Physics/Chinese Academy of Sciences,and Science Press and Springer-Verlag Berlin Heidelberg 2016
Huang et al.(2008,2010)developed a spectral ADM and successfully derived the spectral flux from collocated AIRS and CERES measurements.Due to the requirement of nearsimultaneous observations as well as the collocation strategy to overcome the differences in resolution or observational area,the combinations between AIRS and CERES increase the difficulties in deriving fluxes and largely reduce the available samples.Here,still taking AIRS measurements as an example,we investigate the possibility of developing a scenetype classification algorithm that is only based on spectral radiance and,consequently,construct solely radiance-based spectral ADMs.The algorithm would not need to combine any other observations and can largely improve the amount of available samples and make better use of hyperspectral information.
As the first step,in this study,we focus on developing the solely radiance-based algorithm for clear skies over tropical oceans,to show the feasibility of,and the procedure for, obtaining the spectrally resolved flux by AIRS only.Section 2 describes the datasets and forward model used in this study.The key new feature of this algorithm is to develop a radiance-based method for estimating the correct scene types and constructing spectral ADMs.The details are described in section 3.Then,validations of the entire algorithm are shown in section 4.Section 5 concludes with a summary and further discussion.
2.Data sets and model
2.1.AIRS and CERES measurements
AIRS,onboard NASA's(National Aeronautics and Space Administration)Earth Observing System Aqua satellite,is an infrared grating array spectrometer with 2378 channels(Aumann et al.,2003a).It measures radiances across three bands (3.74-4.61,6.20-8.22 and 8.8-15.4µm)with a resolving power(λ/Δλ)of 1200(λis the wavelength).AIRS scans from-49◦to 49◦with a horizontal resolution of 13.5 km at the nadir on the surface.AIRS records about 2.9 million spectra per day with good calibration performance and global coverage(Chahine et al.,2006).In this study,the AIRS calibrated radiances(level 1B)in the channels recommended by the AIRS team for level-2 retrieval purposes are applied.It is well-known that AIRS radiances from the 2169-3673 cm-1band contribute little to the longwave flux.So,the spectral fluxes are derived only for 10-2000 cm-1.As in Huang and Yung(2005),we also screen the data with a strict quality control procedure to exclude possible bad spectra.
To validate the predicted broadband OLR,collocated CERES measurements are needed.Two identical CERES instruments(FM3 and FM4)were also aboard Aqua.The instrument field of view of CERES is an approximate 20 km nadir-view footprint on the surface.We only apply the crosstrack CERES observations,since AIRS always operates in such a mode.The CERES datasets used here are the Aqua-CERES level 2 footprint data product,and the Single Satellite Footprint TOA/Surface Fluxes and Clouds Edition 2A(Loeb et al.,2005).For Aqua-CERES-derived regional mean OLR, the estimated bias is 0.2-0.4 W m-2and the estimated RMSE is less than 0.7 W m-2(Loeb et al.,2007).
2.2.Forward radiative transfer model
We use MODTRANTM-5 version 2 revision 11(hereafter,MODTRAN5)as the forward radiative transfer model to construct the whole algorithm.MODTRAN5 is collaboratively developed by Air Force Research Laboratory and Spectral Sciences Inc.(Berk et al.,2005).Comparisons between MODTRAN5 and a line-by-line radiative transfer model(Clough and Iacono,1995;Clough et al.,2005)show good agreement in the thermal IR transmittances and radiances(Anderson et al.,2006).In this study,a synthetic AIRS spectrum is derived by convolving the MODTRAN5 output at a 0.1 cm-1resolution with the spectral response functions of individual AIRS channels(Strow et al.,2003,2006).The spectral fluxes at frequencies not covered by AIRS instruments are also estimated by MODTRAN5 simulations.
3.Algorithm
The anisotropic factor R is the key parameter in an ADM to obtain flux from radiance measured at any zenith angle.It is defined as

where Iν(θ)and Fνare the upwelling radiance and spectra flux at the TOA,respectively.Different from the broadband anisotropic factor used in conventional ADMs,the R here is not only a function of zenith angleθbut also a function of frequency,ν.
Similar to those used in the CERES LW ADM(Loeb et al.,2005),clear-sky scenes are further categorized to different discrete intervals according to the precipitable water (PW),lapse rate(ΔT)and surface skin temperature(Ts).For clear sky over the tropical oceans,14 discrete intervals are enough for all possible clear-sky scenes observed over the ocean(Huang et al.,2008).Therefore,only 14 discrete intervals are included to construct the spectral ADMs in this study.Table 1 lists the details of the 14 discrete intervals.
As mentioned in the introduction,the centerpiece of this algorithm is to develop a radiance-based method to estimate the correct ranges of PW,ΔT and Ts.Then,the appropriate discrete interval can be identified.To do so,we feed profiles from the ERA-Interim[European Centre for Medium-Range Weather Forecasts(ECMWF)Interim Reanalysis] six-hourly output to MODTRAN5 to generate sufficient synthetic AIRS spectra for exploring feasible ways to classify the correct ranges of PW,ΔT and Tsfrom synthetic radiances alone.Combined with the corresponding spectrally dependent ADMs and the algorithm developed by Huang et al. (2008)for frequencies not covered by the AIRS instrument, spectral flux over the entire longwave spectrum can then beestimated.A flowchart summarizing the whole procedure of the algorithm in this section is shown in Fig.1.
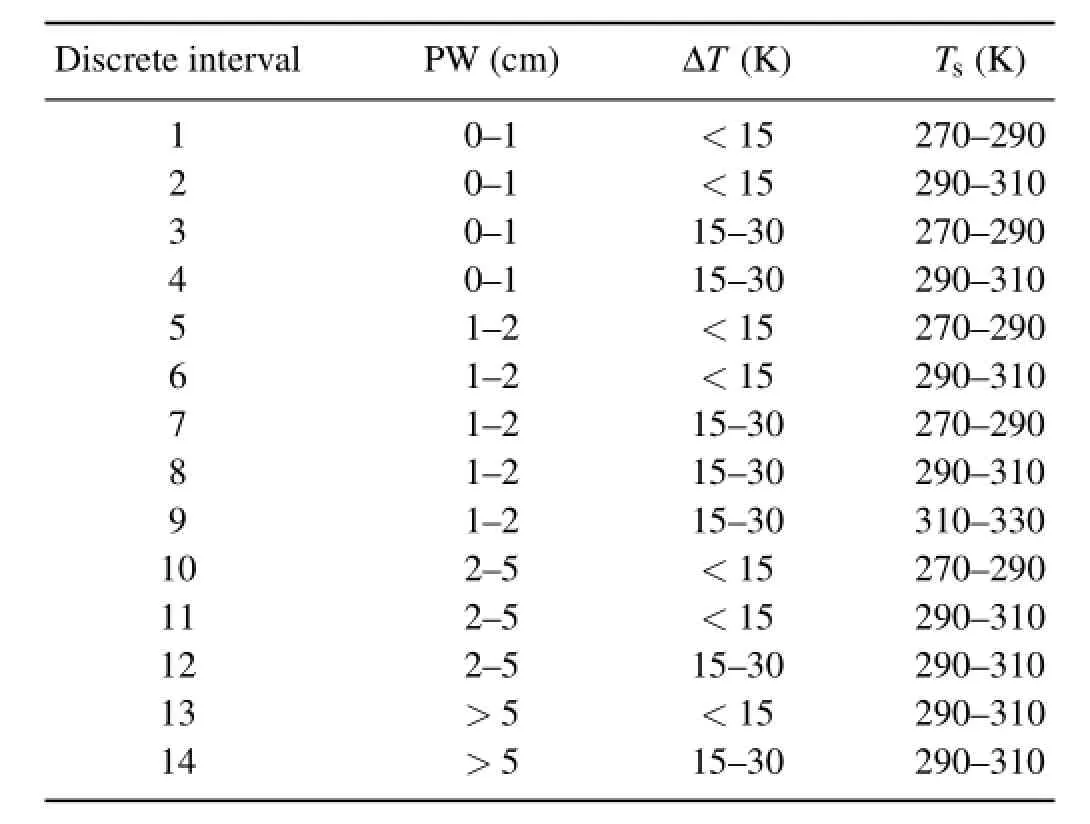
Table 1.The 14 discrete intervals of precipitable water(PW),lapse rate(ΔT)and surface skin temperature(Ts)used in the solely radiance-based estimation method for clear skies over tropical oceans.
3.1.Precipitable water
The PW is also called the total column water vapor.It is defined as the vertical integration of atmospheric water vapor mass.The relationship between the radiance due to the water vapor line absorption and the PW is not simply linear. The continuum absorption of water vapor is the main reason while the atmosphere and surface emissions make the problem more complicated.However,the water vapor continuum in the window region varies slowly with frequency compared to the fast variation of absorption lines.Meanwhile,water vapor in the lower troposphere is the dominant part in water vapor absorption.Since only an estimation of PW is needed in this case,instead of exact retrieval,a double-differential technique is used here to categorize the PW.The doubledifferential technique is based on the different absorption dependencies on frequency to discriminate different absorbers and has been widely used in UV and visible remote sensing (Komhyr et al.,1989;Frouin and Middleton,1990).Here, this technique is applied to remove the continuum contribution so as to improve the accuracy of the estimation of PW from radiance.
Two pairs of AIRS channels with similar frequency intervals in each pair are chosen as channel 1 to 4,as listed in Table 2.The wavenumbers in the selected channels are 779.5 and 780.8 cm-1in one pair,and 827.7 and 829.3 cm-1in the other pair,respectively.Each pair includes a relatively strong absorption line and a relatively weak one.The double differential radiance,Δ Rad,can then be derived as

where Radnis the radiance of the nth channel.In each pair, the spectral interval is 1.3 and 1.6 cm-1,respectively.Given the linear shape of the water vapor continuum in the spectral range,which is very narrow and close,the contribution of slow-varying continuum absorption to Δ Rad is largely removed.The radiance differences caused by water vapor absorption should be closely related to absorption differences between the relatively strong and weak water vapor absorptionlines.Then,thePWcanbeclassifiedexactlybyradiance, without any a priori information.Furthermore,a transparent channel at 963.8 cm-1,listed as channel 5 in Table 2,is also selected to show the impact of Ts.This method is very similar to the classical application for the retrieval of ozone by removing the scattering effect.
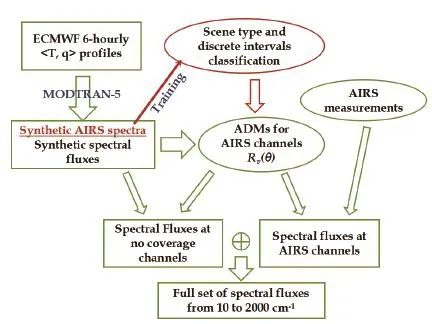
Fig.1.Flowchart illustration of the solely radiance-based algorithm for deriving spectral fluxes from 10 to 2000 cm-1by AIRS observations only.
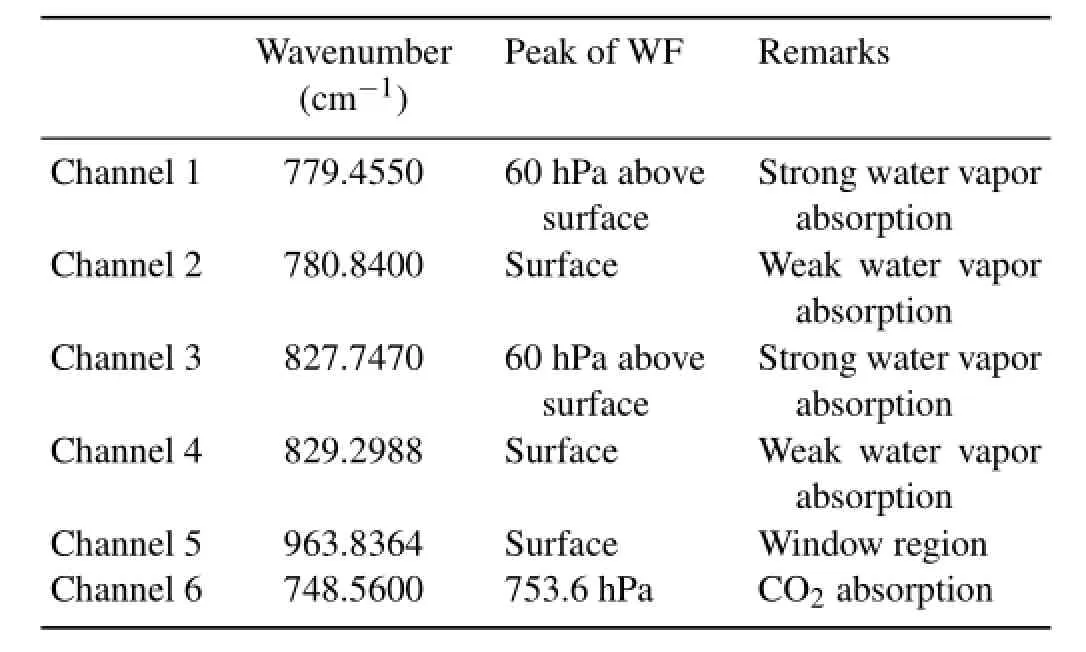
Table 2.Information on the AIRS channels selected for estimating the discrete intervals.WF means weighting function.
To set up a look-up table,more than 560 000 ECMWF six-hourly profiles over the ocean between 50◦S and 50◦N in 2005 January are fed into MODTRAN5 to generate synthetic AIRS spectra.Then,the look-up table can be constructed according to the radiances of the four water vapor absorption channels 1-4,the brightness temperature of channel 5, and the corresponding PW value.Figure 2 shows the lookup table at nadir-view.The smaller PW values of less than 2 cm in“cooler”colors is the most complicated part,mainly due to the weaker sensitivity of radiance to a small amount of water vapor and the existence of an inversion boundary layer.In order to validate the look-up table,about 45 000 ECMWF profiles over the ocean between 30◦S and 30◦N in January,April,July and October 2002 are randomly selected to generate synthetic AIRS spectra by MODTRAN5.Then, the brightness temperature and radiances in selected channels are applied to the look-up table to estimate the PW and consequently its sub-intervals.Compared with true PW subintervals determined by the input ECMWF profiles,the accuracy of this method is about 82%at nadir-view,as shown in Table 3.
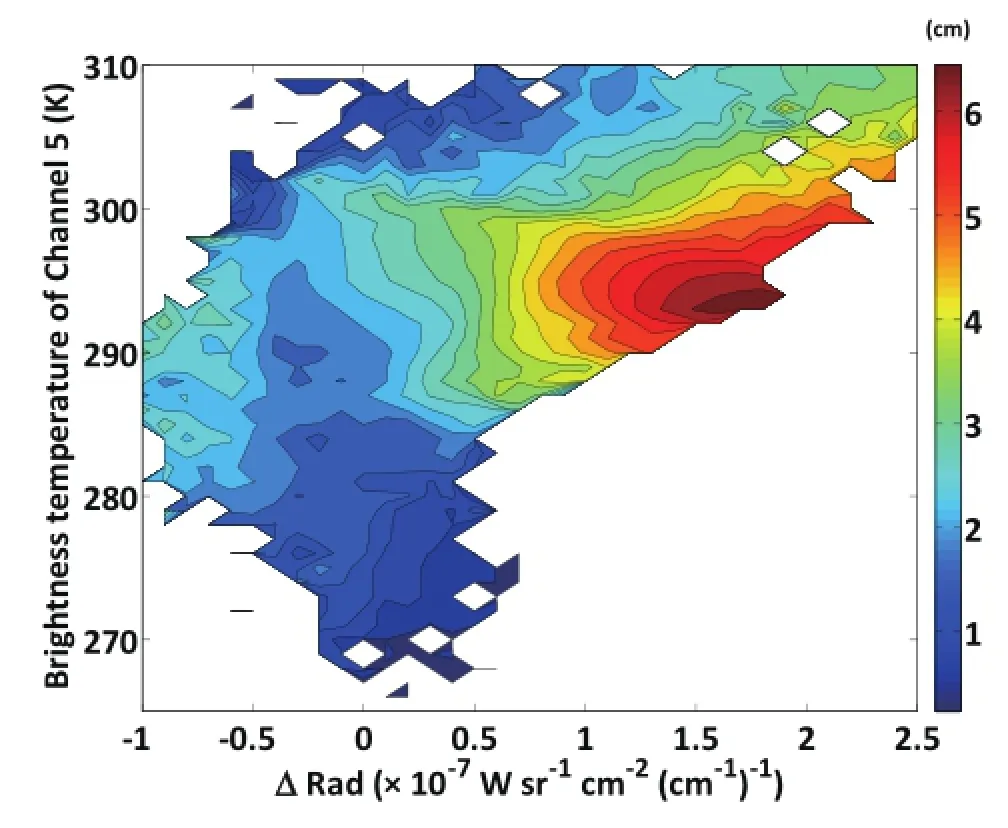
Fig.2.The look-up table derived from ECMWF data in January 2005 over the ocean between 50◦S and 50◦N,simulated by MODTRAN5 at nadir-view.The color scale shows the total PW.
3.2.Lapse rate and surface skin temperature
The ΔT used here is defined as the vertical temperature change of the first 300 hPa above the surface.Listed as channel6inTable2,aCO2absorptionchannelat748.6cm-1with the peak of weighting function around 753.6 hPa is selected to represent the temperature of 300 hPa above the surface. Together with channel 5,which represents the surface temperature,the ΔT is related with the difference between the brightness temperatures of two selected channels(hereafter, ΔTB).
In the 14 discrete intervals used in this study,there are only two ΔT sub-intervals that are<15 and 15-30 K.Given the near-linear relationship between ΔT and ΔTB,a simple threshold method is sufficient for classification.Similarly, about 91 000 ECMWF six-hourly profiles over the ocean between 30◦S and 30◦N in January 2006 are fed into MODTRAN5 to generate synthetic AIRS spectra.So,the brightness temperatures of channel 6 at 748.6 cm-1and channel 5 at 963.8 cm-1(as listed in Table 2)can be obtained and the ΔTBvalues are classified to different sub-intervals according to the corresponding ΔT value from the input ECMWF profiles.Then,for each pair of adjacent sub-intervals,the proper threshold of ΔTBthat can categorize the corresponding ΔT into the correct sub-interval is derived as ΔTB-thres.The same validation dataset as PW is applied to show the accuracy of this method.Each ΔTBbetween channel 6 at 748.6 cm-1and channel 5 at 963.8 cm-1in the validation dataset are compared with the ΔTB-thres.If ΔTBis less than ΔTB-thres, the spectra are classified to sub-intervals with ΔT<15 K. Otherwise,the spectra should be classified to sub-intervals with 15 K<ΔT<30 K.The accuracy of this simple threshold method for the lapse rate is about 91%at nadir-view,as shown in Table 3.
For Ts,the brightness temperature of the window region listed as channel 5 in Table 2(hereafter TB5)is directly used to represent Ts.As listed in Table 1,there are three Tssubintervals:270-290,290-310 and 310-330 K.Similar to the lapse rate,the simple threshold method is also applied for the estimation of Tssub-intervals due to the linear relationship between Tsand TB5.The only difference for Tsis that there are two thresholds for three sub-intervals.Using the same training and validation dataset as the lapse rate,the two thresholds of TB5are selected to categorize proper subintervals of Tsand the accuracy of the estimation of Tsis over 99%at nadir-view,as shown in Table 3.
3.3.Classification at multiple viewing zenith angles
The methods described above are all based on the dataset at nadir-view and have to be extended to multiple viewing zenith angles.Technically,similar training processes are needed at every observational angle because AIRS scans from-49◦to 49◦with an interval of 1.1◦(Aumann et al., 2003a).However,according to the definition of transmittance,the radiance at the TOA has correlations with 1/cosθ. To simplify the problem,the linear fitting along 1/cosθis sufficient for our case.Similar with the training process atnadir-view,ECMWF six-hourly profiles over the ocean between 30◦S and 30◦N in January 2006 are fed into MODTRAN5 to generate synthetic AIRS spectra at 15◦,30◦and 45◦.Together with the dataset at 0◦,four groups of the radiances and brightness temperatures in the selected channels in Table 2 are derived.

Table 3.The estimation accuracy(%)of sub-intervals of precipitable water(PW),lapse rate(ΔT),and surface skin temperature(Ts)at different viewing zenith angles.
For Ts,thereis noobviouszenithangle dependencedue to the transparent feature of the window channel.So,the same thresholds of TB5as in section 3.2 are chosen at differentθ. For the lapse rate,if we assume that the thresholds are changing monotonically along 1/cosθ,the thresholds at all angles can be derived by linear fitting.We obtain the thresholds by training the dataset of ΔT and corresponding ΔTBat 15◦,30◦and 45◦,respectively.Together with the thresholds at 0◦,the coefficients for each threshold at different angles are ready by linear fitting of four points along 1/cosθ.Then,the thresholds at all zenith angles from 0◦to 45◦are derived.
Forthelook-uptableofPW,therelationshipisnotexactly the same in each PW interval.In fact,only ΔRad is changing withθ,while the brightness temperature of the window channel has no obvious zenith angle dependence due to its transparent feature.So,if the ΔRad at different zenith angle can be converted to an equivalent range at 0◦,the look-up table at 0◦can then be easily applied to estimate the PW and to determine the corresponding sub-intervals.According to the training dataset of PW and ΔRad at 0◦,15◦,30◦and 45◦,PW data are first grouped as<1 cm,1-5 cm per 0.2 cm,and>5 cm.Then,the corresponding ΔRad values are classified into different groups.For each pair of adjacent groups,a threshold of ΔRad that can categorize the corresponding PW into a proper group is derived at four zenith angles,respectively. Hence,there are 22 thresholds for each zenith angle.This is similar to the simple threshold method described in section 3.2.Again,linear fitting between thresholds and 1/cosθof four points'data(four zenith angles)for each pair of adjacent groups are carried out to obtain the coefficients.Then, the dataset of thresholds for all zenith angles is derived.In other words,the linear fitting process for the lapse rate,described above,is repeated 22 times to set up a whole threshold database for different PW values at different zenith angles.According to this threshold database,a given ΔRad at θcan be properly mapped to the equivalent group at nadirview.Then,the PW sub-intervals can be derived according to the look-up table shown in Fig.2.
Similarly,ECMWF profiles at differentθover tropical oceansinJanuary,April,JulyandOctober2002arerandomly selected to validate the accuracy of this classification method at multiple angles.The results are listed in Table 3.Compared to the results at nadir-view,the accuracy of the estimation varies little along zenith angle.
3.4.Spectrally dependent ADMs and spectral fluxes
AIRS has no coverage at frequencies lower than 649.6 cm-1or between 1613.9 and 2000 cm-1.There are also some gaps between 649.6 and 1613.9 cm-1.Since we want to derive spectral fluxes based only on AIRS radiances observations over the whole IR region,the spectral flux in each AIRS channel and AIRS gaps should both be handled.
For each of the AIRS channels,more than 80 000 randomly selected ECMWF profiles over the ocean between 30◦S and 30◦N in January,April,July and October 2002 are selected and the anisotropic factors for zenith angles from 0◦to 45◦of each AIRS channels is obtained by feeding these profiles into MODTRAN5.The anisotropic factors and associated profiles are categorized into discrete intervals of PW, ΔT and Ts,as listed in Table 1.In the same discrete interval, the mean anisotropic factor is defined by the mean value from all samples.Then,the spectral fluxes in AIRS channels can be derived according to the spectrally dependent ADMs.
To estimate spectral fluxes in the frequency gaps of AIRS instruments,the same scheme as in Huang et al.(2008,2010) is authorized to apply here;see Huang et al.(2008,section 3.2)for more detail.Based on principal component analysis,the unknown information in the channels not covered by AIRS can be estimated by the nearest channels with similar spectral resolutions.By training ECMWF profiles,spectral fluxes over“filled-in channels”are estimated with a multiregression scheme,which essentially finds the least-squares fit of the projections of spectral fluxes in AIRS channels onto the predefined principal components.This kind of solution has been used in other estimations of missing information (e.g.,Mann et al.,1998).
4.Validation
As listed in Table 1,the PW sub-intervals described in section 3.1 are slightly different to those used in CERES ADMs.First,in section 4.1,the effect of the adjustment is evaluated.Validation of the whole algorithm includes theoretical validation and observational comparison.In section 4.2,synthetic AIRS spectra are combined with the radiancebased classification of discrete intervals to derive the spectral fluxes.Comparing between such spectral fluxes and those directly computed from MODTRAN5 can help eval-uate the whole algorithm theoretically because the differences are only from this algorithm,while MODTRAN5 is used as a surrogate of radiative transfer in the real world. Comparison between the broadband OLR derived from the AIRS observations by this algorithm and those of collocated CERES measurements is described in section 4.3.This comparison includes more realistic uncertainties,such as those in spectroscopy,forward modeling and collocation strategies,to show the reliability of the whole algorithm for real observations.
4.1.Evaluation of the adjustment of precipitable water sub-intervals
To improve the accuracy of the PW look-up table method, the PW sub-intervals are adjusted to<1,1-2,2-5 and>5, while those in the CERES ADMs are<1,1-3,3-5 and>5. Statistical analysis of the ECMWF profiles in January 2006 over the ocean between 30◦S and 30◦N shows that the distribution patterns of sample number in all 14 discrete intervals are similar before and after adjustment,although the samples in discrete intervals 11 and 12 increase while those in discrete intervals 1-10 decrease.
To evaluate the effect on the predicted fluxes caused by this adjustment,we randomly choose the ECMWF profiles in January 2005 and January 2006 in conjunction with MODTRAN5 to derive synthetic AIRS spectra.Then,predicted OLR and spectra from 10 to 2000 cm-1can be generated by the spectral ADMs to compare with the directly computed OLR and spectra fluxes.In this validation,the discrete intervals are classified according to the true values of PW,Tsand ΔT from ECMWF profiles instead of the radiance-based methods described in sections 3.1 and 3.2.So,the error caused by the estimated method is excluded and the differences between the predicted and directly computed results in each discrete interval are only due to the adjustment of PW sub-intervals.The validation results show that the mean relative differences are within±0.5%and the standard deviations are no more than 1%.The statistical results show that the bias caused by PW subinterval adjustment is acceptable in most discrete intervals.
4.2.Theoretical validation
ECMWF profiles over the ocean between 30◦S and 30◦N in April and October 2006 are randomly selected and fed into MODTRAN5.The appropriate discrete intervals are classified by the radiance-based method instead of the true value. Then,synthetic AIRS spectra and longwave spectral fluxes are derived,as described in section 3.4.Taking nadir-view as an example,the differences between the spectral fluxes and the broadband OLR predicted from the synthetic AIRS spectra and the one directly computed from MODTRAN5 are examined.Figure 3 shows the differences of broadband OLR at 14 discrete intervals at nadir-view.Discrete intervals 3,7 and 9 are not included due to the fact that there are not enough samples to give statistical results.For other discrete intervals,the mean OLR differences are between 0 and-2.2 W m-2(a fraction of about 0.7%),with standard deviations of no more than 1.3 W m-2.The maximum differences from individual discrete intervals are within±3 W m-2.The OLR differences for other viewing zenith angles are similar to that shown in Fig.3.
The differences between the predicted and directly computed spectral fluxes are also examined and the results at nadir-view are shown in Fig.4 as an example.For each discrete interval,the mean differences of spectral fluxes averaged for every 10 cm-1from 10 to 2000 cm-1are calculated at nadir-view.For the discrete intervals with sufficient samples,about 95%of all samples have a mean difference within ±0.03 W(m2×10cm-1)-1and more than 98%of them have a mean difference within±0.05 W(m2×10 cm-1)-1.Proportionally,more than 99%of all samples have a mean relativedifferencelessthan±5%,whileabout96%ofallsamples have a mean relative difference less than±3%.Although the distribution of samples is not well-proportioned in all discrete intervals due to the adjustments for PW sub-intervals,the comparisons still show good agreement for most situations. This indicates that,at least for theoretical comparisons,the algorithm is capable of obtaining spectral fluxes at 10 cm-1intervals with sufficient confidence.
4.3.Comparison with collocated CERES observations
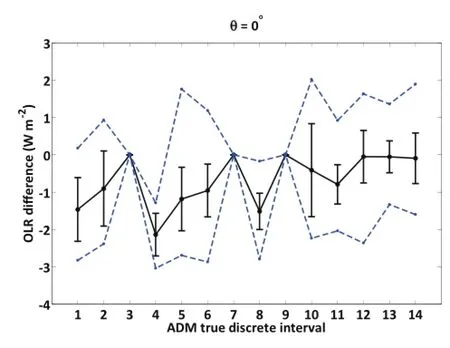
Fig.3.The mean differences between the broadband OLR predicted from the synthetic AIRS spectra at nadir-view and directly computed OLR from MODTRAN5 for 14 discrete intervals classified by the solely radiance-based method.The input data are randomly chosen from ECMWF profiles over tropical oceans in April and October 2006.The dots show the mean differences,the error bars show the mean±standard deviation, and the circles show the maximum and minimum relative differences for each discrete interval.
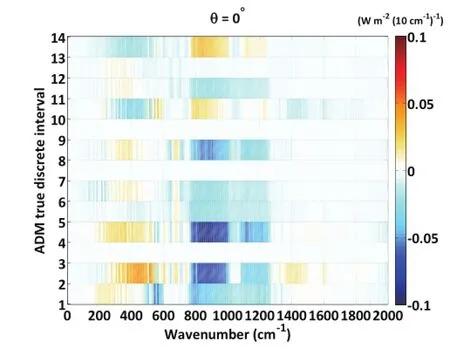
Fig.4.The mean differences between the predicted TOA spectralfluxesbasedonsyntheticAIRSspectraatnadir-viewandthe directly computed TOA spectral fluxes from MODTRAN5 for each ADM discrete interval.The spectral flux is computed for every 10 cm-1interval from 10 to 2000 cm-1.The units of the mean differences are W(m2×10 cm-1)-1.The ordinate represents the 14 discrete intervals that are classified by the true input PW value.The input data are randomly chosen from ECMWF profiles over tropical oceans in April and October 2006.
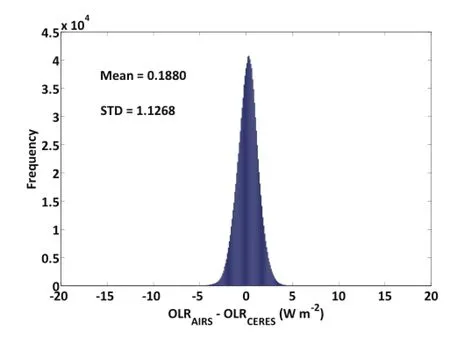
Fig.5.Histogram of differences between AIRS-derived OLR and CERES OLR for all collocated AIRS and CERES clear-sky footprints over tropical oceans in 2004.
To evaluate the performance of the algorithm for real observations,broadband OLRs derived by this algorithm from AIRS spectra(OLRAIRS)are compared with collocated CERES OLR measurements(OLRCERES).Clear-sky observations in 2004 over tropical oceans(30◦S-30◦N)are used and the collocated strategy is very similar with that used in Huang et al.(2008).An AIRS observation and a CERES measurement are considered as collocated only when(1)the time interval between two observations is within 6 s and(2) the distance between the center of an AIRS footprint and that of a CERES footprint on the surface is less than 3 km.Under these collocated criteria,about 1.061 million collocated clear-sky observations over tropical oceans in 2004 are selected.The clear-sky or cloudy scenes are determined from relative CERES products.Figure 5 shows a histogram of the differences between OLRAIRSand OLRCERESfor all samples in 2004.The histogram approximates the Gaussian distribution and the mean differences are 0.19 W m-2with a standard deviation of 1.23 W m-2.
Given that the CERES ADMs use a pair of slightly different anisotropic factors for daytime scenes and nighttime scenes,we further examine the comparison results in two groups:one in the ascending node and the other in the descending node.Figures 6a and b show the monthly mean OLR differences in 2004 of ascending and descending nodes, respectively.There is only a small fluctuation of OLR differences among different months due to the limitation of the training dataset for PW,Tsand ΔT estimation,especially for the ascending node.The mean OLR differences are within ±0.36 W m-2,while the standard deviations are no more than 1.18 W m-2for both nodes.The mean OLR differences for different discrete intervals are also examined and the results are shown in Fig.7.The pattern is similar for both nodes and there is obvious variation among different discrete intervals.As mentioned above,the samples are not equally distributed in different discrete intervals during both the training and validation process.For this OLR comparison in 2004, the discrete intervals of 3,4 and 7 have few samples,while the last four discrete intervals,11-14,have more than 98%of all samples.For most discrete intervals except 1,3 and 7,the mean OLR differences are within±2 W m-2,which is less than 1%of typical mean clear-sky OLR over tropical oceans.
In brief,the results of both the theoretical validation and the AIRS-CERES comparisons show consistent performance in most situations,except some discrete intervals with limited samples.This indicates confidence of the algorithm in obtaining broadband OLR and spectral fluxes at 10 cm-1or even larger spectral intervals.
5.Summary and discussion
In order to obtain spectral fluxes in the thermal-IR band, AIRS spectra are employed as an example to explore the possibility of developing an algorithm for clear skies over tropical oceans,based only on radiance measurements.The radiances and brightness temperatures in selected AIRS channels are applied to estimate PW,Tsand ΔT and determine the proper discrete intervals needed for the spectral ADMs. Then,the spectral fluxes and broadband OLRs can be converted from AIRS radiances by a spectrally dependent ADM. The solely radiance-based algorithm is validated against synthetic spectral fluxes as well as collocated CERES OLR observations,and show good consistency in most situations. This algorithm can be easily extended to other similar hyperspectral radiance measurements.
To make the solely radiance-based algorithm completely applicable in practical observations,the classification of clear-sky and cloudy scenes based only on radiance is an essential precondition.However,it is still a challenging task to achieve precisely.The tri-spectrum method(Ackerman et al.,1990),which uses brightness temperatures of 8,11 and 12µm to distinguish clear-sky,water cloud and ice cloud is no longer effective due to the gap in AIRS radiances between 8.1 and 9µm.Given that most transparent channels in the thermal-IR band are at 1231 cm-1,suggested by Aumannet al.(2003b,2006),we also check the differences between the brightness temperatures of 1231 cm-1(TB1231)and corresponding SST(TOI)from the NOAA's Optimum Interpolation(OI)SST V2 weekly mean products(Reynolds et al., 2002).NOAA-OI-SST analysis has been produced weekly on a 1◦×1◦global grid from 1981 October to the present day.One month's AIRS measurements in January 2008 are used to compute Threshold1231,which is defined as
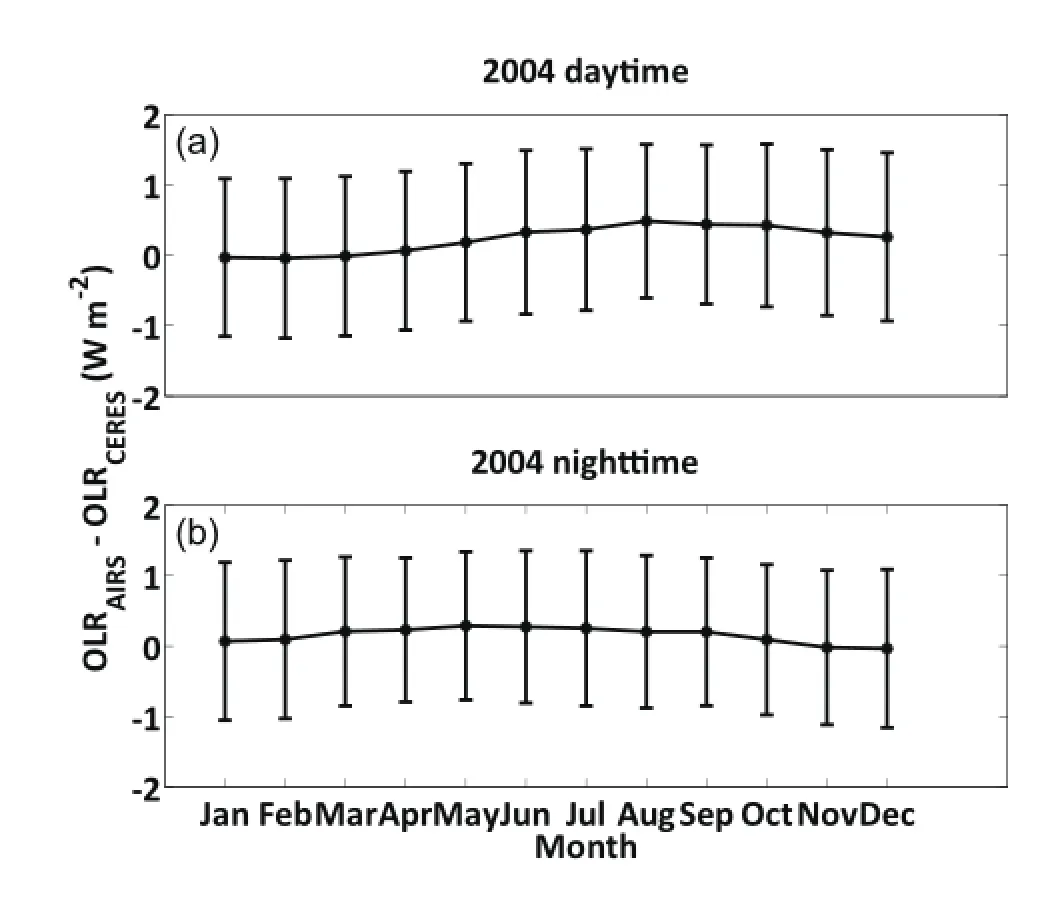
Fig.6.(a)The monthly mean differences between the clear-sky OLR in 2004 over the tropical oceans estimated from AIRS spectra measured during daytime and that from the collocated CERES measurements.The dots show the mean differences and the error bars are±standard deviation.(b)As in(a)but for nighttime.
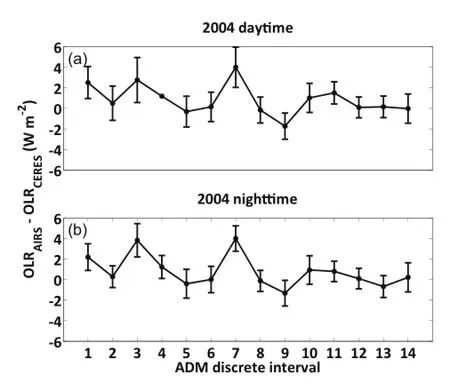
Fig.7.(a)The mean differences in each discrete interval between the clear-sky OLR in 2004 over the tropical oceans estimated from AIRS spectra measured during daytime and that from the collocated CERES measurements.The dots show the mean differences and the error bars are±standard deviation. (b)As in(a)but for nighttime.

According to the collocated CERES scenes,there are 4646 clear-sky samples and 51 828 cloudy samples in this month. For example,Threshold1231is set as 3.6 K,then samples with Threshold1231over 3.6 K are clear-sky scenes and others are cloudy scenes.The accuracy of this method is 70.66%for CERES clear scenes and 89.16%for CERES cloudy scenes. For the CERES cloudy scenes misclassified as clear,75%of misclassified samples are lower than 850 hPa,while 90%of them have a fraction less than 20%.A stricter Threshold1231can improve the accuracy of clear-sky estimation,but it also largely excludes actual clear-sky samples,which cannot be determined exactly.It is still under investigation as to how to eliminate this kind of low and broken cloud based on radiances only.
For the solely radiance-based algorithm itself,uncertainties in the derived spectral fluxes could originate from various sources.Due to the complexity of water vapor continuum absorption,the accuracy of the double-differential approach can still be improved.Chen and Huang(2014)developed a similar differential absorption method to improve the estimation of the clear-sky column water vapor,although different pairs of water absorption channels were applied and the contribution of the lapse rate was also considered.The adjustments of PW sub-intervals and the finite training dataset cause the non-uniform distribution among different discrete intervals for scene-type classification as well as spectral ADM construction.Meanwhile,errors in spectral fluxes over the entire thermal-IR spectral range exist in the multivariate regression schemes and also in forward radiative transfer modeling,especially in the far IR band,which is not covered by the AIRS instrument.Furthermore,as a first step for deriving TOA spectral fluxes for all skies based solely on radiance,more effort is needed to develop a similar algorithm for cloudy scenes.
Acknowledgements.This research was supported by the National Natural Science Foundation of China(Grant No.41105015). The ERA-Interim data used in this study were obtained from http:// data.ecmwf.int/data/.The NOAA-OI-SST data were obtained from http://www.esrl.noaa.gov/psd/data/gridded/data.noaa.oisst.v2.html. We are greatly indebted to Prof.Xianglei HUANG for guidance regarding the algorithm,resources for the simulations,and valuable discussions.We also thank the anonymous reviewers and editors for their very thorough and constructive comments.
REFERENCES
Ackerman,S.A.,W.L.Smith,H.E.Revercomb,and J.D.Spinhirne,1990:The 27-28 October 1986 FIRE IFO cirrus case study:Spectral properties of cirrus clouds in the 8-12µm window.Mon.Wea.Rev.,118,2377-2388.
Allan,R.P.,M.A.Ringer,J.A.Pamment,and A.Slingo,2004: Simulation of the Earth's radiation budget by the European Centre for Medium-Range Weather Forecasts 40-year reanalysis(ERA40).J.Geophys.Res.,109,D18107.
Anderson,G.,and Coauthors,2006:Atmospheric sensitivity to spectral top-of-atmosphere solar irradiance perturbations,using MODTRAN-5 radiative transfer algorithm.AGU Fall Meeting,Abstract A11C-05,San Francisco,CA,American Geophysical Union.
Aumann,H.H.,and Coauthors,2003a:AIRS/AMSU/HSB on the aqua mission:Design,science objectives,data products, and processing systems.IEEE Trans.Geosci.Remote Sens., 41(2),253-264,doi:10.1109/TGRS.2002.808356.
Aumann,H.H.,M.T.Chahine,and D.Barron,2003b:Sea surface temperature measurements with AIRS:RTG.SST comparison.Proc.SPIE 5151,Earth Observing Systems VIII,252 (November 13,2003),doi:10.1117/12.506385.
Aumann,H.H.,S.Broberg,D.Elliott,S.Gaiser,andD.Gregorich, 2006:Three years of Atmospheric Infrared Sounder radiometric calibration validation using sea surface temperatures. J.Geophys.Res.,111,D16S90.
Beer,R.,T.A.Glavich,and D.M.Rider,2001:Tropospheric emission spectrometer for the Earth Observing System's Aura satellite.Appl.Opt.,40(15),2356-2367.
Berk,A.,and Coauthors,2005:MODTRAN5:A reformulated atmospheric band model with auxiliary species and practical multiple scattering options.Proc.SPIE 5655,Multispectral and Hyperspectral Remote Sensing Instruments and Applications II,88(January 20,2005),doi:10.1117/12.578758.
Bingham,G.A.,N.S.Pougatchev,M.P.Esplin,W.J.Blackwell, and C.D.Barnet,2010:The NPOESS cross-track infrared sounder(CrIS)and advanced technology microwave sounder (ATMS)as a companion to the new generation AIRS/AMSU andIASI/AMSUsoundersuites.Proc.6thAnnualSymposium on Future National Operational Environmental Satellite Systems,Atlanta,GA,American Meteorological Society.
Chahine,M.T.,and Coauthors,2006:AIRS:Improving weather forecastingandprovidingnewdataongreenhousegases.Bull. Amer.Meteor.Soc.,87(7),911-926,doi:10.1175/BAMS-87-7-911.
Chen,X.H.,and X.L.Huang,2014:Usage of differential absorption method in the thermal IR:A case study of quick estimateofclear-skycolumnwatervapor.JournalofQuantitative Spectroscopy and Radiative Transfer,140,99-106.
Clerbaux,C.,and Coauthors,2009:Monitoring of atmospheric composition using the thermal infrared IASI/MetOp sounder. Atmos.Chem.Phys.,9,6041-6054.
Clough,S.A.,and M.J.Iacono,1995:Line-by-line calculation of atmosphericfluxesandcoolingrates:2.Applicationtocarbon dioxide,ozone,methane,nitrous oxide and the halocarbons. J.Geophys.Res.,100(D8),16 519-16 535.
Clough,S.A.,M.W.Shephard,E.J.Mlawer,J.S.Delamere,M. J.Iacono,K.Cady-Pereira,S.Boukabara,and P.D.Brown, 2005:Atmospheric radiative transfer modeling:A summary of the AER codes.Journal of Quantitative Spectroscopy and Radiative Transfer,91,233-244.
Frouin,R.,and E.Middleton,1990:A differential absorption technique to estimate atmospheric total water vapor amounts. American Meteorological Society Symposium on the First ISLSCP Field Experiment(FIFE),Anaheim,California,first ISLSCP Field Experiment,135-139.
Goody,R.,J.Anderson,and G.North,1998:Testing climate models:An approach.Bull.Amer.Meteor.Soc.,79,2541-2549.
Green,R.N.,and P.O.R.Hinton,1996:Estimation of angular distribution models from radiance pairs.J.Geophys.Res., 101(D12),16 951-16 959.
Huang,X.L.,andY.L.Yung,2005:Spatialandspectralvariability of the outgoing thermal IR spectra from AIRS:A case study of July 2003.J.Geophys.Res.,110,D12102.
Huang,X.L.,V.Ramaswamy,and M.D.Schwarzkopf,2006: Quantification of the source of errors in AM2 simulated tropical clear-sky outgoing longwave radiation.J.Geophys.Res., 111,D14107.
Huang,X.L.,W.Z.Yang,N.G.Loeb,and V.Ramaswamy,2008: Spectrally resolved fluxes derived from collocated AIRS and CERES measurements and their application in model evaluation:Clear sky over the tropical oceans.J.Geophys.Res., 113,D09110.
Huang,X.L.,N.G.Loeb,and W.Z.Yang,2010:Spectrally resolved fluxes derived from collocated AIRS and CERES measurements and their application in model evaluation:2. Cloudy sky and band-by-band cloud radiative forcing over the tropical oceans.J.Geophys.Res.,115,D21101.
Huang,Y.,V.Ramaswamy,X.L.Huang,Q.Fu,and C.Bardeen, 2007:A strict test in climate modeling with spectrally resolved radiances:GCM simulation versus AIRS observations.Geophys.Res.Lett.,34,L24707.
Komhyr,W.D.,R.D.Grass,R.K.Leonard,1989:Dobson spectrophotometer 83:A standard for total ozone measurements, 1962-1987.J.Geophys.Res.,94,9847-9861.
Le Marshall,J.,and Coauthors,2006:Improving global analysis and forecasting with AIRS.Bull.Amer.Meteor.Soc.,87(7), 891-894.
Loeb,N.G.,P.O.R.Hinton,and R.N.Green,1999:Top-ofatmosphere albedo estimation from angular distribution models:A comparison between two approaches.J.Geophys.Res., 104(D24),31 255-31 260.
Loeb,N.G.,F.Parol,J.-C.Buriez,andC.Vanbauce,2000:Top-ofatmosphere albedo estimation from angular distribution models using scene identification from satellite cloud property retrievals.J.Climate,13,1269-1285.
Loeb,N.G.,N.Manalo-Smith,S.Kato,W.F.Miller,S.K.Gupta, P.Minnis,and B.A.Wielicki,2003:Angular distribution models for top-of-atmosphere radiative flux estimation from the clouds and the Earth's Radiant Energy System instrument on the Tropical Rainfall Measuring Mission satellite.Part I: Methodology.J.Appl.Meteor.,42,240-265.
Loeb,N.G.,S.Kato,K.Loukachine,and N.Manalo-Smith,2005: Angular distribution models for top-of-atmosphere radiative flux estimation from the Clouds and the Earth's Radiant Energy System instrument on the Terra satellite.Part I:Methodology.J.Atmos.Oceanic Technol.,22,338-351.
Loeb,N.G.,S.Kato,K.Loukachine,N.Manalo-Smith,and D. R.Doelling,2007:Angular distribution models for top-ofatmosphere radiative flux estimation from the Clouds and the Earth's Radiant Energy System instrument on the Terra satellite.Part II:Validation.J.Atmos.Oceanic Technol.,24,564-584.
Mann,M.E.,R.S.Bradley,and M.K.Hughes,1998:Globalscale temperature patterns and climate forcing over the past six centuries.Nature,392,779-787,doi:10.1038/33859.
Ramanathan,V.,R.D.Cess,E.F.Harrison,P.Minnis,B.R.Barkstrom,E.Ahmad,and D.Hartmann,1989:Cloud-radiative forcing and climate:Results from the Earth Radiation Budget Experiment.Science,243,57-63.
Reynolds,R.W.,N.A.Rayner,T.M.Smith,D.C.Stokes,and W.Q.Wang,2002:An improved in situ and satellite SST analysis for climate.J.Climate,15,1609-1625.
Smith,G.L.,R.N.Green,E.Raschke,L.M.Avis,J.T.Suttles, B.A.Wielicki,and R.Davies,1986:Inversion methods for satellite studies of the Earth's radiation budget:Development of algorithms for the ERBE mission.Rev.Geophys.,24(2), 407-421.
Strow,L.L.,S.E.Hannon,M.Weiler,K.Overoye,S.L.Gaiser, and H.H.Aumann,2003:Prelaunch spectral calibration of the Atmospheric Infrared Sounder(AIRS).IEEE Trans. Geosci.Remote Sens.,41(2),274-286.
Strow,L.L.,S.E.Hannon,S.De-Sousa Machado,H.E.Motteler, and D.C.Tobin,2006:Validation of the atmospheric infrared sounder radiative transfer algorithm.J.Geophys.Res.,111, D09S06,doi:10.1029/2005JD006146.
Susskind,J.,C.D.Barnet,and J.M.Blaisdell,2003:Retrieval of atmospheric and surface parameters from AIRS/AMSU/HSB data in the presence of clouds.IEEE Trans.Geosci.Remote Sens.,41(2),390-409.
Suttles,J.T.,B.A.Wielicki,and S.Vemury,1992:Top-ofatmosphere radiative fluxes:Validation of ERBE scanner inversion algorithm using Nimbus-7 ERB data.J.Appl.Meteor., 31,784-796.
Wielicki,B.A.,and R.N.Green,1989:Cloud identification for ERBE radiation flux retrieval.J.Appl.Meteor.,28,1133-1146.
Wielicki,B.A.,and Coauthors,2002:Evidence for large decadal variability in the tropical mean radiative energy budget.Science,295,841-844.
Wu,X.B.,J.Li,W.J.Zhang,and F.Wang,2005:Atmospheric profile retrieval with AIRS data and validation at the ARM CART site.Adv.Atmos.Sci.,22(5),647-654,doi:10.1007/ BF02918708.
Zheng,J.,J.Li,T.J.Schmit,J.L.Li,and Z.Q.Liu,2015:The impact of AIRS atmospheric temperature and moisture profiles on hurricane forecasts:Ike and Irene.Adv.Atmos.Sci.,32(3), 319-335,doi:10.1007/s00376-014-3162-z.
Song,L.,and Y.N.Wang,2016:A solely radiance-based spectral angular distribution model and its application in deriving clear-sky spectral fluxes over tropical oceans.Adv.Atmos.Sci.,33(2),259-268,
10.1007/s00376-015-5040-8.
18 March 2015;revised 5 August 2015;accepted 17 August 2015)
∗Lei SONG
Email:songl@mail.iap.ac.cn
杂志排行
Advances in Atmospheric Sciences的其它文章
- The Impact of Cut-off Lows on Ozone in the Upper Troposphere and Lower Stratosphere over Changchun from Ozonesonde Observations
- Influence of Soil Moisture in Eastern China on the East Asian Summer Monsoon
- Trends of Regional Precipitation and Their Control Mechanisms during 1979-2013
- Temporal Statistical Downscaling of Precipitation and Temperature Forecasts Using a Stochastic Weather Generator
- A Microscale Model for Air Pollutant Dispersion Simulation in Urban Areas: Presentation of the Model and Performance over a Single Building
- Implementation of a One-Dimensional Enthalpy Sea-Ice Model in a Simple Pycnocline Prediction Model for Sea-Ice Data Assimilation Studies
