Response of fne particulate matter to reductions in anthropogenic emissions in Beijing during the 2014 Asia-Pacifc Economic Cooperation summit
2016-11-23GUYiXuanandLIAOHong
GU Yi-Xuanand LIAO Hong
aState Key Laboratory of Atmospheric Boundary Layer Physics and Atmospheric Chemistry, Institute of Atmospheric Physics, Chinese Academy of Sciences, Beijing, China;bCollege of Earth Science, University of Chinese Academy of Sciences, Beijing, China;cSchool of Environmental Science and Engineering, Nanjing University of Information Science & Technology, Nanjing, China
Response of fne particulate matter to reductions in anthropogenic emissions in Beijing during the 2014 Asia-Pacifc Economic Cooperation summit
GU Yi-Xuana,band LIAO Hongc
aState Key Laboratory of Atmospheric Boundary Layer Physics and Atmospheric Chemistry, Institute of Atmospheric Physics, Chinese Academy of Sciences, Beijing, China;bCollege of Earth Science, University of Chinese Academy of Sciences, Beijing, China;cSchool of Environmental Science and Engineering, Nanjing University of Information Science & Technology, Nanjing, China
The nested-grid capability of the global chemical transport model GEOS-Chem, with a horizontal resolution of 1/4° × 5/16° (latitude × longitude), was used to identify the chemical species whose reductions made the largest contributions to decreases in PM2.5concentrations (fne particulate matter; diameter ≤ 2.5 μm; defned in this study as the sum of sulfate, nitrate, ammonium, black carbon, and organic carbon aerosols) in Beijing during the 2014 Asia—Pacifc Economic Cooperation(APEC) summit. A number of numerical experiments were carried out for the period 15 October—29 November 2014. The model reproduced the observed daily variations of concentrations of PM2.5and gas-phase species (carbon monoxide, nitrogen dioxide, and sulfur dioxide). Simulated PM2.5concentrations decreased by 55.9%—58.5% during the APEC period, compared to other periods in October and November 2014, which agreed closely with measurements. Sensitivity results showed that emissions control measures regarding nitrogen oxides and organic carbon over North China led to the largest reductions in PM2.5concentrations in Beijing during the APEC summit, which led to overall reductions in the PM2.5concentration of Beijing by 5.7% and 4.6%, respectively. The control of ammonia emissions was found to be able to greatly reduce PM2.5concentrations in the whole of North China during the APEC meeting.
ARTICLE HISTORY
Revised 30 May 2016
Accepted 2 June 2016
Fine particulate matter;emissions reduction;Asia—Pacifc Economic Cooperation; Beijing; GEOSChem
研究使用全球大气化学传输模式GEOS-Chem高分辨率(1/4° × 5/16°)区域嵌套版本评估2014年亚洲-太平洋经济合作峰会(APEC)期间不同地区不同污染物减排对北京地区PM2.5(粒径小于2.5 μm的气溶胶颗粒,本文中定义为硫酸盐、硝酸银、铵盐、一次有机碳和黑碳气溶胶浓度之和)浓度降低的不同影响。在2014年10月15日至11月29日期间,模拟结果表明:模式可以重现观测结果中PM2.5及主要气态污染物(一氧化碳、二氧化氮和二氧化硫)浓度的日变化趋势。在APEC期间,模拟PM2.5浓度相比会议前期和会议后期下降55.9%—58.5%,与观测结果具有较好的一致性。敏感性实验结果表明:APEC期间华北地区氮氧化物和一次有机碳的减排对于北京地区PM2.5浓度的降低影响最为显著,相应减排措施致使北京地区PM2.5浓度分别下降5.7%和4.6%。同时,对氨气排放的控制可以有效地降低整个华北地区在APEC期间的PM2.5浓度。
1. Introduction
High PM2.5concentrations (fne particulate matter; diameter ≤ 2.5 μm) in China have garnered considerable attention because of their role in the deterioration of air quality and harm to human health (Pui, Chen, and Zuo 2014). Observed wintertime PM2.5concentrations can exceed 500 μg m-3on heavily polluted days in Beijing (Wang et al. 2014), which makes it essential to reduce emissions to improve air quality in North China. Emissions reduction measures have proved to be efective in improving air quality in Beijing and its surrounding regions (Wang et al. 2009; Gao et al. 2011). During the 22nd Asia—Pacifc Economic Cooperation (APEC) summit, which was hosted in Beijing (5—11 November 2014), tough emissions reduction measures were implemented for the city and its surrounding provinces. The measures resulted in reductions in emissions of sulfur dioxide (SO2), nitrogen oxides (NOx),PM10, PM2.5, and non-methane volatile organic compounds(NMVOCs) by 39.2%, 49.6%, 66.6%, 61.6%, and 33.6%,respectively, according to the air quality evaluation reportof the APEC period released by the Chinese Environmental Protection Administration (CNEPA) (http://www.mep.gov. cn/zhxx/hjyw/201412/t20141218_293140.htm). The summit provided an experimental opportunity to study the impact of emissions reduction measures on the air quality in Beijing and surrounding provinces.
Modeling studies of PM2.5sensitivities to the emissions control measures during the APEC period have been reported in the literature (Liu et al. 2015; Zhai et al. 2016). For example, by using the Nested Air Quality Prediction Model System, Liu et al. (2015) showed that the PM2.5concentrations in Beijing would have increased by 15—30 μg m-3(40%—60%) if no emissions control measures were conducted during the APEC period. Although previous studies provide valuable knowledge regarding the efectiveness of the emissions reduction measures over North China, there is still room for further studies. PM2.5has been proved to change nonlinearly in response to its precursors (Ansari and Pandis 1998; West, Ansari,and Pandis 1999; Holt, Selin, and Solomon 2015), and the control of diferent precursor emissions in diferent regions may result in diferent efciencies in reducing PM2.5concentrations. For example, NOxemissions are generally considered to be important for nitrate formation, but nitrate concentrations could be more sensitive to ammonia (NH3) emissions under NH3-poor conditions when NH3is insufcient to neutralize nitric acid (Wang et al. 2011). Therefore, it is important to quantify the sensitivities of PM2.5to the changes in emissions of diferent species in diferent regions over North China.
The goal of this work was to identify the chemical species whose reductions made the largest contributions to the decreases in PM2.5concentrations during the APEC period in Beijing. The observational data, GEOSChem model, and numerical experiments are described in Section 2. Section 3 presents the model evaluation, as well as the results from sensitivity simulations. Section 4 summarizes the major conclusions of this study.
2. Data and methods
2.1. GEOS-Chem model
We simulated aerosol concentrations using a nested-grid capability of the global chemical transport model GEOSChem (version 9-02; http://geos-chem.org) driven by the GEOS-FP assimilated meteorological felds from the Goddard Earth Observing System of the NASA Global Modeling and Assimilation Ofce. The model has a horizontal resolution of 1/4° × 5/16° (latitude × longitude) for the East Asia domain (15—55°N, 70—140°E) and 47 vertical layers extending from the surface to 0.01 hPa. The chemical boundary conditions were provided by a global GEOSChem simulation at 4° × 5° (latitude × longitude) horizontal resolution and updated in the nested-grid region every 3 h(Chen et al. 2009; Kim et al. 2015).
GEOS-Chem has a fully coupled treatment of tropospheric NOx—carbon monoxide (CO)—hydrocarbon-ozone chemistry and aerosols including sulfate, nitrite,ammonium, organic carbon (OC), black carbon (BC)(Park et al. 2003, 2004; Pye et al. 2009), mineral dust (Fairlie,Jacob, and Park 2007), and sea salt (Jaeglé et al. 2011). Convective transport in GEOS-Chem mimics that in the parent GEOS general circulation model (Hack 1994; Zhang and McFarlane 1995), accounting for updraft, downdraft,and entrainment mass fuxes archived separately for deep and shallow convection (Wu et al. 2007). The aerosol wet deposition scheme follows that of Liu et al. (2001). For the scavenging of aerosols,SO24-,NH+4, nitrate, and hydrophilic OC and BC, aerosols are assumed to be fully soluble. Dry deposition follows the standard resistance-in-series model of Wesely (1989).
2.2. Emissions
Global emissions of aerosols and their precursors in GEOS-Chem follow Park et al. (2003, 2004), with anthropogenic emissions in East Asia overwritten by the MIX Asian anthropogenic emissions inventory for the year 2010 (http://www.meicmodel.org/data-set-mix.html)developed by Li et al. (2015). The diurnal variation of NH3emission is applied in the model following Zhu et al. (2013). Anthropogenic emissions of SO2, NOx, CO, NH3, BC, and OC are, respectively, 28.6, 29.1, 170.9, 9.8, 1.8, and 3.4 Tg yr-1in China; and 0.15, 0.33, 1.92, 0.07, 0.02, and 0.03 Tg yr-1in Beijing. We defned three regions for the emissions control tests: the North China domain (NC, (31.5—43.0°N,110.0—123.1°E)), Beijing (BJ, (39.5—41.2°N, 115.6—117.5°E)),and the North China domain excluding Beijing (NC-B).
2.3. Numerical experiments
To identify the chemical species whose reductions in emissions made the largest contribution to the decrease in PM2.5concentrations during the APEC period in Beijing,we performed the following numerical experiments:
(1) NoCTRL: Simulation for the period 15 October—29 November 2014, with default emissions in the model.
(2) CTRL: As in NoCTRL except that, during the APEC summit (3—12 November 2014), emissions of SO2, NOx(NOx= NO + NO2), CO, BC, OC, and NMVOCs were reduced, respectively, by 39.2%,49.6%, 30.0%, 30%, 30%, and 33.6% in Beijing,and by 30% in NC-B, according to the air quality evaluation report of the APEC period released by CNEPA.
(3) CTRL_NC, CTRL_NC-B, and CTRL_BJ, for each of species of SO2, NOx, OC, and BC: As in NoCTRL except that, during the APEC summit (3—12 November 2014), the emissions control was applied in NC, NC-B, and BJ, respectively. The rates of reduction of a single species in BJ and NC-B were the same as those in (2). For example,for the case of SO2reduction, CTRL_NC, CTRL_ NC-B, and CTRL_BJ indicate that SO2emissions control was conducted in NC, NC-B, and BJ,respectively, during 3—12 November 2014, with a 39.2% reduction in SO2in Beijing and a 30% reduction in SO2in NC-B.
(4) CTRL_NC, CTRL_NC-B, and CTRL_BJ for NH3: As in NoCTRL except that, during the APEC summit(3—12 November 2014), the emissions control of NH3was carried out in NC, NC-B, and BJ, respectively. The same rate of reduction of 30% was assumed for NC, NC-B, and BJ.
We performed a two-month spin-up run to generate the initial conditions. All the simulations used the same initial and lateral boundary conditions for meteorological variables and concentrations of gas-phase species and aerosols.
2.4. Observational data
The observations used included meteorological parameters and concentrations of PM2.5, SO2, NO2, and CO. The hourly meteorological measurements were obtained from the NCDC of NOAA (http://gis.ncdc.noaa.gov/map/ viewer/#app=cdo). The measurements of meteorological felds in Beijing were carried out at the site of Beijing Capital International Airport (40.080°N, 116.585°E), with hourly data from 31 October 1945 to the present day. The ground-based observations of gases and aerosols were obtained from the China National Environmental Monitoring Center during 15 October—29 November 2014(http://106.37.208.233:20035/). There are eight monitoring sites in Beijing and, here, we averaged the hourly measurements of all sites to obtain the daily concentrations of PM2.5, SO2, NO2, and CO in Beijing, which were used to evaluate the daily model results.
3. Results
3.1. Comparisons between the GEOS-FP meteorological fields and measurements
Since PM2.5concentrations can be greatly infuenced by metrological factors (Gao et al. 2011), we compared the GEOS-FP meteorological parameters used in the model with measurements for RH, SLP, 10-m temperature, and 10-m wind speed and direction, in Beijing, during 15 October—29 November 2014 (Figure 1), as an essential part of model evaluation. Because the GEOS-FP data were available with a temporal resolution of 3 h, the hourly measurements from the NCDC were averaged over the 3 h for comparison. During the APEC period (3—12 November 2014), the wind direction changed frequently and RH was relatively low, with a mean value of 47.3%. As discussed in Liu et al. (2015), such a meteorological condition in Beijing during the APEC period was relatively conducive for the difusion of air pollutants. For all fve of the meteorological parameters shown in Figure 1, the correlation coefcients(R) between the GEOS-FP meteorological data and measurements were in the range of 0.44—0.97 (p = 0.01). At the Beijing Capital International Airport site, the normalized mean bias,

where Aiand Oiare the assimilated GEOS-FP meteorological felds and NCDC observations at time i for each parameter, respectively, was -12.7%, -0.1%, -42.0%, +48.1% and +32.0% for RH, SLP, temperature, wind speed, and wind direction, respectively, indicating that the GEOS-FP meteorological felds agreed reasonably well with observations.
3.2. Concentrations of aerosols and gas-phase species during the APEC summit
Figure 2 compares the daily concentrations from the CTRL and NoCTRL simulations with ground-based measurements in Beijing for PM2.5, CO, NO2, and SO2concentrations at Beijing during 15 October—29 November 2014. The daily concentrations of PM2.5, CO, and NO2were underestimated,and the daily concentrations of SO2were overestimated(Figure 2). There are several reasons for the model biases in Beijing. First, the characteristics of local emissions might not have been captured well by the emissions inventories. Chen et al. (2016) indicated that the emissions inventory underestimated the emissions of NOxand CO, but overestimated SO2emissions, during October 2014, based on a WRF model coupled with online chemistry (WRF-Chem)simulation. With the boundary layer heights and winds reasonably simulated, they reported that the peak concentrations of CO and NO2on polluted days were underestimated by 50%—70%. Though WRF-Chem has diferent chemical schemes to GEOS-Chem, similar biases in simulated concentrations of CO and NO2in Beijing can be obtained with a similar emissions inventory. It is likely that the emissions inventory might not have captured the high CO and NO2emissions in October in Beijing. With the concentrations of all the other pollutants underestimated, model results (bothin Chen et al. (2016) and this study) show a severe overestimation of SO2concentrations in Beijing. The simulated SO2concentrations in other cities over NC were in the range of 30—70 μg m-3, showing much smaller model positive biases than those in Beijing, and indicating that SO2emissions might have been overestimated in Beijing, as new regulations have been applied in recent years. Secondly,we used the anthropogenic emissions for the year 2010,whereas the observed concentrations were taken in 2014,which likely had a considerable impact on the simulated SO2concentrations. As a result of China's ‘Twelfth Five-Year' Plan for National Economic and Social Development (FYP,2011—2015), national emissions of SO2were estimated to have decreased by 12.9% within 2010—2014, due to the wide implementation of fue gas desulfurization systems at thermal power units in China (http://www.mep. gov.cn/gkml/hbb/qt/201507/t20150722_307020.htm). Additionally, the model may have missed some chemical mechanisms or oxidants that oxidize SO2to(Wang et al. 2014), which requires further study.
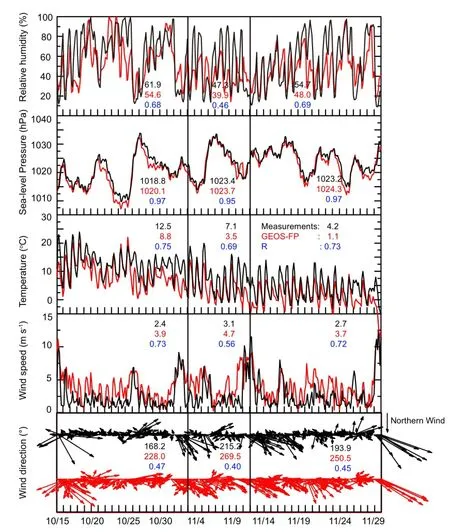
Figure 1.Comparison of measured (black) and GEOS-FP (red) 3-h RH, SLP, 10-m temperature, 10-m wind speed, and wind direction, in Beijing, during 15 October—29 November 2014. The area between the two central black lines represents the APEC time period (3—12 November). Mean values before, during, and after the APEC summit, and the corresponding correlation coefcients (R) between the GEOS-FP meteorological data and measurements, are also shown.
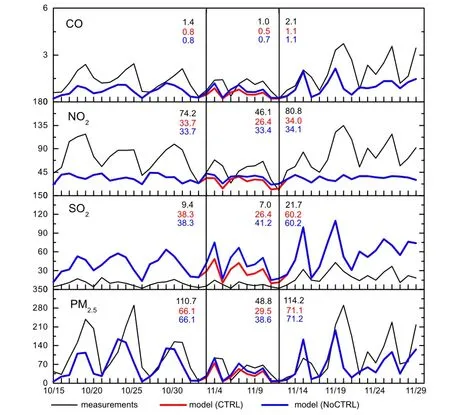
Figure 2.Comparison of the measured (black) and GEOS-Chem simulated (CTRL: red; NoCTRL: blue) daily surface PM2.5, CO, NO2, and SO2concentrations, in Beijing, during 15 October—29 November 2014. The area between the two central black lines represents the APEC time period (3—12 November). The inset numbers are the mean concentrations averaged before, during, and after the APEC summit. Units are mg m-3for CO and μg m-3for the other panels.
During 15 October—29 November 2014, the correlation coefcients between the simulated concentrations from CTRL and observations of PM2.5, CO, NO2, and SO2were 0.58,0.63, 0.44, and 0.83 (p = 0.01), respectively, indicating the model successfully captured the daily variations of each species in Beijing, despite the biases in concentrations. The simulation time period in Figure 2 can be classifed as: before the APEC period (BAP, 15 October to 2 November);during the APEC period (AP, 3—12 November); and after the APEC period (AAP, 13—29 November). Averaged over the diferent time periods, the observed PM2.5concentration in Beijing was 48.8 μg m-3in AP, which was 55.9% lower than the value of 110.68 μg m-3in BAP and 57.3% lower than the value of 114.18 μg m-3in AAP. The reduction of PM2.5in Beijing in AP was reproduced by GEOS-Chem;relative to the simulated concentrations in BAP and AAP, PM2.5concentrations in Beijing in AP in CTRL decreased by 57.4% and 58.5%, respectively. The concentrations of CO,NO2, and SO2also showed reductions during AP, in both observations and the CTRL results (Figure 2).
The efects of the emissions control measures on PM2.5concentrations can be obtained by examining the differences in concentrations in AP between the CTRL and NoCTRL simulations. The simulated PM2.5concentration was 29.5 μg m-3in AP in CTRL, which was 23.4% lower than the value of 38.6 μg m-3in NoCTRL.
3.3. Sensitivity of the PM2.5concentration to emission controls of different species
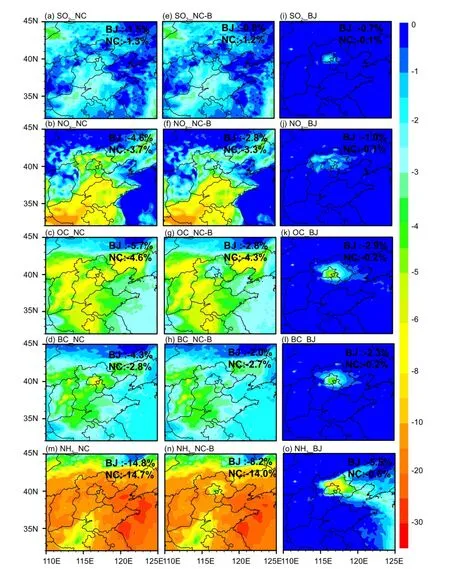
Figure 3.Distribution of the reduction rate of the PM2.5concentration averaged over the APEC summit period (3—12 November 2014) due to emissions reductions of (a, e, i) SO2, (b, f, j) NOx, (c, g, k) OC, (d, h, i) BC, and (m, n, o) NH3, in NC, NC-B, and BJ, as described in Section 2.3. Units: %. The inset numbers are reductions in the PM2.5concentration averaged over BJ and NC for each scenario.
Sensitivity simulations were performed to identify the chemical species whose reductions in emissions made the largest contribution to the decrease in PM2.5concentrations during the APEC period in Beijing, as described in Section 2.3. Figure 3 shows the horizontal distributions of reductions in the PM2.5concentration averaged over AP,defned as
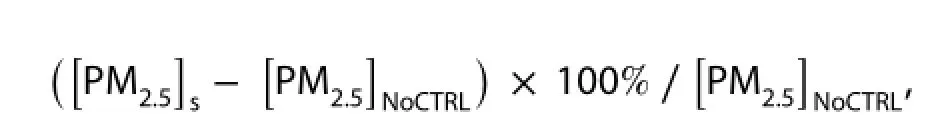
where [PM2.5]sand [PM2.5]NoCTRLare the simulated PM2.5concentrations in the sensitivity case and the NoCTRL simulation, respectively.
Emissions of NOx, SO2, OC, and BC were decreased by tough emissions control measures in Beijing and surrounding areas during AP (Liu et al. 2015). When control measures were carried out for the whole of NC (Figure 3(a)—(d)),the controls of OC and NOxled to the largest reductions in PM2.5concentrations in NC during AP. With emissions reductions of OC and NOxin NC, the average PM2.5concentration decreased by, respectively, by 5.7% and 4.6% in Beijing, and by 4.6% and 3.7% in NC. The reductions in SO2emissions in NC resulted in only 1%—4% reductions in the PM2.5concentration in NC, indicative of the success of the control of SO2emissions in recent years (Zhao, Zhang, and Nielsen 2013). Based on observations during periods when humans use domestic heating (i.e. in winter) of 2013 and 2014, Yang et al. (2016) reported that the concentrations of nitrate andwere 9.89 and 4.90 μg m-3, respectively,during 1—15 November 2014, and 23.08 and 16.68 μg m-3,respectively, during 16—30 November 2014. The model results together with the observations suggest that the control of NOxemissions was important for reducing PM2.5concentrations in NC.
For emissions control measures conducted in NC-B(Figure 3(e)—(h)), the reductions in NOxand OC emissions resulted in the largest reductions (2.8%) in the PM2.5concentration in Beijing. With emissions control measures applied locally in Beijing (Figure 3(i)—(l)), the PM2.5concentration in Beijing was most sensitive to the control of OC. With OC and BC emissions reduced by 30% in Beijing, the average PM2.5concentration in Beijing during AP decreased by 2.9% and 2.3%, respectively, relative to the NoCTRL case. The reductions in the PM2.5concentration were within 2% in the cases of NOxor SO2control. Since emissions of OC and BC derive mainly from the residential sector (Li et al. 2015), these results from the sensitivity experiments indicate that the control of local residential emissions is important for reducing the PM2.5concentration in Beijing. Overall, the decreases in the PM2.5concentration in Beijing during AP were most sensitive to reductions in NOxand OC emissions in NC-B and the local reduction in emissions of carbonaceous aerosols.
We also conducted sensitivity experiments to examine the sensitivity of PM2.5concentrations to reductions in NH3emissions in the same regions (Figure 3(m)—(o)). With NH3emissions reduced by 30% in NC, the average PM2.5concentration in Beijing and NC decreased, respectively, by 14.8% and 14.7%, compared to the NoCTRL case, suggesting that PM2.5concentrations in Beijing and the surrounding provinces are all very sensitive to NH3emissions. As a result of the competing system of, emissions reductions of SO2(NOx) can reduce ammonium sulfate (nitrate)concentrations but increase ammonium nitrate (sulfate)concentrations in PM2.5. With emission reductions of SO2,NOx, and NH3in NC, theconcentrations decreased by 2.8%, 6.0%, and 19.8%, respectively, in Beijing, indicating that the emissions control of NH3in NC is the most efcient in reducingin PM2.5. Since 90% of NH3emissions in China come from the agriculture (Li et al. 2015), NH3emissions can hardly be reduced with short-term emissions control measures. Therefore, it is essential to reduce NH3emissions from farmland and livestock wastes in the long term. Technologies, such as using polymer-coated urea products instead of the common use of nitrogen fertilizer,and optimizing feeding to avoid surplus protein in the animal diet, have been considered to be efective in reducing NH3emissions in western countries (Webb et al. 2008).
The results from the sensitivity simulations provide useful information on emissions reduction strategies in Beijing. In general, cooperating with surrounding provinces and cities could signifcantly improve the efectiveness of emissions control measures, compared to conducting control measures in Beijing alone. For short-term emissions control during wintertime, like in the APEC case, reducing local emissions of carbonaceous aerosols (OC and BC)and regional emissions of NOxand OC is the most efcient approach in reducing PM2.5concentrations in Beijing. For long-term emissions control strategies, reducing NH3emissions from agricultural sources is an efective way to improve the air quality in Beijing. However, decreases in NH3emissions may result in enhancement of aerosol acidity, sinceand nitrate may become insufciently neutralized. Thus, NH3emissions should be carefully controlled in parallel with appropriate SO2and NOxcontrols in NC.
4. Conclusion
This work used a nested-grid capability of the global chemical transport model GEOS-Chem to simulate gases and aerosols to identify the chemical species whose reductions made the largest contribution to the decrease in PM2.5concentrations during the APEC period in Beijing. A series of numerical experiments were conducted to investigate the sensitivity of surface PM2.5concentrations to the reductions in emissions of SO2, NOx, OC, BC, and NH3, from specifc regions.
Results showed that the model successfully captured the daily variations of PM2.5, CO, NO2, and SO2in Beijing,despite the biases in concentrations, with correlation coefcients ranging from 0.44 to 0.83. The discrepancies in peaks between the model results and observations may have arisen from uncertainties in the emissions inventory for local emissions, the mismatch of the emissions base year and model year, and the diferences between actual meteorological conditions (such as wind speed) and those in the model. The concentrations of PM2.5showed similar reductions during AP in both observations and the model simulation. The observed and simulated PM2.5concentrationsduring AP were, respectively, 55.9% and 57.4% lower than the values during BAP, and 57.3% and 58.5% lower than the values during AAP. By comparing simulations with and without emissions control measures, it was found that the emissions control measures led to a 23.4% reduction in the PM2.5concentration during the APEC period.
Considering the emissions control measures conducted during AP, the results from the sensitivity simulations showed that the control measures for NOxand OC over NC led to the largest reductions in PM2.5concentrations in Beijing. Compared to the control of SO2and NOx, the control of NH3emissions was found to be able to greatly reduce theconcentration in PM2.5in the whole of NC. To examine the efectiveness of emissions control measures of various species for the APEC case, we set the emission reduction rates for NOx, SO2, OC, and BC according to the air quality evaluation report of the APEC period released by CNEPA. We also conducted sensitivity tests with same reduction percentages(-30%) for all the species in BJ, NC-B, and NC, respectively. The model results of the two designs of sensitivity tests produced the same major conclusions as described above.
Finally, it is important to highlight that this study focused mainly on the emissions control of primary organic carbon. In fact, secondary organic aerosols were also signifcantly reduced in AP, due to the emissions control of NMVOCs (Sun et al. 2016). This aspect should be investigated in future studies.
Disclosure statement
No potential confict of interest was reported by the authors.
Funding
This work was supported by the National Basic Research Program of China [973 program, grant number 2014CB441202], the Strategic Priority Research Program of the Chinese Academy of Sciences [grant number XDA05100503], and the National Natural Science Foundation of China [grant numbers 41021004,41475137, and 91544219].
References
Ansari, A. S., and S. N. Pandis. 1998. “Response of Inorganic PM to Precursor Concentrations.” Environmental Science and Technology 32: 2706—2714. doi:10.1021/es971130j.
Chen, D., Z. Liu, J. Fast, and J. Ban. 2016. “Simulations of Sulfate-Nitrate-Ammonium (SNA) Aerosols during the Extreme Haze Events over Northern China in October 2014.” Atmospheric Chemistry and Physics 16: 10707—10724. doi:10.5194/acp-16-10707-2016.
Chen, D., Y. Wang, M. B. McElroy, K. He, R. M. Yantosca, and P. Le Sager. 2009. “Regional CO Pollution and Export in China Simulated by the High-resolution Nested-grid GEOS-Chem Model.” Atmospheric Chemistry and Physics 9: 3825—3839. doi:10.5194/acp-9-3825-2009.
Fairlie, T. D., D. J. Jacob, and R. J. Park. 2007. “The Impact of Transpacifc Transport of Mineral Dust in the United States.”Atmospheric Environment 41: 1251—1266. doi:10.1016/j. atmosenv.2006.09.048.
Gao, Y., X. Liu, C. Zhao, and M. Zhang. 2011. “Emission Controls versus Meteorological Conditions in Determining Aerosol Concentrations in Beijing during the 2008 Olympic Games.”Atmospheric Chemistry and Physics 11 (23): 12437—12451. doi:10.5194/acp-11-12437-2011.
Hack, J. J. 1994. “Parameterization of Moist Convection in the National Center for Atmospheric Research Community Climate Model (CCM2).” Journal of Geophysical Research 99: 5551—5568. doi:10.1029/93jd03478.
Holt, J., N. E. Selin, and S. Solomon. 2015. “Changes in Inorganic Fine Particulate Matter Sensitivities to Precursors due to Large-scale US Emissions Reductions.” Environmental Science and Technology 49 (8): 4834—4841. doi:10.1021/acs. est.5b00008.
Jaeglé, L., P. K. Quinn, T. S. Bates, B. Alexander, and J.-T. Lin. 2011.“Global Distribution of Sea Salt Aerosols: New Constraints from in Situ and Remote Sensing Observations.” Atmospheric Chemistry and Physics 11: 3137—3157. doi:10.5194/acp-11-3137-2011.
Kim, P. S., D. J. Jacob, J. A. Fisher, K. Travis, K. Yu, L. Zhu, R. M. Yantosca, et al. 2015. “Sources, Seasonality, and Trends of Southeast US Aerosol: An Integrated Analysis of Surface,Aircraft, and Satellite Observations with the GEOS-Chem Chemical Transport Model.” Atmospheric Chemistry and Physics 15: 10411—10433. doi:10.5194/acp-15-10411-2015.
Li, M., Q. Zhang, J. Kurokawa, J.-H. Woo, K. B. He, Z. Lu, T. Ohara, et al. 2015. “MIX: A Mosaic Asian Anthropogenic Emission Inventory for the MICS-Asia and the HTAP Projects.”Atmospheric Chemistry and Physics Discussions 15 (23): 34813—34869. doi:10.5194/acpd-15-34813-2015.
Liu, H., D. J. Jacob, I. Bey, and R. M. Yantosca. 2001. “Constraints from210Pb and7Be on Wet Deposition and Transport in a Global Three-dimensional Chemical Tracer Model Driven by Assimilated Meteorological Fields.” Journal of Geophysical Research 106 (D11): 12109—12128. doi:10.1029/2000jd900839. Liu, J., P. Xie, Y. Wang, Z. Wang, H. He, and W. Liu. 2015. “Haze Observation and Control Measure Evaluation in Jing-Jin-Ji (Beijing, Tianjin, Hebei) Area during the Period of the Asia-Pacifc Economic Cooperation (APEC) Meeting.” S&T and Society 30 (3): 368—377. doi:10.16418/j.issn.1000-3045.2015.03.011.
Park, R. J., D. J. Jacob, M. Chin, and R. V. Martin. 2003. “Sources of Carbonaceous Aerosols over the United States and Implications for Natural Visibility.” Journal of Geophysical Research 108(D12),4355: AAC 5-1 -12. doi:10.1029/2002JD003190.
Park, R. J., D. J. Jacob, B. D. Field, and R. M. Yantosca. 2004.“Natural and Transboundary Pollution Infuences on Sulfate—Nitrate—Ammonium Aerosols in the United States: Implications for Policy.” Journal of Geophysical Research 109: D15204. doi:10.1029/2003JD004473.
Pui, D. Y. H., S.-C. Chen, and Z. Zuo. 2014. “PM2.5in China: Measurements, Sources, Visibility and Health Efects,and Mitigation.” Particuology 13: 1—26. doi:10.1016/j. partic.2013.11.001.
Pye, H. O. T., H. Liao, S. Wu, L. J. Mickley, D. J. Jacob, D. K. Henze,and J. H. Seinfeld. 2009. “Efect of Changes in Climate and Emissions on Future Sulfate—Nitrate—Ammonium Aerosol Levels in the United States.” Journal of Geophysical Research 114: D01205. doi:10.1029/2008JD010701.
Sun, Y., Z. Wang, O. Wild, W. Xu, C. Chen, P. Fu, W. Du, et al. 2016.“‘APEC Blue': Secondary Aerosol Reductions from Emission Controls in Beijing.” Scientifc Reports 6: 20668. doi:10.1038/ srep20668.
Wang, S., J. Xing, C. Jang, Y. Zhu, J. S. Fu, and J. Hao. 2011. “Impact Assessment of Ammonia Emissions on Inorganic Aerosols in East China Using Response Surface Modeling Technique.”Environmental Science and Technology 45 (21): 9293—9300. doi:10.1021/es2022347.
Wang, Y., Q. Zhang, J. Jiang, W. Zhou, B. Wang, K. He, F. Duan, Q. Zhang, S. Philip, and Y. Xie. 2014. “Enhanced Sulfate Formation during China's Severe Winter Haze Episode in January 2013 Missing from Current Models.” Journal of Geophysical Research: Atmosphere 119: 10425—10440. doi:10.1002/2013JD021426. Wang, M., T. Zhu, J. Zheng, R. Y. Zhang, S. Q. Zhang, X. X. Xie, Y. Q. Han, and Y. Li. 2009. “Use of a Mobile Laboratory to Evaluate Changes in on-Road Air Pollutants during the Beijing 2008 Summer Olympics.” Atmospheric Chemistry and Physics 9: 8247—8263. doi:10.5194/acp-9-8247-2009.
Webb, J., N. J. Hutchings, S. Bittman, S. M. H. Baker, B. Reidy, C. Raes, K. Smith, J. Ayres, and T. Misselbrook. 2008. “Reliability of Ammonia Emission Estimates and Abatement Efciencies.”In Atmospheric Ammonia-Detecting Emission Changes and Environmental Impacts, edited by M. A. Sutton, S. Reis, and S. M. H. Baker, 423—432. Didcot: Springer.
Wesely, M. 1989. “Parameterization of Surface Resistances to Gaseous Dry Deposition in Regional-scale Numerical Models.”Atmospheric Environment 23: 1293—1304. doi:10.1016/0004-6981(89)90153-4.
West, J. J., A. S. Ansari, and S. N. Pandis. 1999. “Marginal PM2.5: Nonlinear Aerosol Mass Response to Sulfate Reductions in the Eastern United States.” Journal of the Air and Waste Management Association 49: 1415—1424. doi:10.1080/10473 289.1999.10463973.
Wu, S., L. J. Mickley, D. J. Jacob, J. A. Logan, R. M. Yantosca,and D. Rind. 2007. “Why Are There Large Diferences between Models in Global Budgets of Tropospheric Ozone?” Journal of Geophysical Research 112: D05302. doi:10.1029/2006JD007801.
Yang, H., J. Chen, J. Wen, H. Tian, and X. Liu. 2016. “Composition and Sources of PM2.5around the Heating Periods of 2013 and 2014 in Beijing: Implications for Efcient Mitigation Measures.” Atmospheric Environment 124: 378—386. doi:10.1016/j.atmosenv.2015.05.015.
Zhai, S., X. An, Z. Liu, Z. Sun, and Q. Hou. 2016. “Model Assessment of Atmospheric Pollution Control Schemes for Critical Emission Regions.” Atmospheric Environment 124: 367—377. doi:10.1016/j.atmosenv.2015.08.093.
Zhang, G. J., and N. A. McFarlane. 1995. “Sensitivity of Climate Simulations to the Parameterization of Cumulus Convection in the Canadian Climate Centre General Circulation Model.”Atmosphere-Ocean 33: 407—446. doi:10.1080/07055900.1995 .9649539.
Zhao, Y., J. Zhang, and C. P. Nielsen. 2013. “The Efects of Recent Control Policies on Trends in Emissions of Anthropogenic Atmospheric Pollutants and CO2in China.” Atmospheric Chemistry and Physics 13: 487—508. doi:10.5194/acp-13-487-2013.
Zhu, L., D. K. Henze, K. E. Cady-Pereira, M. W. Shephard, M. Luo, R. W. Pinder, J. O. Bash, and G.-R. Jeong. 2013. “Constraining U.S. Ammonia Emissions Using TES Remote Sensing Observations and the GEOS-Chem Adjoint Model.” Journal of Geophysical Research: Atmosphere 118: 3355—3368. doi:10.1002/ jgrd.50166.
PM2.5; 减排; 亚洲-太平洋经济合作峰会; 北京;GEOS-Chem
12 April 2016
CONTACT LIAO Hong hongliao@nuist.edu.cn
© 2016 The Author(s). Published by Informa UK Limited, trading as Taylor & Francis Group.
This is an Open Access article distributed under the terms of the Creative Commons Attribution License (http://creativecommons.org/licenses/by/4.0/), which permits unrestricted use, distribution, and reproduction in any medium, provided the original work is properly cited.
猜你喜欢
杂志排行
Atmospheric and Oceanic Science Letters的其它文章
- Parameterizing an agricultural production model for simulating nitrous oxide emissions in a wheat-maize system in the North China Plain
- Contrasting two spring SST predictors for the number of western North Pacific tropical cyclones
- The impact of solar activity on the 2015/16 El Niño event
- Quantifying the attribution of model bias in simulating summer hot days in China with IAP AGCM 4.1
- Model analysis of secondary organic aerosol over China with a regional air quality modeling system (RAMS-CMAQ)
- Is the interdecadal circumglobal teleconnection pattern excited by the Atlantic multidecadal Oscillation?