Is the interdecadal circumglobal teleconnection pattern excited by the Atlantic multidecadal Oscillation?
2016-11-23LINJianSheWUBoandZHOUTianJun
LIN Jian-She, WU Boand ZHOU Tian-Jun
aThe State Key Laboratory of Numerical Modeling for Atmospheric Sciences and Geophysical Fluid Dynamics, Institute of Atmospheric Physics,Chinese Academy of Sciences, Beijing, China;bCollege of Earth Science, University of Chinese Academy of Sciences, Beijing, China;cJoint Center for Global Change Studies, Beijing, China
Is the interdecadal circumglobal teleconnection pattern excited by the Atlantic multidecadal Oscillation?
LIN Jian-Shea,b, WU Boa,cand ZHOU Tian-Juna,c
aThe State Key Laboratory of Numerical Modeling for Atmospheric Sciences and Geophysical Fluid Dynamics, Institute of Atmospheric Physics,Chinese Academy of Sciences, Beijing, China;bCollege of Earth Science, University of Chinese Academy of Sciences, Beijing, China;cJoint Center for Global Change Studies, Beijing, China
The interdecadal circumglobal teleconnection (ID-CGT) pattern is the dominant circulation mode over the NH during boreal summer on the interdecadal time scale. Its temporal evolution is synchronous with that of the Atlantic Multidecadal Oscillation (AMO). In this study, through analyzing the results of sensitivity experiments using fve AGCMs driven by specifed AMO-related SST anomalies (SSTAs) in the North Atlantic, the authors investigate whether the ID-CGT is excited by the AMO. Two out of the fve models simulate the barotropic stationary wave pattern located along the westerly jet, suggesting that the ID-CGT pattern should be excited, at least partially, by the AMO-related SSTAs. Model results suggest that the ID-CGT pattern plays a role in linking the AMO and NH summer land SAT perturbations on the interdecadal time scale.
ARTICLE HISTORY
Revised 22 May 2016
Accepted 31 May 2016
Interdecadal circumglobal teleconnection; Atlantic Multidecadal Oscillation;AGCMs
年代际环球遥相关型(ID-CGT)是夏季北半球大气环流年代际变化的主导模态,其位相的时间演变与大西洋多年代际振荡(AMO)基本同步。本研究利用5个大气环流模式的敏感性试验,研究给定AMO型的海表面温度异常能否强迫出ID-CGT型响应。结果显示,5个模式中的2个模拟出了沿西风急流分布的波列状响应,表明ID-CGT至少部分是由AMO型的海温异常所激发。此外,模式模拟的结果显示,在年代际尺度上,AMO可能通过ID-CGT影响夏季北半球陆表气温。
1. Introduction
The Atlantic Multidecadal Oscillation (AMO) is an alternate basin-wide warming and cooling in the North Atlantic,with a periodicity of about 60—80 years (Delworth, Zhang,and Mann 2007; Kilbourne et al. 2008; Knudsen et al. 2011). It is one of the two leading modes of the internally generated interdecadal variability of the climate system (the other is the Interdecadal Pacifc Oscillation) (Liu 2012). The formation of the AMO primarily results from the interdecadal variation of the northward meridional heat transport associated with the Atlantic meridional overturning circulation (Marini and Frankignoul 2014).
The AMO has considerable impacts on the summer climate in the NH. The positive phase of the AMO causes a warming of NH annual mean surface air temperature (SAT)(Zhang, Delworth, and Held 2007; DelSole, Tippett, and Shukla 2011), an increase in summer SAT in North America and Europe (Sutton and Hodson 2005), a decrease in summer precipitation over the U.S. Great Plains (McCabe, Palecki, and Betancourt 2004; Nigam, Guan, and Ruiz-Barradas 2011), and an increase in summer rainfall over the Sahel in northern Africa (Knight, Folland, and Scaife 2006;Mohino, Janicot, and Bader 2011). In addition, the AMO can also modulate the East Asian summer monsoon (Lu, Dong,and Ding 2006; Lu and Dong 2008; Yu et al. 2009) and the Indian summer monsoon (Goswami et al. 2006; Lu, Dong,and Ding 2006; Li et al. 2008; Wang, Li, and Luo 2009).
Based on 20CR data, Wu, Zhou, and Li (2016) found that, during boreal summer, AMO-related SST anomalies(SSTAs) correspond to a wave train-like teleconnection pattern located along the NH westerly jet. The teleconnection pattern possesses some striking dynamic properties that resemble those of the conventional circumglobal teleconnection (CGT) pattern defned on the interannual timescale (hereafter, IA-CGT), including zonal wavenumber fve and the propagation along the waveguide associated with the westerly jet (Ding and Wang 2005). Given this resemblance, the interdecadal circumglobal teleconnectionpattern is referred to as the ID-CGT pattern (Wu, Lin, and Zhou 2016). However, the ID-CGT pattern shows three features that make it distinct from the IA-CGT. Firstly, the fve nodes of the ID-CGT shift westward relative to the latter by about 1/4 wavelength. Secondly, all fve nodes of the ID-CGT exhibit barotropic structures, whereas the IA-CGT has a baroclinic node. Thirdly, the ID-CGT (IA-CGT) is highly correlated with the AMO (Indian summer monsoon precipitation) index (Wu, Lin, and Zhou 2016).
Though the temporal evolution of the ID-CGT is synchronous with that of the AMO, it is difcult to answer whether the ID-CGT is excited by the AMO purely through observational analysis. In this study, we explore this issue through analyzing the results of idealized numerical experiments. Our strategy is to assess the responses of multiple AGCMs to the specifed AMO-related SSTAs in the North Atlantic. It is found that some models reasonably simulate a wave train-like teleconnection pattern located along the NH westerly jet, suggesting the ID-CGT pattern is partly forced by SSTAs associated with the AMO.
2. Data, analysis method, and experimentdesign
2.1. Observational and reanalysis data
The observational and reanalysis data used in the study include:
(1) Geopotential height from the 20CR data-set for
the period 1920—2012 (Compo et al. 2011);
(2) Observational SST from the HadISSTv1.1 dataset for the period 1920—2012 (Rayner et al. 2003);
(3) Observational land SAT from the CRU TS3.21 data-set for the period 1920—2012 (Jones and Harris 2013).
2.2. Analysis method
Following Ting et al. (2009), the AMO index is defned as area-averaged SSTAs in the North Atlantic (0°—60°N,80°W—0°) with the global warming signal removed through regression analysis (Figure 1(a)). The global warming signal is represented by the near global mean SST (60°S—60°N). We focus on interdecadal variability, and an 8-yr running average is applied to the AMO index to flter out highfrequency signals. The circulation and SAT anomalies associated with the AMO are obtained through regressing against the normalized 8-yr running averaged AMO index. Because it is difcult to accurately estimate the efective sample size of the running averaged AMO index, we use a non-parameter method—the random-phase test—to estimate the statistical signifcance of the regression analyses (Ebisuzaki 1997).
To investigate the propagation direction of wave energy associated with the ID-CGT, we analyze the wave-activity fux for stationary Rossby waves, as proposed by Takaya and Nakamura (2001). Its horizontal components in pressure coordinates are
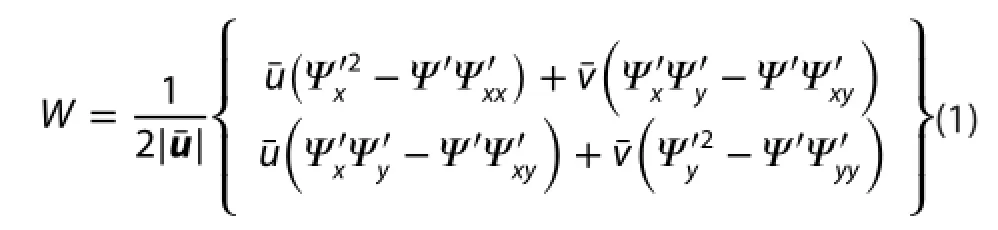
Here, overbars and primes denote mean states and deviations from the mean states, respectively; Subscript x and y represent zonal and meridional gradients; u = (u, v)denotes horizontal wind velocity; ψ represents eddy stream functions.
2.3. Numerical experiment
The idealized AGCM experiment results used in the study are from the experiments organized by the U.S. CLIVAR drought working group (Schubert et al. 2009). The AGCMs were driven by various constructed idealized SSTs. The original objective of these experiments was to investigate the physical mechanisms linking SST changes to drought. The fve AGCMs participating in the project were NASA NSIPP1, NCEP GFS, LDEO/NCAR CCM3, NCAR CAM3.5, and GFDL AM2.1 (Schubert et al. 2009).
The experiments used in the study include: (1) a control run forced with seasonally varying climatological SST(named the PnAn run); and (2) a sensitivity run forced with SSTAs in the North Atlantic related to the positive phase of the AMO superposed on the seasonally varying climatological SST (named the PnAw run). The AMO-related SST anomaly was obtained by applying a rotated EOF analysis on the annual mean near global SSTA during 1901—2004. Because the AMO is an internally generated interdecadal mode, its spatial pattern is not very sensitive to the extraction method. The pattern correlation coefcient between AMO-related SSTAs used in the experiments and that in Figure 1(b) reaches 0.78 in the red box. Nearly all models were integrated for at least 50 years, except for the NCEP GFS runs, which were integrated for only 36 years. During the integrations, the boundary conditions had an annual cycle, but no interannual variations. However, interannual variability is still generated in atmospheric models due to various nonlinear processes. Hence, the outputs of the last 30 years of the model simulations used in the analyses are independent of each other and basically equivalent to 30-member ensembles. The diferences between the PnAw and PnAn runs represent the models' responses tothe AMO-related SSTAs. The signifcances of the models' responses are examined using the Student's t-test.
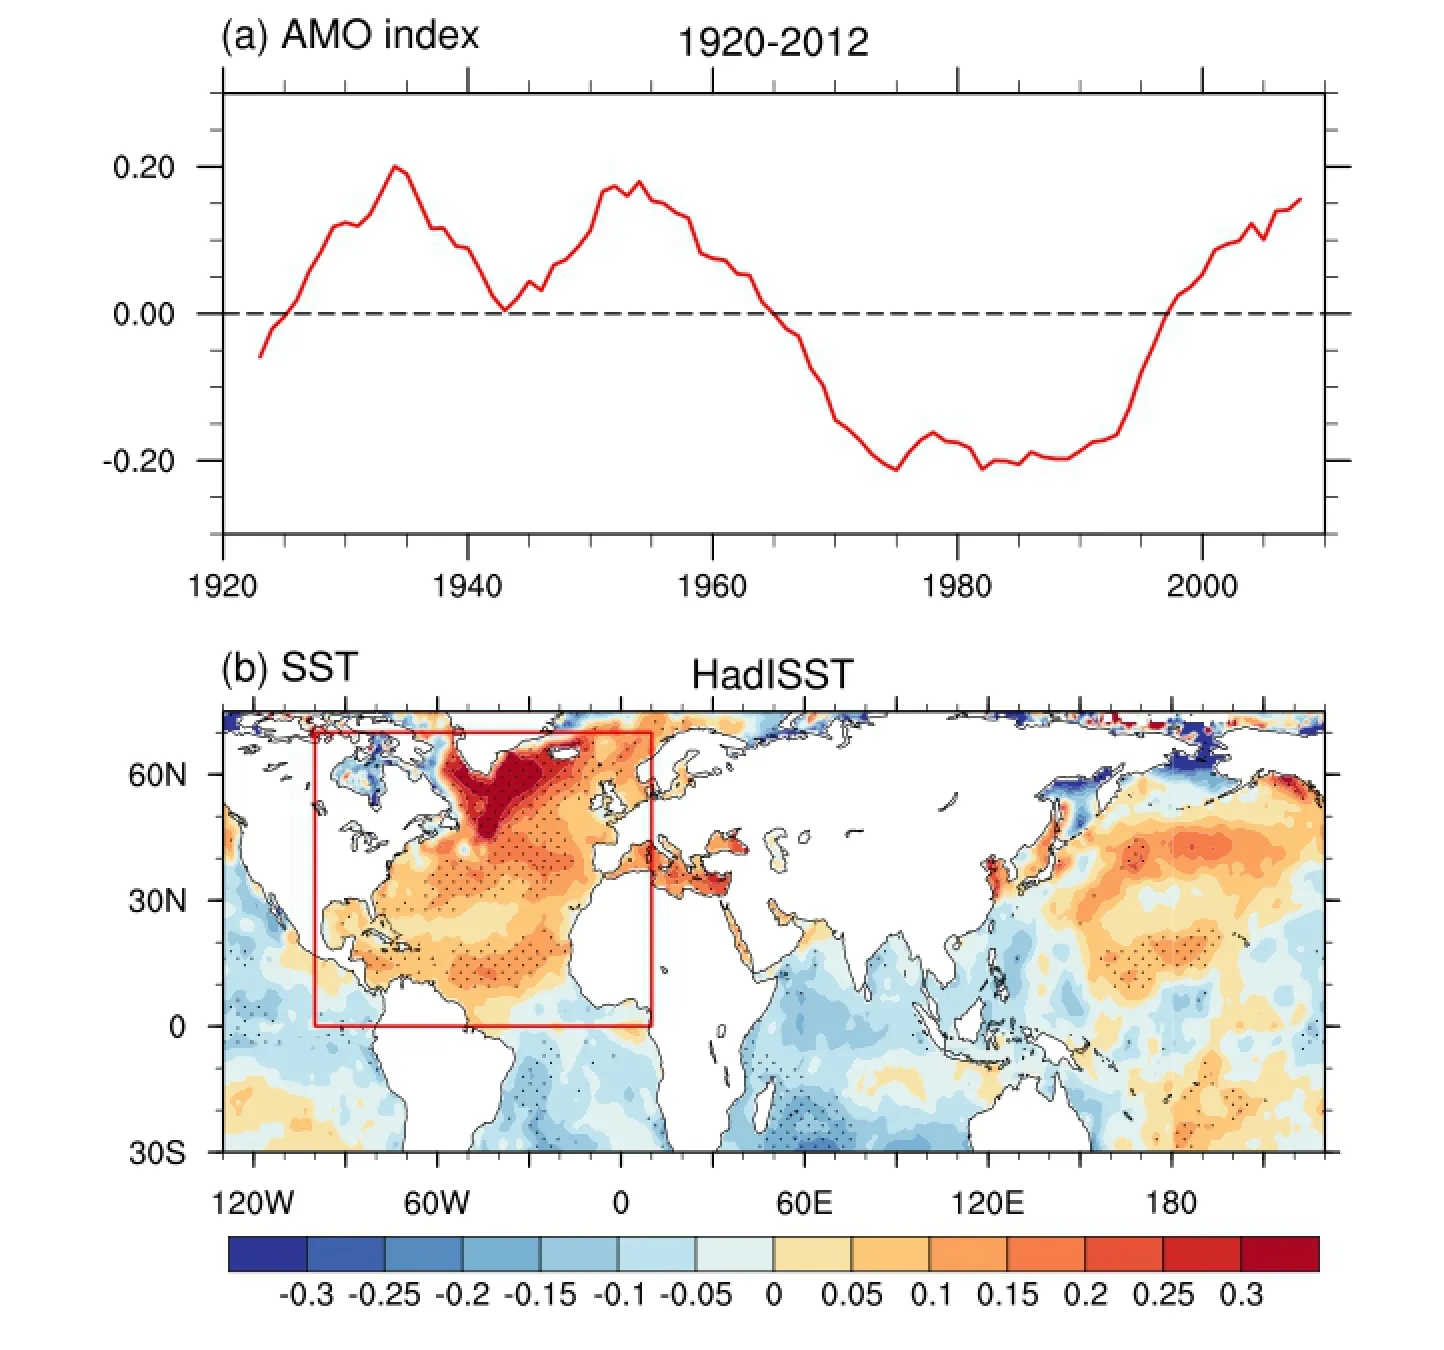
Figure 1.(a) AMO index, defned as 8-yr running averaged SSTAs in the North Atlantic (0°—60°N, 80°W—0°), with the global warming signal removed. (b) Spatial pattern of the AMO, obtained through regression on the normalized AMO index (units: K). The red box denotes the area in which SSTAs are specifed to drive the AGCMs. Dots denote values attaining the 0.1 signifcance level.
3. Results
The AMO-related SSTAs show a basin-wide warming/cooling in the North Atlantic, with tropical and extratropical branches centered over the tropical North Atlantic and Labrador Sea, respectively (Figure 1(b)), consistent with previous studies (e.g. Sutton and Hodson 2005; Gastineau and Frankignoul 2015). The AMO-related SSTAs correspond to an ID-CGT pattern in the upper troposphere during boreal summer, which is located along the NH westerly jet,with a zonal wavenumber 5 pattern (Figure 2(a)). The wave energy associated with the ID-CGT propagates eastward along the waveguide associated with the westerly jet, indicating the importance of the role of extratropical atmospheric dynamics in the maintenance of the ID-CGT pattern. The fve nodes of the ID-CGT are centered over eastern Europe, southwest of Baikal, the northwestern Pacifc, and the western and eastern coasts of North America, respectively (Figure 2(a)). All fve nodes possess barotropic structures (Figure 2), indicating that the ID-CGT is not associated with tropical convection anomalies like the conventional IA-CGT pattern, because the tropical convective heating tends to drive baroclinic modes in terms of the Gill model(Gill 1980). In the upper troposphere, the ID-CGT pattern is dominated by positive geopotential height anomalies(Figure 2(a)); whereas in the lower troposphere, the magnitudes of the alternating positive and negative anomalies are comparable (Figure 2(c)). The zonal mean component of the ID-CGT pattern intensifes with height (fgure not shown).
To investigate whether the ID-CGT pattern is excited by the AMO, we examine the responses of the fve AGCMs to the specifed AMO-related warm SSTAs in the North Atlantic. As shown in Figure 3, two of the fve models(NCAR CAM3.5 and GFDL AM2.1) reasonably reproduce a well-organized wave train-like pattern confned within the NH westerly jet. The wave pattern of CAM3.5 exhibits a zonal wavenumber 4 pattern and is completely out of the phase with the ID-CGT pattern derived from the 20CR data (Figure 3(a)). Hence, the pattern correlation of NH extratropical 200 hPa geopotential height (Z200)anomalies (30—70°N) between NCAR CAM3.5 and 20CR is only 0.15. However, the simulated wave pattern holds some dynamic properties that are consistent with the ID-CGT derived from 20CR, including the wave energypropagating eastward along the waveguide associated with the westerly jet and circumscribing the entire NH(Figure 3(a)), and the barotropic vertical structures of the four nodes of the wave pattern (Figure S1).
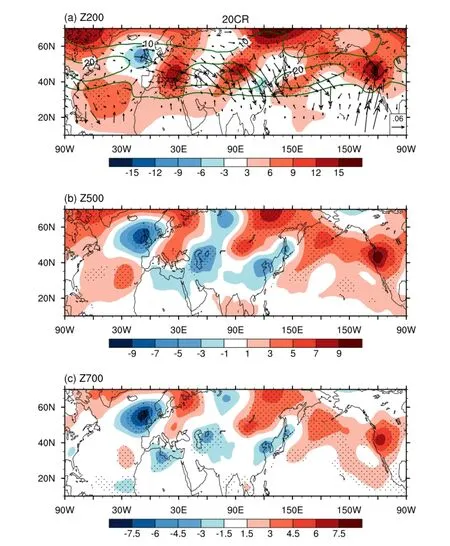
Figure 2.Atmospheric circulation anomalies associated with the AMO, derived from 20CR data: (a) JJA-mean 200 hPa geopotential height anomalies regressed on the normalized AMO index (color shading; units: m; JJA: June—July—August) and corresponding waveactivity fuxes (vectors; units: m2s-2). The contours are the climatological 200-hPa zonal wind in JJA (units: m s-1). (b, c) JJA-mean 500 and 700 hPa geopotential height anomalies regressed on the normalized AMO index. Dots denote values attaining the 0.1 signifcance level.
The wave pattern of GFDL AM2.1 exhibits a wavenumber 5 pattern (Figure 3(c)). The longitudes of the three nodes over the Eurasian continent and northwestern Pacifc are generally consistent with those in the ID-CGT pattern, while the other two nodes over North America and the North Atlantic are not exactly in phase with the latter (Figure 3(c)). The pattern correlation of NH extratropical Z200 anomalies between GFDL AM2.1 and 20CR reaches 0.65. The wave energy associated with the wave pattern propagates eastward from the eastern North Atlantic to the northwestern Pacifc (Figure 3(c)). Nearly all nodes show barotropic vertical structures except for that centered in the northeastern Pacifc (Figure S2). Though the models' responses show some weaknesses, the results of CAM3.5 and GFDL AM2.1 suggest that the barotropic stationary wave train-like pattern propagating along the westerly jet can be partly excited by the AMO-related SST forcing.
The atmospheric responses to extratropical SST forcing largely project on the atmospheric internal variability, which is primarily shaped by the interactions between transient eddy and large-scale fow (Kushnir et al. 2002). This explains why none of these models reproduce atmospheric circulation anomalies excited by the AMO perfectly.The uncertainties of the atmospheric responses to underlying AMO-related SSTAs in diferent AGCMs, including IAP/LASG AGCM, are also seen in Hodson et al. (2010).
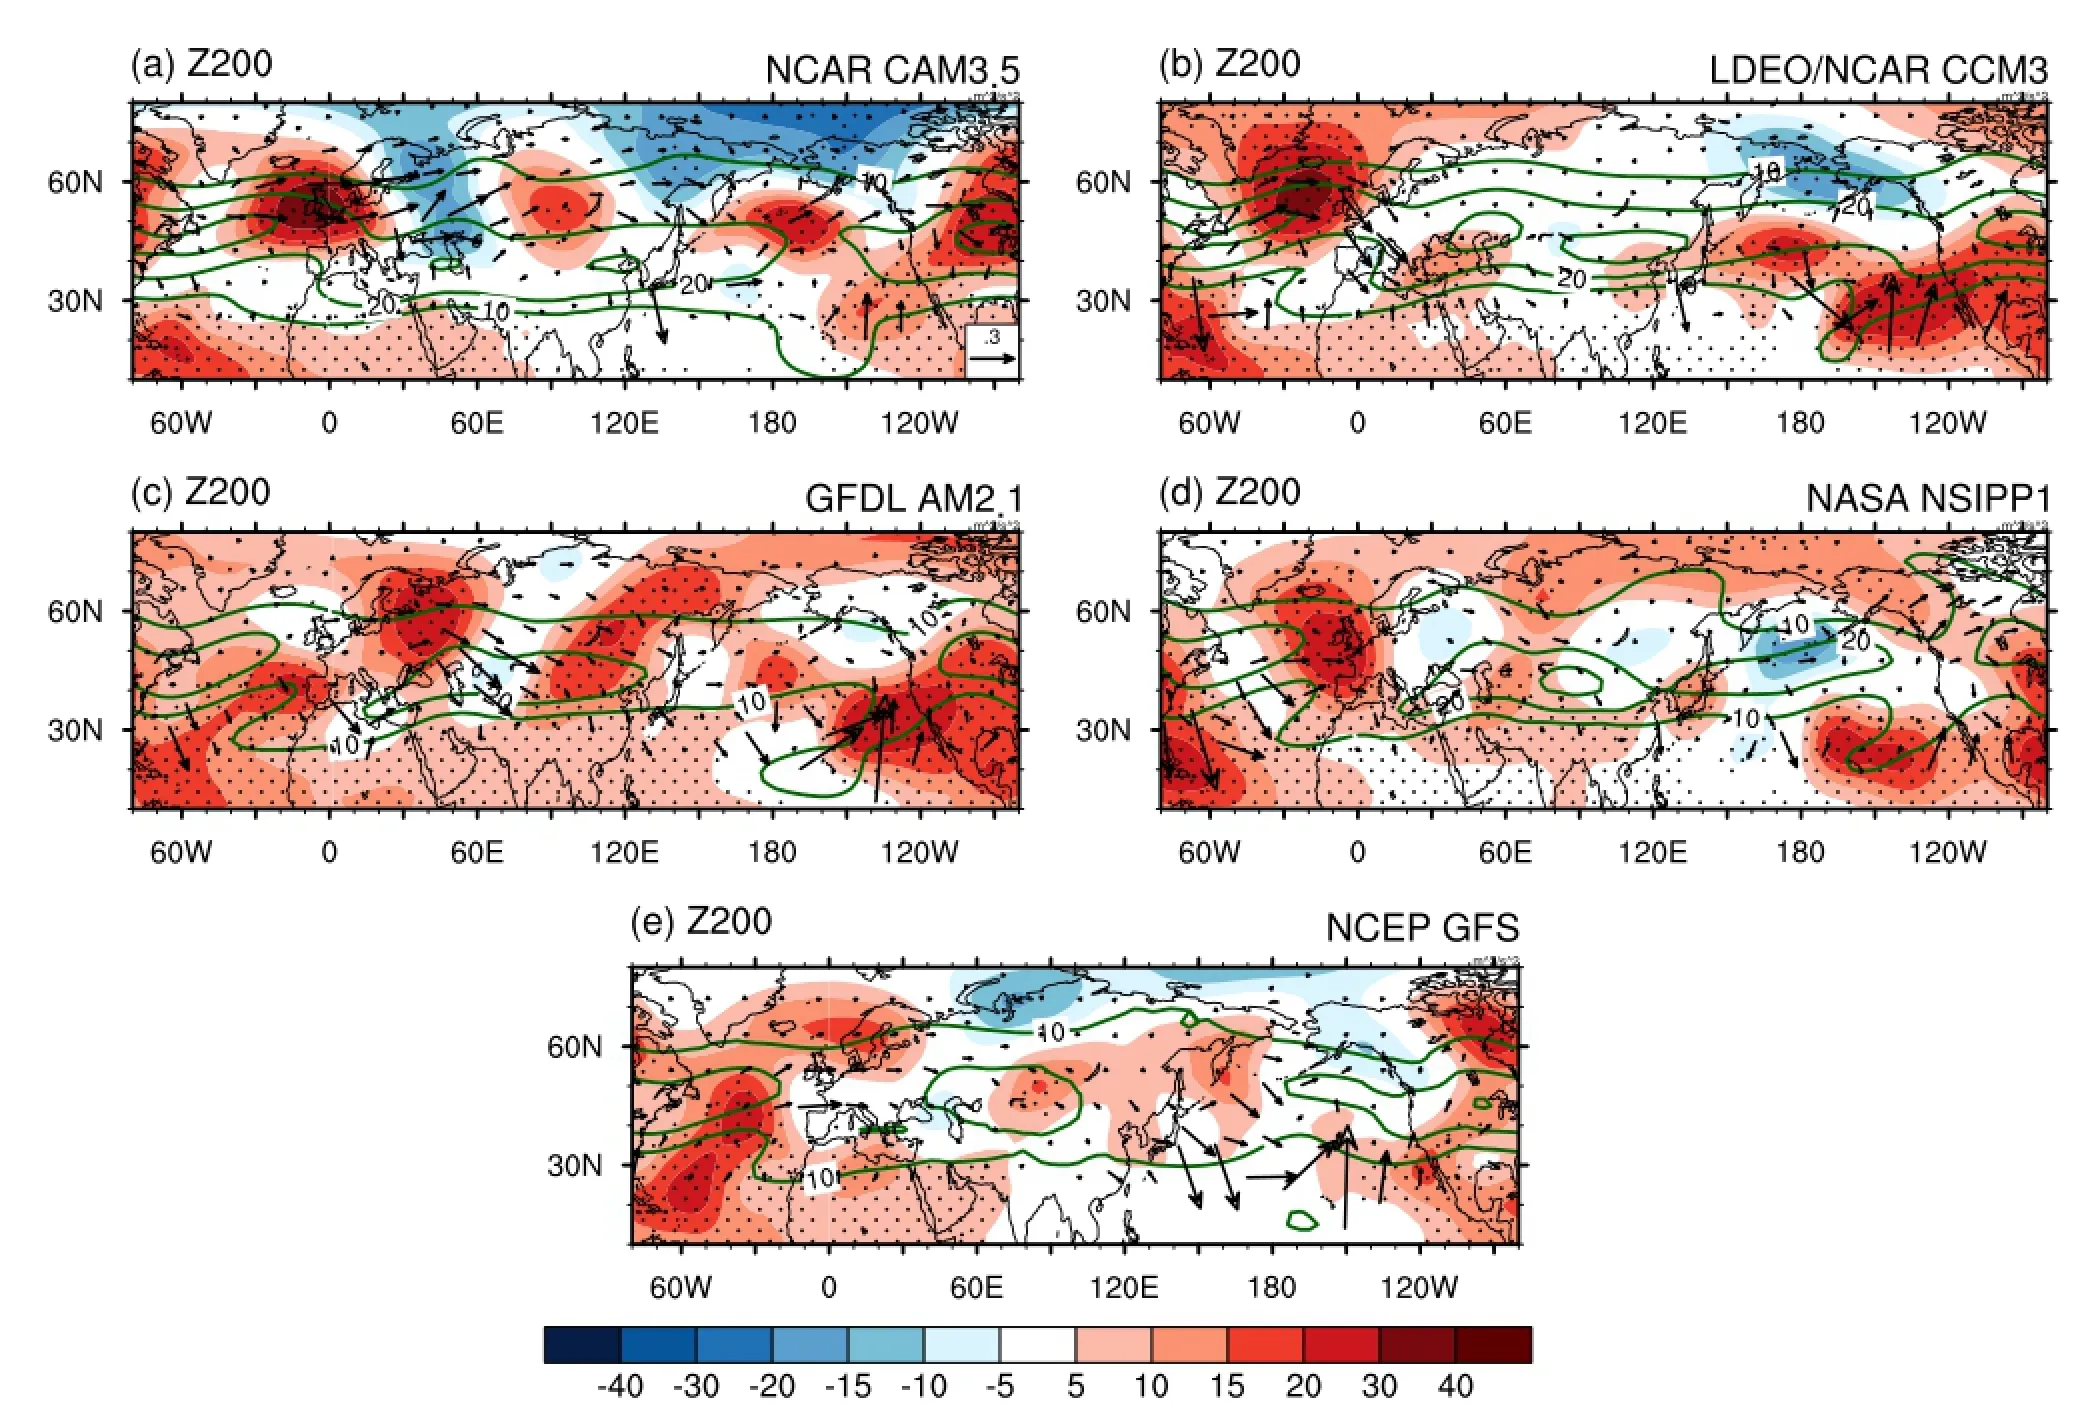
Figure 3.Diferences in the JJA-mean 200 hPa geopotential height anomalies between the sensitivity runs and control runs (color shading; units: m) and corresponding wave-activity fuxes (vectors; units: m2s-2): (a) NCAR CAM3.5; (b) LDEO/NCAR CCM3; (c) GFDL AM2.1; (d) NASA NSIPP1; (e) NCEP GFS. The contours are climatological 200 hPa zonal wind in JJA simulated by the control run (units: m s-1). Dots denote values attaining the 0.1 signifcance level.
In observations, the land SAT anomalies associated with the AMO over the midlatitude Eurasian continent show alternate positive and negative variations, with positive anomalies over Eastern Europe and East Asia, and negative anomalies over Central Asia. Meanwhile, midlatitude North America is dominated by warm anomalies(Figure 4(a)) (Wu, Lin, and Zhou 2016). The warm (cold)land SAT anomalies derived from the CRU data generally correspond to overlying anticyclonic (cyclonic) anomalies,suggesting that the ID-CGT modulates land SAT along its path (Wu, Lin, and Zhou 2016). Thus, the ID-CGT pattern acts as a bridge linking the AMO with the NH midlatitude summer climate. For CAM3.5, because the simulated wave pattern is not exactly in phase with the ID-CGT pattern derived from 20CR, the land SAT responses are not exactly consistent with observations, especially over the Eurasian continent. For GFDL AM2.1, because the wave pattern is in phase with the ID-CGT from 20CR over the Eurasian continent, the corresponding warm land SAT anomalies are highly consistent with observations. One discrepancy is that the cold SAT anomaly in Central Asia is weaker than observed.
4. Conclusion and discussion
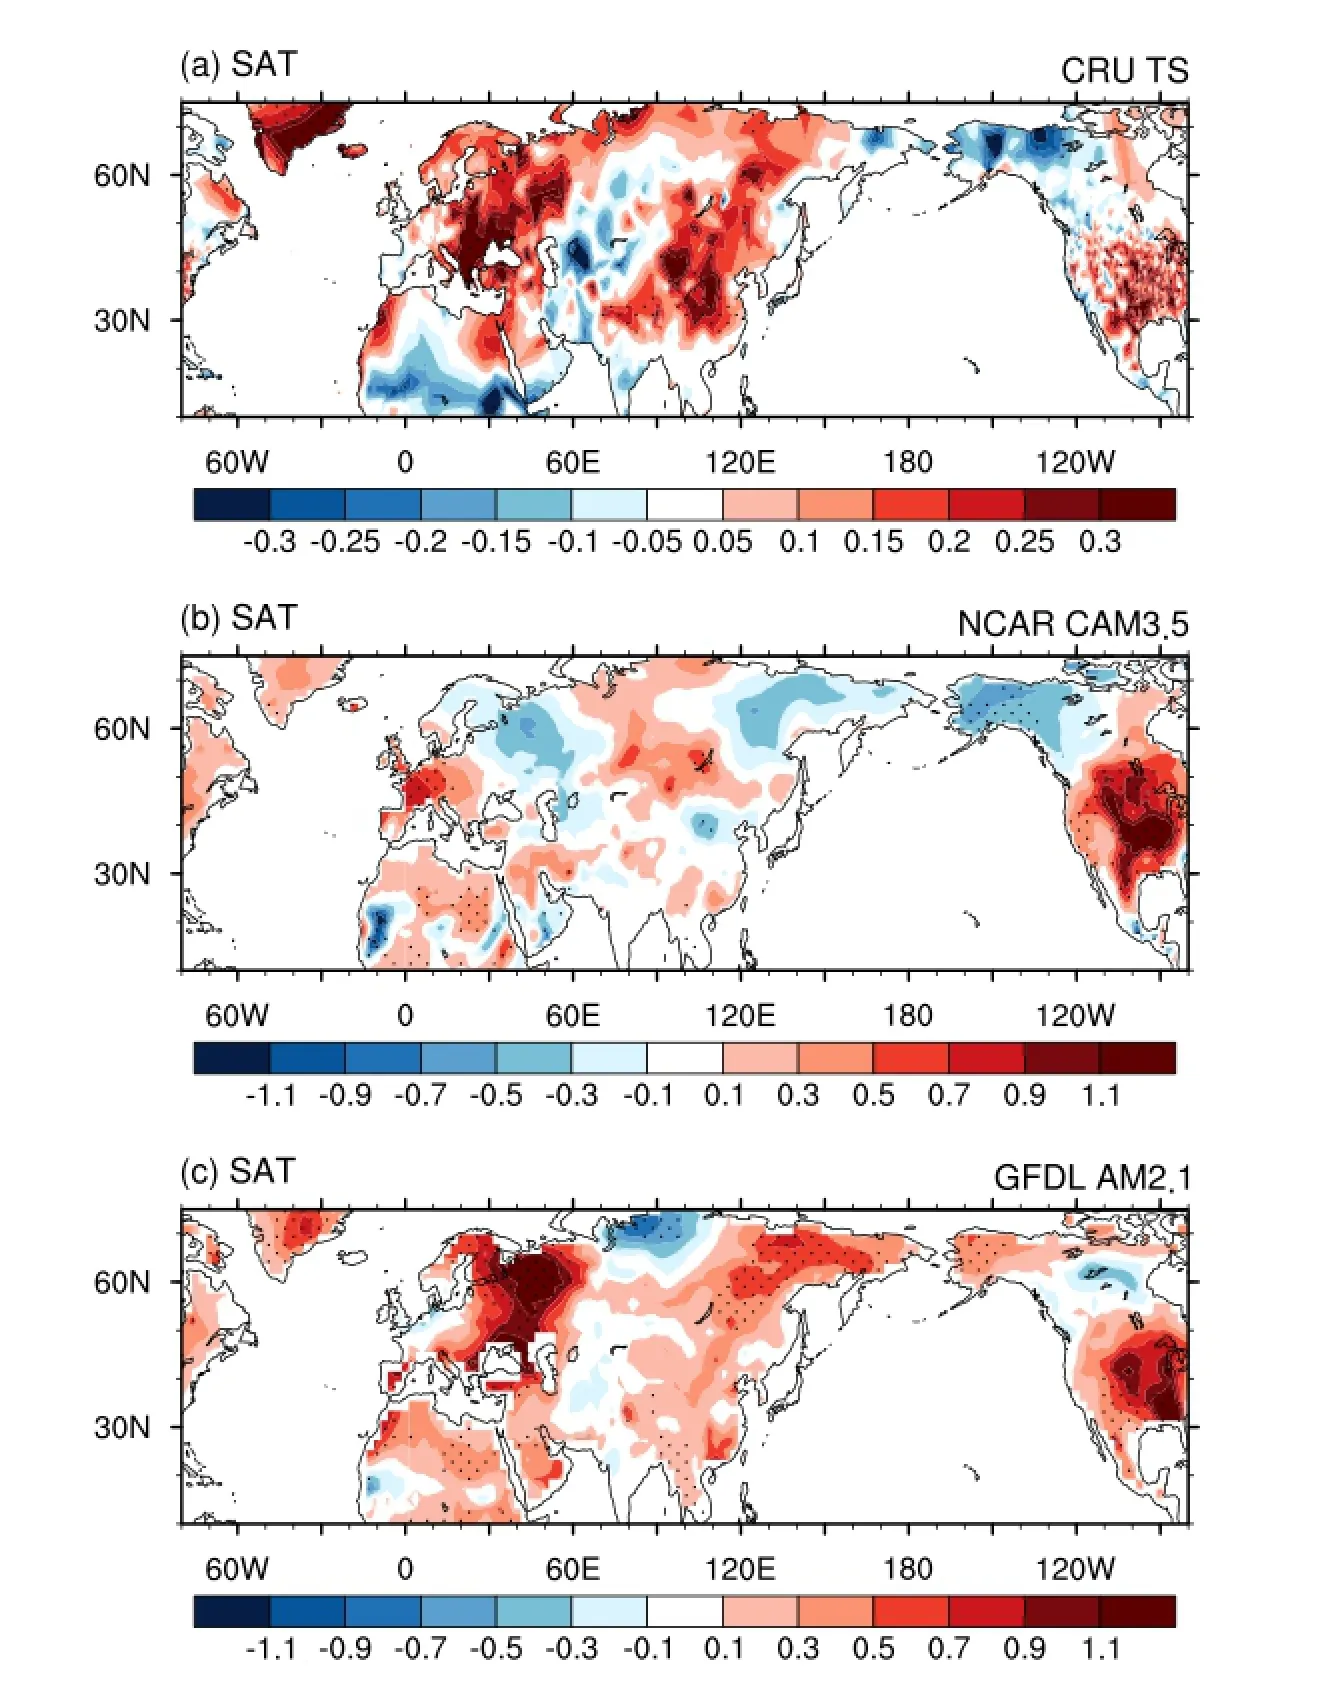
Figure 4.(a) Land SAT anomalies regressed on the normalized AMO index, derived from CRU. (b, c) Diferences in the land SAT between the sensitivity run and control run for NCAR CAM3.5 and GFDL AM2.1, respectively. Dots denote values attaining the 0.1 signifcance level.
The ID-CGT pattern is a stationary teleconnection pattern on the interdecadal time scale. It is located along the westerly jet and exhibits a zonal wavenumber 5 pattern,resembling the conventional IA-CGT pattern. All of the fve nodes of the ID-CGT pattern hold barotropic vertical structures, suggesting that it is not excited by tropical convective heating like the conventional IA-CGT pattern. Though correlation analysis has indicated that the ID-CGT is closely associated with the AMO, it remained unknown as to whether the ID-CGT is excited by the AMO. In this study, we investigated this issue through analyzing the results of idealized numerical experiments. Five AGCMs were driven by specifed AMO-related SSTAs in the North Atlantic, coordinated by the U.S. CLIVAR drought working group. The analysis shows that two out of the fve models (NCAR CAM3.5 and GFDL AM2.1) can reproduce the wave patterns located along the westerly jet, supporting the notion that the ID-CGT is, at least partially, driven by AMO-related SSTAs. The models' responses also show some weaknesses. For NCAR CAM3.5, the wave pattern exhibits a zonal wavenumber 4 pattern and is not in phase with the ID-CGT pattern derived from the 20CR data. For GFDL AM2.1, though the simulated wave pattern exhibits a zonal wavenumber 5 pattern, only three nodes over the Eurasian continent and northwestern Pacifc are in phase with the ID-CGT. It has been reported that external forcing factors only trigger midlatitude atmospheric circulation perturbation, while the spatial pattern and maintenance are largely determined by the internal dynamics of interactions between waves and the mean state (e.g. Ding et al. 2011). Thus, we should not assume that the wave pattern excited by the AMO is exactly in phase with the observation. Which aspects of the basic state determine the shape of the ID-CGT pattern deserves further study through analyzing simulations by more models.
Disclosure statement
No potential confict of interest was reported by the authors.
Funding
This work was jointly supported by the National Basic Research Program of China [grant number 2012CB955202], the National Natural Science Foundation of China [grant numbers 41005040 and 41023002], and the R&D Special Fund for Public Welfare Industry (Meteorology) [grant number GYHY201506012].
References
Compo, G. P., J. S. Whitaker, P. D. Sardeshmukh, N. Matsui,R. J. Allan, X. Yin, B. E. Gleason, et al. 2011. “The Twentieth Century Reanalysis Project.” Quarterly Journal of the Royal Meteorological Society 137: 1—28.
DelSole, T., M. K. Tippett, and J. Shukla. 2011. “A Signifcant Component of Unforced Multidecadal Variability in the Recent Acceleration of Global Warming.” Journal of Climate 24: 909—926.
Delworth, T. L., R. Zhang, and M. E. Mann. 2007. “Decadal to Centennial Variability of the Atlantic from Observations and Models.” Ocean Circulation: Mechanisms and Impacts-Past and Future Changes of Meridional Overturning 173: 131—148.
Ding, Q. H., and B. Wang. 2005. “Circumglobal Teleconnection in the Northern Hemisphere Summer.” Journal of Climate 18: 3483—3505.
Ding, Q., B. Wang, J. M. Wallace, and G. Branstator. 2011. “Tropicalextratropical Teleconnections in Boreal Summer: Observed Interannual Variability.” Journal of Climate 24: 1878—1896.
Ebisuzaki, W. 1997. “A Method to Estimate the Statistical Signifcance of a Correlation When the Data Are Serially Correlated.” Journal of Climate 10: 2147—2153.
Gastineau, G., and C. Frankignoul. 2015. “Infuence of the North Atlantic SST Variability on the Atmospheric Circulation during the Twentieth Century.” Journal of Climate 28: 1396—1416.
Gill, A. E. 1980. “Some Simple Solutions for Heat-induced Tropical Circulation.” Quarterly Journal of the Royal Meteorological Society 106: 447—462.
Goswami, B. N., M. S. Madhusoodanan, C. P. Neema, and D. Sengupta. 2006. “A Physical Mechanism for North Atlantic SST Infuence on the Indian Summer Monsoon.” Geophysical Research Letters 33: L02706.
Hodson, D. L. R., R. T. Sutton, C. Cassou, N. Keenlyside, Y. Okumura,and T. Zhou. 2010. “Climate Impacts of Recent Multidecadal Changes in Atlantic Ocean Sea Surface Temperature: A Multimodel Comparison.” Climate Dynamics 34: 1041—1058.
Jones, P., and I. Harris. 2013. University of East Anglia Climatic Research Unit, CRU TS3. 21: Climatic Research Unit (CRU) Timeseries (TS) Version 3.21 of High Resolution Gridded Data of Month-by-month Variation in Climate (Jan. 1901-Dec. 2012). Harwell Oxford: NCAS British Atmospheric Data Centre.
Kilbourne, K. H., T. M. Quinn, R. Webb, T. Guilderson, J. Nyberg, and A. Winter. 2008. “Paleoclimate Proxy Perspective on Caribbean Climate since the Year 1751: Evidence of Cooler Temperatures and Multidecadal Variability.” Paleoceanography 23: PA3220.
Knight, J. R., C. K. Folland, and A. A. Scaife. 2006. “Climate Impacts of the Atlantic Multidecadal Oscillation.” Geophysical Research Letters 33: L17706.
Knudsen, M. F., M. S. Seidenkrantz, B. H. Jacobsen, and A. Kuijpers. 2011. “Tracking the Atlantic Multidecadal Oscillation through the Last 8,000 Years.” Nature Communications 2: 178.
Kushnir, Y., W. A. Robinson, I. Blade, N. M. J. Hall, S. Peng, and R. Sutton. 2002. “Atmospheric GCM Response to Extratropical SST Anomalies: Synthesis and Evaluation.” Journal of Climate 15: 2233—2256.
Li, S., J. Perlwitz, X. Quan, and M. P. Hoerling. 2008. “Modelling the Infuence of North Atlantic Multidecadal Warmth on the Indian Summer Rainfall.” Geophysical Research Letters 35: L05804.
Liu, Z. 2012. “Dynamics of Interdecadal Climate Variability: A Historical Perspective.” Journal of Climate 25: 1963—1995.
Lu, R., and B. Dong. 2008. “Response of the Asian Summer Monsoon to Weakening of Atlantic Thermohaline Circulation.”Advances in Atmospheric Sciences 25: 723—736.
Lu, R., B. Dong, and H. Ding. 2006. “Impact of the Atlantic Multidecadal Oscillation on the Asian Summer Monsoon.”Geophysical Research Letters 33: L24701.
Marini, C., and C. Frankignoul. 2014. “An Attempt to Deconstruct the Atlantic Multidecadal Oscillation.” Climate Dynamics 43: 607—625.
McCabe, G. J., M. A. Palecki, and J. L. Betancourt. 2004. “Pacifc and Atlantic Ocean Infuences on Multidecadal Drought Frequency in the United States.” Proceedings of the National Academy of Sciences of the United States of America 101: 4136—4141.
Mohino, E., S. Janicot, and J. Bader. 2011. “Sahel Rainfall and Decadal to Multi-decadal Sea Surface Temperature Variability.” Climate Dynamics 37: 419—440.
Nigam, S., B. Guan, and A. Ruiz-Barradas. 2011. “Key Role of the Atlantic Multidecadal Oscillation in 20th Century Drought and Wet Periods over the Great Plains.” Geophysical Research Letters 38: L16713.
Rayner, N. A., D. E. Parker, E. B. Horton, C. K. Folland,L. V. Alexander, D. P. Rowell, E. C. Kent, et al. 2003. “Global Analyses of Sea Surface Temperature, Sea Ice, and Night Marine Air Temperature since the Late Nineteenth Century.”Journal of Geophysical Research: Atmospheres 108. Article No. 4407. doi:10.1029/2002jd002670.
Schubert, S., D. Gutzler, H. Wang, A. Dai, T. Delworth, C. Deser,K. Findell, et al. 2009. “A US CLIVAR Project to Assess and Compare the Responses of Global Climate Models to Drought-related SST Forcing Patterns: Overview and Results.”Journal of Climate 22: 5251—5272.
Sutton, R. T., and D. L. R. Hodson. 2005. “Atlantic Ocean Forcing of North American and European Summer Climate.” Science 309: 115—118.
Takaya, K., and H. Nakamura. 2001. “A Formulation of a Phase-Independent Wave-activity Flux for Stationary and Migratory Quasigeostrophic Eddies on a Zonally Varying Basic Flow.”Journal of the Atmospheric Sciences 58: 608—627.
Ting, M., Y. Kushnir, R. Seager, and C. Li. 2009. “Forced and Internal Twentieth-century SST Trends in the North Atlantic.”Journal of Climate 22: 1469—1481.
Wang, Y. M., S. L. Li, and D. H. Luo. 2009. “Seasonal Response of Asian Monsoonal Climate to the Atlantic Multidecadal Oscillation.” Journal of Geophysical Research-Atmospheres 114: D02112.
Wu, B., T. Zhou, and T. Li. 2016. “Impacts of the Pacifc-Japan and Circumglobal Teleconnection Patterns on Interdecadal Variability of the East Asian Summer Monsoon.” Journal of Climate 29: 3253—3271.
Wu, B., J. Lin, and T. Zhou. 2016. “Interdecadal Circumglobal Teleconnection Pattern during Boreal Summer.” Atmospheric Science Letters 17: 446—452.
Yu, L., Y. Gao, H. Wang, D. Guo, and S. Li. 2009. “The Responses of East Asian Summer Monsoon to the North Atlantic Meridional Overturning Circulation in an Enhanced Freshwater Input Simulation.” Chinese Science Bulletin 54: 4724—4732.
Zhang, R., T. L. Delworth, and I. M. Held. 2007. “Can the Atlantic Ocean Drive the Observed Multidecadal Variability in Northern Hemisphere Mean Temperature?” Geophysical Research Letters 34: L02709.
年代际环球遥相关型; 大西洋多年代际振荡; 大气环流模式
2 May 2016
CONTACT WU Bo wubo@mail.iap.ac.cn
The supplemental data for this article is available online at http://dx.doi.org/10.1080/16742834.2016.1233800.
© 2016 The Author(s). Published by Informa UK Limited, trading as Taylor & Francis Group.
This is an Open Access article distributed under the terms of the Creative Commons Attribution License (http://creativecommons.org/licenses/by/4.0/), which permits unrestricted use, distribution, and reproduction in any medium, provided the original work is properly cited.
杂志排行

Atmospheric and Oceanic Science Letters的其它文章
- The warmest year 2015 in the instrumental record and its comparison with year 1998
- Wind rotation characteristics of the upper tropospheric monsoon over the central and eastern tropical Pacific
- Spatiotemporal characteristics of the sea level anomaly in the Kuroshio Extension using a self-organizing map
- The impacts of different surface boundary conditions for sea surface salinity on simulation in an OGCM
- Does a monsoon circulation exist in the upper troposphere over the central and eastern tropical Pacifc?
- Model analysis of secondary organic aerosol over China with a regional air quality modeling system (RAMS-CMAQ)