Parameterizing an agricultural production model for simulating nitrous oxide emissions in a wheat-maize system in the North China Plain
2016-11-23LITingTingZHANGWeiWANGJunZHANGWenWANGGuoChengXUJingJingndZHANGQing
LI Ting-Ting, ZHANG Wei, WANG Jun, ZHANG Wen, WANG Guo-Cheng, XU Jing-Jingnd ZHANG Qing
aState Key Laboratory of Atmospheric Boundary Layer Physics and Atmospheric Chemistry, Institute of Atmospheric Physics, Chinese Academy of Sciences, Beijing, China;bNansen-Zhu International Research Centre, Institute of Atmospheric Physics, Chinese Academy of Sciences, Beijing,China
Parameterizing an agricultural production model for simulating nitrous oxide emissions in a wheat-maize system in the North China Plain
LI Ting-Tinga, ZHANG Weia, WANG Junb, ZHANG Wena, WANG Guo-Chenga, XU Jing-Jingaand ZHANG Qinga
aState Key Laboratory of Atmospheric Boundary Layer Physics and Atmospheric Chemistry, Institute of Atmospheric Physics, Chinese Academy of Sciences, Beijing, China;bNansen-Zhu International Research Centre, Institute of Atmospheric Physics, Chinese Academy of Sciences, Beijing,China
Concentrations of atmospheric nitrous oxide (N2O), a potent greenhouse gas, have been continuously increasing, and cropland soils are one of the largest sources of N2O. Variations in environmental and anthropogenic factors have substantial impacts on both the frequency and magnitude of N2O emissions. Based on measurements from a wheat—maize system in the North China Plain, the authors parameterized the Agricultural Production Systems Simulator (APSIM) model, which was initially developed in Australia, for simulating N2O emissions under diferent agricultural management practices. After calibrating one of the key parameters — the fraction of N2O lost in nitrifcation (k2) —the results showed that the model successfully captured the daily N2O fuxes under diferent nitrogen fertilization treatments, but underestimated some large peak fuxes. By pooling all data together,the calibrated APSIM model also performed well in representing cumulative N2O emissions under various treatments at annual and fner (monthly and daily) time scales.
ARTICLE HISTORY
Revised 7 June 2016
Accepted 7 June 2016
农田生态系统模拟; 氧化亚氮; 小麦-玉米系统; 华北平原
农田土壤是大气氧化亚氮的一个重要排放源,农田氧化亚氮的排放同时受到气候环境和人为活动的复杂影响。本文基于中国华北平原的一个农田试验站的观测数据,对农业生产模拟器(APSIM)进行参数化,并检验该模型在不同时间尺度上模拟农田氧化亚氮排放的能力。结果表明,对消化系数(k2)进行校正后,模型能够较好地模拟不同时间尺度和不同施肥处理下小麦-玉米系统的土壤氧化亚氮排放,但是对于一些较高的峰值排放模拟效果欠佳。
1. Introduction
Nitrous oxide (N2O) is a potent greenhouse gas that, on the basis of mass, absorbs much more infrared radiation than carbon dioxide and methane. The atmospheric concentrations of N2O increased signifcantly in the last century (from ~275 ppbv in 1900 to ~317 ppbv in 2000),mainly as a result of anthropogenic factors (Mosier and Kroeze 2000). As a highly managed system, cropland soil is one of the largest emitters of N2O at the global scale. In 2010, agriculture was estimated to contribute 70% of global N2O emissions (Olivier, Janssens-Maenhout, and Peters 2012). Cropland soil N2O emissions are determined mainly by microbial processes of nitrifcation and denitrifcation, which are further regulated by agricultural practices, as well as edaphic and climatic conditions (Li 2000;Mosier and Kroeze 2000). For example, Huang et al. (2002)reported that soil texture infuences soil organic matter decomposition rates, thereby potentially regulating the amount of substrates used by microbes to produce N2O. Zheng et al. (2000) reported that soil moisture is also a sensitive factor involved in the regulation of N2O emissions from agricultural soils. Climatic factors such as temperature and precipitation also play an important role in agricultural N2O production (Meng, Cai, and Ding 2005). Additionally,agricultural practices such as nitrogen amendments from fertilizer and manure, cultivation, tillage regime, irrigation,and cropping systems, also tend to alter N2O emission rates(Del Grosso et al. 2009). The complex interactions between agricultural practices and environmental conditions hinder our ability to accurately predict changes in N2O emissions over time and space. The modelling approach enables exploration of the interactions between climate, soil conditions, and management practices as they regulate soil biophysical and biochemical processes. Many process-based models, such as DNDC (Denitrifcation—Decomposition;Li 2000), DAYCENT (daily version of the CENTURY model;Parton et al. 1994), and Agricultural Production Systems Simulator (APSIM; Keating et al. 2003), have been developed and widely used to quantify the efects of environmental and anthropogenic changes on N2O emissions(Thorburn et al. 2010; Cheng et al. 2014; Cui et al. 2014). For simulation outputs to be credible, together with accurate climatic and edaphic observations, detailed information on agricultural management (such as the cropping system, fertilizer application, irrigation, and tillage intensity) is required. In addition, validating the model's performance against feld experimental observations is also an essential prerequisite.
APSIM was developed in Australia for modelling plant and soil processes and has been widely used to study crop productivity, nutrient cycling, and the environmental efects of farming systems as infuenced by climate change and management interventions (van Ittersum, Howden,and Asseng 2003; Luo et al. 2011, 2013). In our previous work, we parameterized the model for simulating crop productivity and soil organic carbon dynamics in the typical upland soils in northern regions of China (Wang et al. 2014,2015). However, the model's performance in simulating N2O emissions has yet to be tested in China's croplands,where nitrogen fertilizers have been intensively applied and the associated N2O emissions are of wide concern (Ju et al. 2009). The aim of the present study was to parameterize APSIM for simulating N2O emissions in a typical wheat—maize system in the North China Plain.
2. Field experiment site description
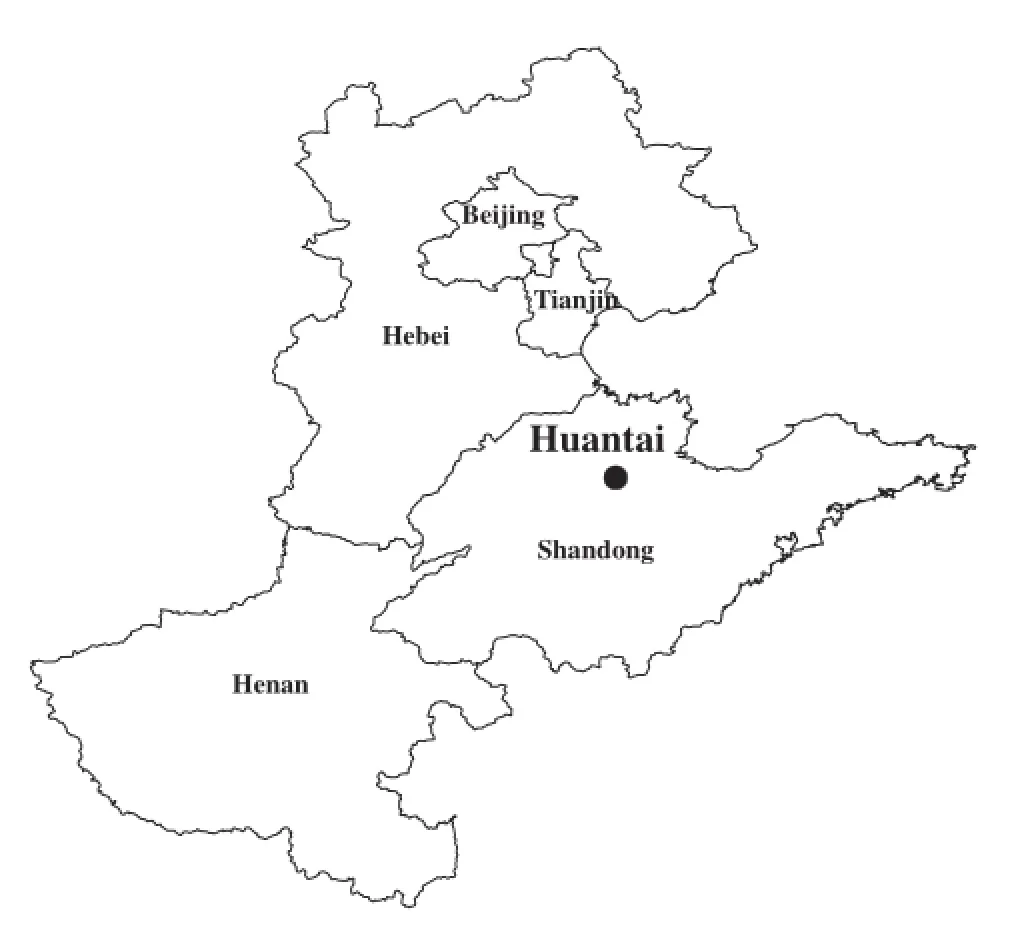
Figure 1.Location of the study site.
A wheat—maize rotation feld experimental site (Figure 1)located in the eastern areas of the North China Plain was selected for this study. The information on climate, soil,agricultural management practices, and annual cumulative N2O emissions were obtained from Cui et al. (2012)and Yan et al. (2013, 2015). The N2O fuxes at fner temporal resolutions (e.g. daily or every 2—3 days) were measured in situ using the closed chamber method The study region has a warm temperate continental monsoon climate, and the mean annual temperature and average annual precipitation are 13.0 °C and 586 mm, respectively (Yan et al. 2015). The soil has a silt—loam texture in the cultivated layer, the initial bulk density was 1.42 g cm-3, and the soil organic carbon and total nitrogen content were 10.28 and 1.05 g kg-1, respectively (Yan et al. 2015). Before the experiment, the region had been cultivated with a double cropping system of winter wheat and summer maize rotation for more than 50 years.
The feld experiment lasted two years following its commencement in October 2008. In total, three nitrogen fertilizer level treatments were arranged as follows: (a) a control treatment without nitrogen application (CK); (b)the farmer's conventional nitrogen dose (CP) of 600 kg N ha-1yr-1(with 45% for wheat and 55% for maize); and(c) the optimal practice with a reduced nitrogen dose(UA), which was 1/3 lower than CP, and recommended by local agronomists (Yan et al. 2015). Under each treatment, three replicate plots (51 m2for each) were randomly chosen within a uniform area that had been cultivated with a wheat—maize rotation system under conventional practices before the experiments (Yan et al. 2013). For the CP and UA treatments, nitrogen fertilization was adopted twice for each crop growing season: around half the amount of nitrogen fertilizer was applied before or immediately after sowing, and the other half during wheat tillering or when maize plants had 11—12 leaves(Cui et al. 2012). In the experiments, topsoil moisture was measured daily with a portable moisture probe (ML2x,ThetaKit, Delta-T Devices, Cambridge, UK). The amount of irrigation water used in each event was manually determined. Under each treatment, static chambers as well as gas chromatography techniques (Wang and Wang 2003)were used to collect air samples for measuring the N2O fuxes (Yan et al. 2013). The normal sampling frequency was once a week during winter and once every three to four days during other seasons. Intensifed daily sampling was carried out following events that were likely to stimulate intensive N2O emissions, such as fertilizer application,irrigation, rainfall, and tillage (Cui et al. 2012). The annual total N2O emissions were calculated by integrating the observed and gap-flled daily fuxes, i.e. daily fuxes of the observational intervals were estimated as the arithmetic means of neighboring data (Yan et al. 2013). More detailed information on the feld experiment can be found in Cui et al. (2012) and Yan et al. (2013, 2015).
3. APSIM model description
APSIM is a biophysical and biochemical model used to study productivity and nutrient cycling of agroecosystems as infuenced by environmental and anthropogenic variations (Keating et al. 2003). APSIM simulates crop growth and soil carbon and nitrogen processes on a daily timescale in response to climate (i.e. temperature, rainfall, and radiation), soil water availability, and soil nutrient status. In the model, direct N2O emissions from the soil are simulated as the sum of N2O emissions from the processes of denitrifcation and nitrifcation. Denitrifcation (Rdenit; units: kg N ha-1d-1) is estimated as a function of the amount of nitrate (NO3; units: kg N ha-1), the concentration of active carbon (CA; units: ppm), soil temperature (T), and moisture(M):

where kdenitis the denitrifcation coefcient, with a default value of 0.0006. N2O emissions from denitrifcation are then estimated as a fraction of total denitrifed nitrogen using the ratio of nitrogen gas (N2) to N2O emitted during denitrifcation. The N2/N2Odenitratio is mainly related to gas difusivity in soil at feld capacity (k1), the nitrate concentration of the soil on a dry weight basis, and the heterotrophic CO2respiration rate (Thorburn et al. 2010). Nitrifcation is determined by Michaelis—Menten kinetics,which is further modifed by soil pH, soil moisture, and temperature. A fraction of the nitrifed nitrogen is emitted as N2O (k2, with a default value of 0.002). A detailed model description can be found in Keating et al. (2003), and the routines involved in N2O emissions from soil are described in Thorburn et al. (2010).
4. Model parameterization
Daily weather data, including maximum and minimum temperatures, precipitation, and radiation, are required as model inputs. The climate data were obtained from the nearest meteorological station (Weifang Station) to the experimental site (http://www.cdc.cma.gov.cn/). The daily radiation was estimated from the daily sunshine duration using the Angström formula (Jones 1992). Soil hydraulic parameters (Figure 2) such as saturated water content, drained upper limit, 15-bar lower limit, and lower limit of crop water extraction, were calculated based on the method of Luo et al. (2011). Using the method of Wang et al. (2015), the total soil carbon content at the start of the experiments was used to initialize the soil carbon pools in APSIM. The fows between various pools were calculated in terms of carbon, and the nitrogen fows were determined based on the carbon to nitrogen ratio of the corresponding pool. The parameters involved in wheat and maize growth were adopted from Wang et al. (2015) because of the similar study region, cropping system, and soil and climate conditions. Following Shi et al. (2013), an equilibrium run forcing the same one-year (2008—09) data was not stopped until the soil carbon pools reached a steady state for the model initialization.
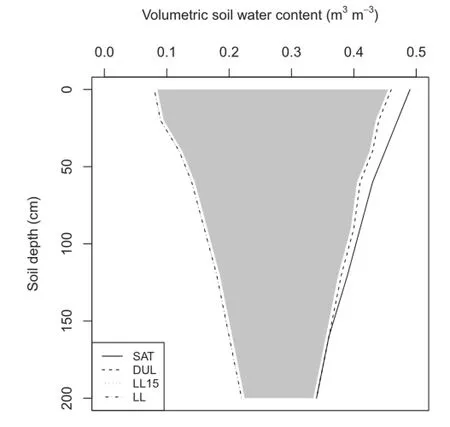
Figure 2.Soil hydraulic parameters at the study site. SAT,saturation water content; DUL, drained upper limit; LL15, 15-bar lower limit; LL, lower limit of crop water extraction. LL is equal to LL15, resulting in the merger of the two lines.
For the processes involved in denitrifcation and nitrifcation, following Thorburn et al. (2010), we set kdenitand k1as the default values, while calibrating k2to obtain the best matches between the model outputs and the observations. This is because, in APSIM, denitrifcation parameters have been optimized against observed data, whereas k2is acknowledged to be soil-specifc (Thorburn et al. 2010). Based on the minimum RMSE method of Cheng et al. (2014), we calculated the RMSE to assess the main diference between the observations and simulations, as follows:
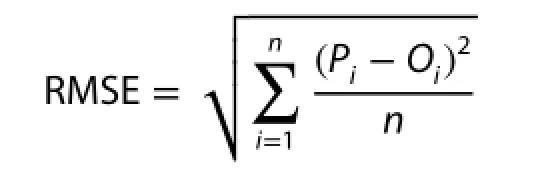
where P and O represent the model estimates and feld measurements, respectivelyis the mean of observed N2O emissions (kg N ha-1yr-1), and n is the total number of observations. By setting an increment of 0.0001 for k2, the model was run for all values of k2within the range 0—0.005. We ultimately obtained a k2value of 0.0023 that resulted in a best match between the observed and predicted N2O emissions. This was acceptable because the fraction of N2Olost in nitrifcation can be adjusted and it normally varies from 0.001 to 0.05 (Goodroad and Keeney 1984).
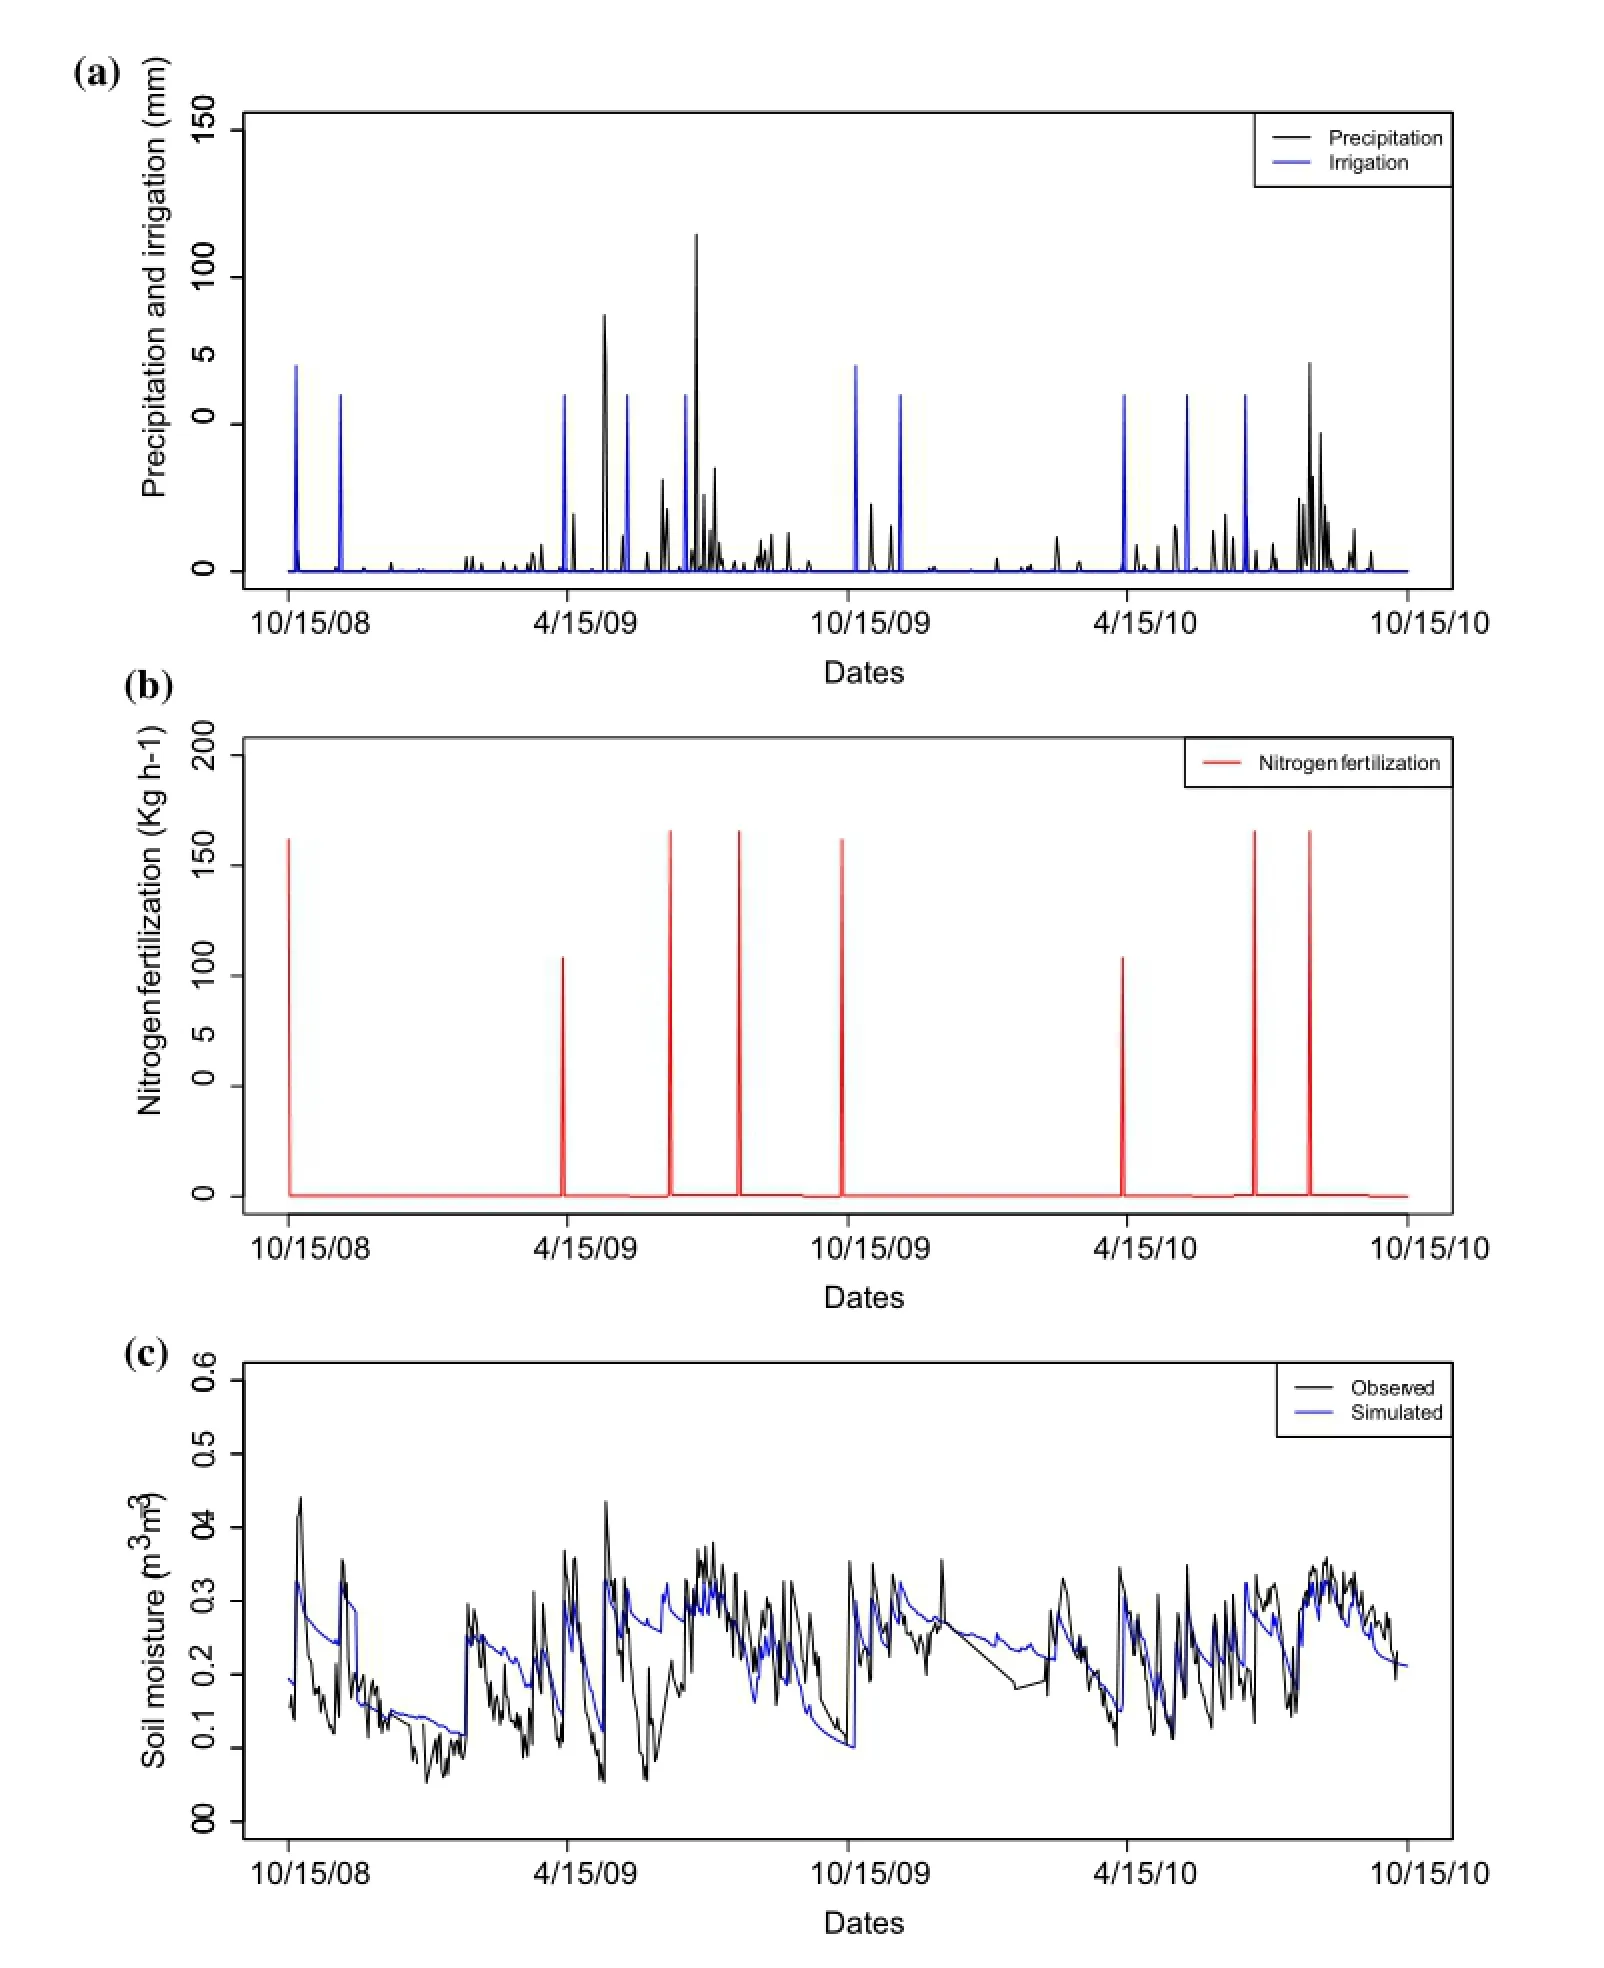
Figure 3.The (a) daily precipitation and amount of irrigation, (b) nitrogen fertilization rates, and (c) observed vs. simulated soil moisture,under the farmer's conventional practice at the Huantai experimental site.
5. Results and discussion
5.1. Model simulation for the wheat-maize system in the North China Plain
We begin by presenting the important environmental controls on N2O fuxes (Figure 3). Figure 3(a) shows the daily precipitation and amount of water irrigation for the study site. Only the nitrogen fertilization rates under the CP treatment were available, which are also presented in Figure 3(b). Since the soil moisture is a direct factor infuencing N2O fuxes, we also compared the seasonal variations of observed and simulated soil moisture (Figure 3(c)). The model generally captured the seasonal variations of soil moisture well, but there were still some discrepancies between daily simulated and observed values (Figure 3(c)).
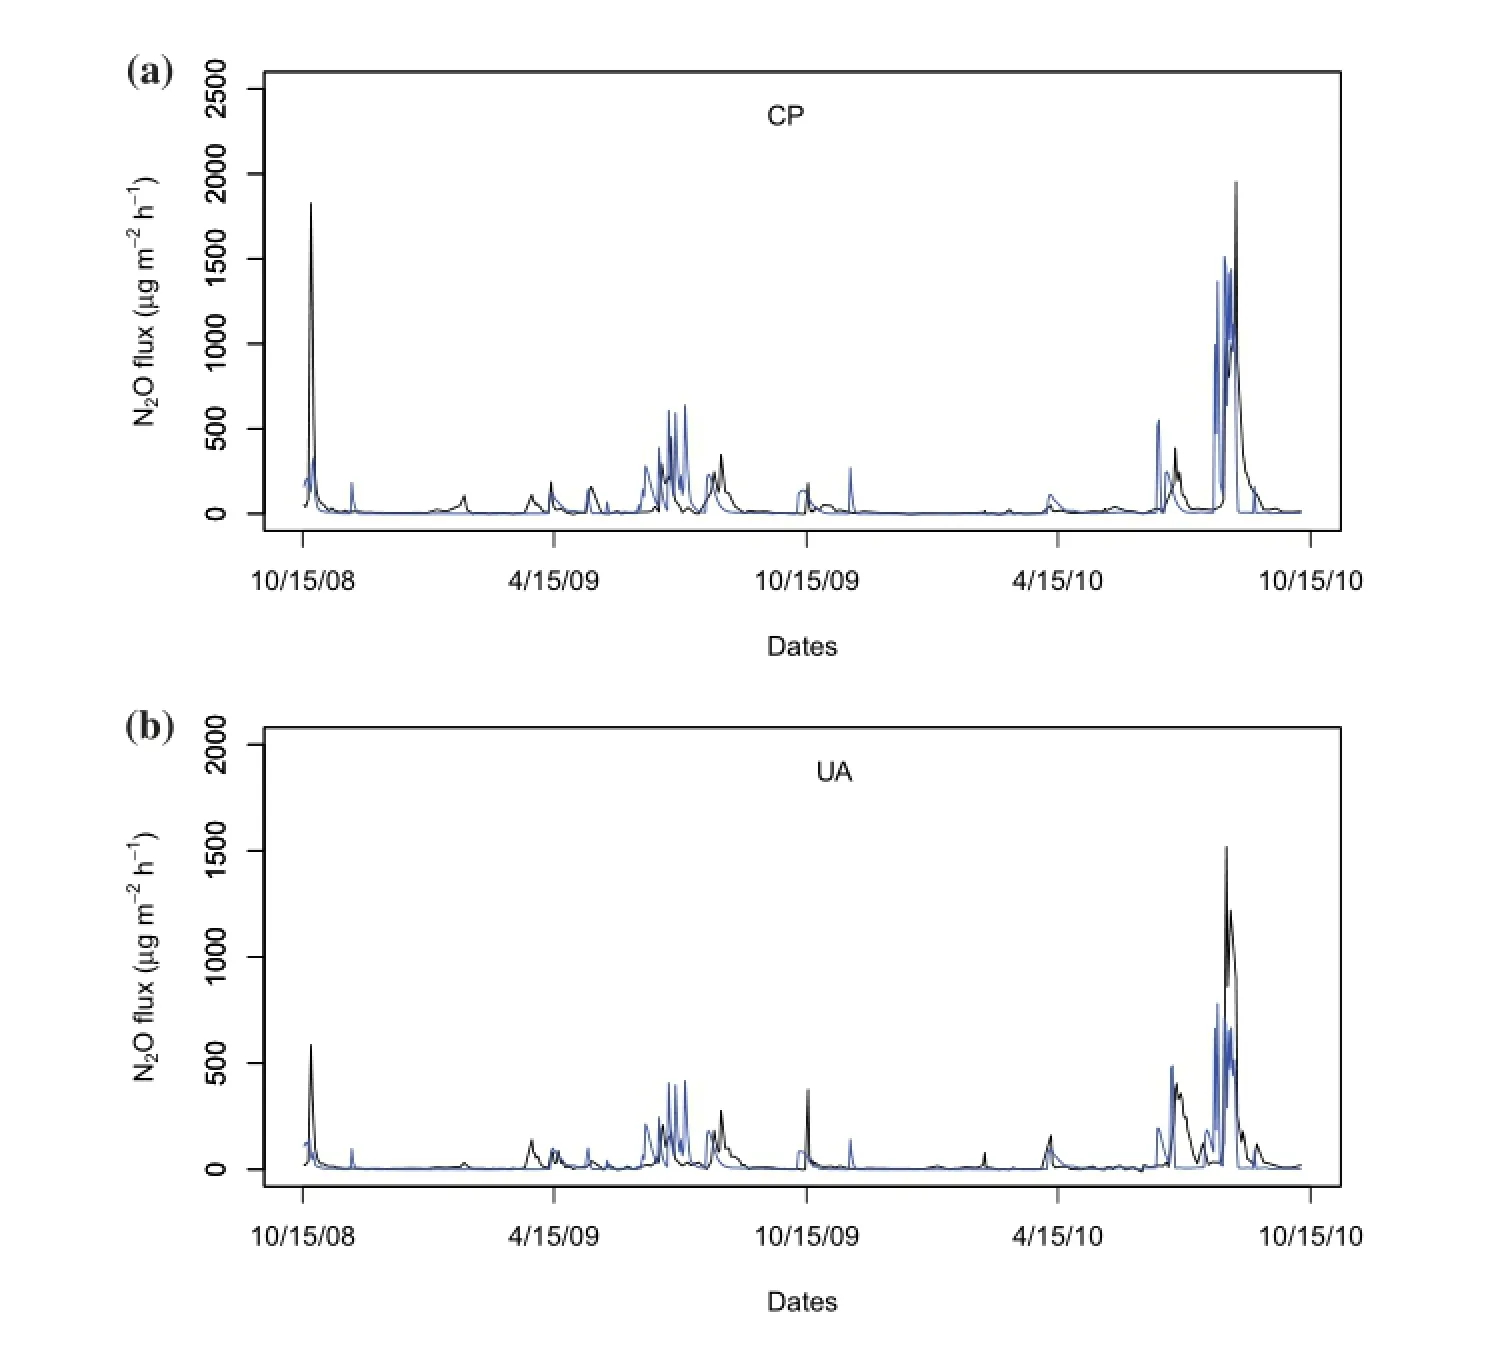
Figure 4.Observed and simulated daily fuxes of N2O from (a) the farmer's conventional nitrogen dose (CP) of 600 kg N ha-1yr-1, and(b) the optimal practice with a reduced nitrogen dose (UA), which was 1/3 lower than the CP treatment, at the Huantai site during 2008—2010.
Additionally, the observed and predicted daily N2O fuxes from October 2008 to October 2010 were compared(Figure 4). The results of the two fertilized treatments, i.e. the farmer's conventional nitrogen dose (CP) of 600 kg N ha-1yr-1and the optimal practice with a reduced nitrogen dose (UA) that was 1/3 lower than the CP, are presented. The observed daily N2O fuxes were highly variable within each rotation under the two treatments (Figure 4). Observed peaks in N2O emissions (Figure 4(a)) usually took place following fertilization, irrigation (especially after fertilizer application), and heavy rainfall (Figures 3(a) and (b)). For example, during late-June 2009 and mid-August 2010,heavy rainfall accompanied the fertilization-induced N2O peaks (Figures 3(a), (b), and 4). This is consistent with the fndings of previous studies, in which it was indicated that nitrogen fertilization and irrigation or heavy rainfall events jointly stimulate much more intensive N2O emissions (Yan et al. 2015). The potential mechanism is that nitrogen fertilization provides a substrate for the processes involved with nitrifcation and denitrifcation; plus, irrigation and precipitation regulate soil moisture (Figure 3(c)), which further afects the activity of nitrifers and denitrifers in producing N2O. The highest fuxes under both the CP and UA treatments were observed during the second maize season, which were induced by heavy rainfall events immediately following urea top-dressing. Compared with observations, APSIM generally captured the temporal pattern of daily N2O fuxes quite well, although it underestimated the peak N2O fuxes caused by irrigation following fertilization in October 2008 for both treatments (Figure 4). Overall, the results shown in Figure 4 indicate that the model was able to simulate the N2O fuxes over time.
By confguring APSIM with detailed observations of soil, climate, and agricultural management, the model performed well in reproducing the annual cumulative N2O emissions under the CK, CP, and UA treatments when all data were pooled together (Figure 5(a)). The model simulation resulted in an R2(a widely used goodness-of-ft measure that ranges from 0 to 1 where 1 represents a perfect ft) and RMSE value of 0.74 and 0.95 kg ha-1, respectively,in terms of annual N2O emissions. These results indicate that the model performs well in representing the annual cumulative N2O emissions under diferent treatments of nitrogen fertilization. Figure 5(b) shows the modeled vs. observed N2O emissions at the monthly scale during the study period. In general, the calibrated APSIM model was also able to reasonably represent the monthly cumulative N2O emissions under diferent nitrogen fertilization treatments (R2= 0.79; RMSE = 0.28 kg ha-1). On the daily timescale (Figure 5(c)), negative biases existed between the modeled and observed N2O fuxes, especially for the peak fuxes. The regression between the simulated and observed daily N2O fuxes resulted in an R2value of 0.34,with a slope of 0.45 and an intercept of 0.01 kg ha-1. The RMSE between the daily simulated and observed values was 0.04 kg ha-1.
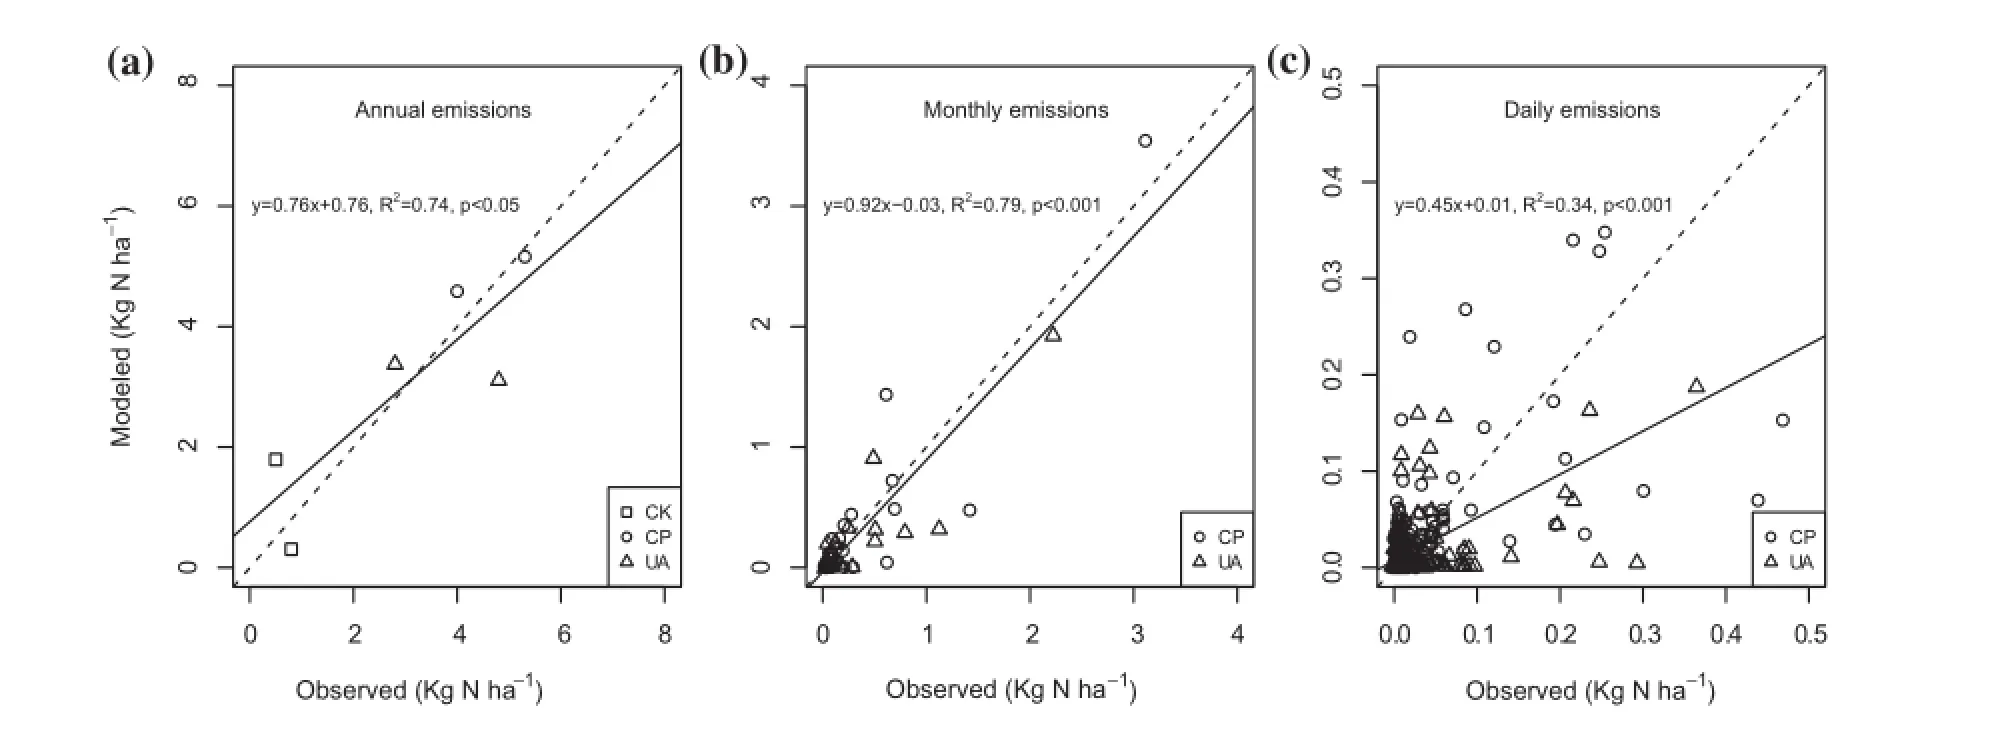
Figure 5.Comparison of observed and simulated (a) annual, (b) monthly and (c) daily cumulative N2O emissions under diferent treatments from the wheat—maize rotation cropping system at Huantai site during the study period of 2008—2010.
In general, although there were some discrepancies between the daily modeled and observed fuxes, the model was generally able to simulate the annual N2O emissions under diferent conditions. Thus, it may also be applicable to larger regions with similar cropping systems,soil and climate conditions across the agroecosystems in the North China Plain.
5.2. Limitations and future needs
In simulating agricultural soil N2O emissions, the APSIM model does possess some shortcomings that should be noted when interpreting our results. First, the model underestimated some peak N2O fuxes compared with observations (Figure 4). In fact, this is a common problem in this feld (Smith et al. 2008; Chirinda et al. 2011; Lehuger et al. 2011; Bell et al. 2012; Cui et al. 2014; Zhang et al. 2015). For example, DNDC, Landscape DNDC and IAP-NGAS also cannot capture N2O peaks for croplands in China(Figure 6 in Cui et al. 2014; Zhang et al. 2015; Figure 3). A similar pattern in the comparison between simulated and observed daily N2O fuxes was also shown in Bell et al.(2012), who used the ECOSSE model to simulate N2O emissions from a maize—wheat—barley crop rotation system(compare Figure 5(c) in this study and Figure 5(a) in Bell et al. (2012)). In Lehuger et al. (2011), the CERES-EGC model signifcantly underestimated the N2O peaks at a European cropland site. The reasons for the low capability of present models in capturing N2O dynamics have been discussed in previous studies (Zhang et al. 2015). Firstly, both the quantity and activity of soil microbes involved in the processes of nitrifcation and denitrifcation may difer under diferent environmental conditions, and yet this aspect is not included in most process-based models, including APSIM. Secondly, models refect the knowledge gap with respect to the complex interactions among the soil moisture content, organic matter decomposition, and soil nitrogen availability (Zhang et al. 2015). This is a challenging line of enquiry for model modifcations and development in the future. Incorporating a module involving soil microbe quantities and activity, and advancing model capacity to better represent the complex interactions among soil moisture, organic matter decomposition and soil nitrogen availability, may help to fll this gap. As a result, the efects of events connected with soil N2O production still need to be explicitly addressed in future research, in order to better simulate N2O fuxes under diferent conditions of environmental and anthropogenic change.
Secondly, the model also yielded some small peak fuxes that were not observed (Figure 4). This may have been due to the inadequate air sampling frequency and intense observations only having been carried out following events that were likely to stimulate intensive N2O emissions (Cui et al. 2012). Therefore, intensifed air sampling on a daily basis throughout the study period is a necessary step in future feld experiments.
Although discrepancies existed in the magnitudes of some peak N2O emissions (Figure 4), the process-based model successfully captured the temporal pattern of daily N2O emissions (Figure 4) and accumulative N2O emissions at both annual and monthly scales (Figure 5). This indicates the importance of process-based modeling approaches,because quantifcations of N2O emissions and mitigation potential on relatively large spatial and temporal scales are a key concern in both scientifc and political spheres.
6. Conclusion
N2O emissions are highly dependent on environmental changes (e.g. heavy rainfall) and anthropogenic factors such as fertilizer application, irrigation, and tillage. The parameterized APSIM model captured the daily N2O fuxeswell under diferent nitrogen fertilization treatments in a wheat—maize system in the North China Plain, but underestimated some peak fuxes. By pooling all data together,the model performed well in reproducing the cumulative N2O emissions under various treatments at annual,monthly, and daily scales.
Disclosure statement
No potential confict of interest was reported by the authors.
Funding
This research was supported by the National Natural Science Foundation of China [grant number 41590875].
References
Bell, M., E. Jones, J. Smith, P. Smith, J. Yeluripati, J. Augustin, R. Juszczak, J. Olejnik, and M. Sommer. 2012. “Simulation of Soil Nitrogen, Nitrous Oxide Emissions and Mitigation Scenarios at 3 European Cropland Sites Using the ECOSSE Model.”Nutrient Cycling in Agroecosystems 92 (2): 161—181.
Cheng, K., S. M. Ogle, W. J. Parton, and G. Pan. 2014. “Simulating Greenhouse Gas Mitigation Potentials for Chinese Croplands Using the DAYCENT Ecosystem Model.” Global Change Biology 20 (3): 948—962.
Chirinda, N., D. Kracher, M. Lægdsmand, J. R. Porter, J. E. Olesen,B. M. Petersen, J. Doltra, R. Kiese, and K. Butterbach-Bahl. 2011. “Simulating Soil N2O Emissions and Heterotrophic CO2Respiration in Arable Systems Using FASSET and MoBiLEDNDC.” Plant and Soil 343 (1—2): 139—160.
Cui, F., G. Yan, Z. Zhou, X. Zheng, and J. Deng. 2012. “Annual Emissions of Nitrous Oxide and Nitric Oxide from a Wheat—Maize Cropping System on a Silt Loam Calcareous Soil in the North China Plain.” Soil Biology and Biochemistry 48: 10—19.
Cui, F., X. Zheng, C. Liu, K. Wang, Z. Zhou, and J. Deng. 2014.“Assessing Biogeochemical Efects and Best Management Practice for a Wheat—Maize Cropping System Using the DNDC Model.” Biogeosciences 11 (1): 91—107.
Del Grosso, S. J., D. S. Ojima, W. J. Parton, E. Stehfest, M. Heistemann, B. DeAngelo, and S. Rose. 2009. “Global Scale DAYCENT Model Analysis of Greenhouse Gas Emissions and Mitigation Strategies for Cropped Soils.” Global and Planetary Change 67 (1): 44—50.
Goodroad, L., and D. Keeney. 1984. “Nitrous Oxide Production in Aerobic Soils under Varying PH, Temperature and Water Content.” Soil Biology and Biochemistry 16 (1): 39—43.
Huang, Y., S. L. Liu, Q. R. Shen, and L. G. Zong. 2002. “Model Establishment for Simulating Soil Organic Carbon Dynamics.”Agricultural Sciences in China 1 (3): 307—312.
van Ittersum, M., S. Howden, and S. Asseng. 2003. “Sensitivity of Productivity and Deep Drainage of Wheat Cropping Systems in a Mediterranean Environment to Changes in CO2,Temperature and Precipitation.” Agriculture, Ecosystems & Environment 97 (1—3): 255—273.
Jones, H. G. 1992. Plants and Microclimate: A Quantitative Approach to Environmental Plant Physiology. Cambridge: Cambridge University Press.
Ju, X. T., G. X. Xing, X. P. Chen, S. L. Zhang, L. J. Zhang, X. J. Liu, Z. L. Cui,B. Yin, P. Christie, and Z. L. Zhu. 2009. “Reducing Environmental Risk by Improving N Management in Intensive Chinese Agricultural Systems.” Proceedings of the National Academy of Sciences of the United States of America 106 (9): 3041—3046.
Keating, B., P. Carberry, G. Hammer, M. Probert, M. Robertson, D. Holzworth, N. Huth, J. Hargreaves, H. Meinke, and Z. Hochman. 2003. “An Overview of APSIM, a Model Designed for Farming Systems Simulation.” European Journal of Agronomy 18 (3—4): 267—288.
Lehuger, S., B. Gabrielle, P. Laville, M. Lamboni, B. Loubet, and P. Cellier. 2011. “Predicting and Mitigating the Net Greenhouse Gas Emissions of Crop Rotations in Western Europe.”Agricultural and Forest Meteorology 151 (12): 1654—1671.
Li, C. 2000. “Modeling Trace Gas Emissions from Agricultural Ecosystems.” Nutrient Cycling in Agroecosystems 58 (1—3): 259—276.
Luo, Z., E. Wang, B. A. Bryan, D. King, G. Zhao, X. Pan, and U. Bende-Michl. 2013. “Meta-modeling Soil Organic Carbon Sequestration Potential and Its Application at Regional Scale.”Ecological Applications 23 (2): 408—420.
Luo, Z., E. Wang, O. J. Sun, C. J. Smith, and M. E. Probert. 2011. “Modeling Long-term Soil Carbon Dynamics and Sequestration Potential in Semi-arid Agro-Ecosystems.”Agricultural and Forest Meteorology 151: 1529—1544.
Meng, L., Z. Cai, and W. Ding. 2005. “Carbon Contents in Soils and Crops as Afected by Long-term Fertilization.” Acta Pedologica Sinica 42 (5): 769—776.
Mosier, A., and C. Kroeze. 2000. “Potential Impact on the Global Atmospheric N2O Budget of the Increased Nitrogen Input Required to Meet Future Global Food Demands.”Chemosphere-Global Change Science 2 (3): 465—473.
Olivier, J. G., G. Janssens-Maenhout, and J. A. Peters. 2012. Trends in Global CO2 Emissions: 2012 Report. The Hague: PBL Netherlands Environmental Assessment Agency.
Parton, W. J., D. Schimel, D. Ojima, C. V. Cole, R. Bryant, and R. Arnold. 1994. “A General Model for Soil Organic Matter Dynamics: Sensitivity to Litter Chemistry, Texture and Management.” Quantitative modeling of soil forming processes: proceedings of a symposium sponsored by Divisions S-5 and S-9 of the Soil Science Society of America in Minneapolis, Minnesota, USA, November 2, 1992. Soil Science Society of America.
Shi, M., Z. L. Yang, D. M. Lawrence, R. E. Dickinson, and Z. M. Subin. 2013. “Spin-up Processes in the Community Land Model Version 4 with Explicit Carbon and Nitrogen Components.”Ecological Modelling 263: 308—325.
Smith, W. N., B. B. Grant, R. L. Desjardins, P. Rochette, C. F. Drury,and C. Li. 2008. “Evaluation of Two Process-based Models to Estimate Soil N2O Emissions in Eastern Canada.” Canadian Journal of Soil Science 88: 251—260.
Thorburn, P. J., J. S. Biggs, K. Collins, and M. Probert. 2010.“Using the APSIM Model to Estimate Nitrous Oxide Emissions from Diverse Australian Sugarcane Production Systems.”Agriculture, Ecosystems & Environment 136 (3): 343—350.
Wang, Y. S., and Y. H. Wang. 2003. “Quick Measurement of CH4,CO2and N2O Emissions from a Short-plant Ecosystem.”Advanced Atmosphere Sciences 20: 842—844.
Wang, G., E. Wang, Y. Huang, and J. Xu. 2014. “Soil Carbon Sequestration Potential as Afected by Management Practices in Northern China: A Simulation Study.” Pedosphere 24 (4): 529—543.
Wang, G., J. Xu, T. Li, and W. Zhang. 2015. “Spatiotemporal Changes in Agricultural Soil Organic Carbon across the North China Plain during 1980—2010.” Climatic and Environmental Research 20 (5): 491—499. (in Chinese).
Yan, G., X. Zheng, F. Cui, Z. Yao, Z. Zhou, J. Deng, and Y. Xu. 2013.“Two-year Simultaneous Records of N2O and NO Fluxes from a Farmed Cropland in the Northern China Plain with a Reduced Nitrogen Addition Rate by One-third.” Agriculture,Ecosystems & Environment 178: 39—50.
Yan, G., Z. Yao, X. Zheng, and C. Liu. 2015. “Characteristics of Annual Nitrous and Nitric Oxide Emissions from Major Cereal Crops in the North China Plain under Alternative Fertilizer Management.”Agriculture Ecosystems & Environment 207: 67—78.
Zhang, W., C. Y. Liu, X. H. Zheng, Z. X. Zhou, F. Cui, B. Zhu, E. Haas,S. Klatt, K. Butterbach-Bahl, and R. Kiese. 2015. “Comparison of the DNDC, LandscapeDNDC and IAP-N-GAS Models for Simulating Nitrous Oxide and Nitric Oxide Emissions from the Winter Wheat—Summer Maize Rotation System.” Agricultural Systems 140: 1—10.
Zheng, X., M. Wang, Y. Wang, R. Shen, J. Gou, J. Li, J. Jin, and L. Li. 2000. “Impacts of Soil Moisture on Nitrous Oxide Emission from Croplands: A Case Study on the Rice-Based Agroecosystem in Southeast China.” Chemosphere-Global Change Science 2 (2): 207—224.
Agricultural production modeling; nitrous oxide;wheat—maize system; North China Plain
21 March 2016
CONTACT WANG Guo-Cheng wanggc@mail.iap.ac.cn
© 2016 The Author(s). Published by Informa UK Limited, trading as Taylor & Francis Group.
This is an Open Access article distributed under the terms of the Creative Commons Attribution License (http://creativecommons.org/licenses/by/4.0/), which permits unrestricted use, distribution, and reproduction in any medium, provided the original work is properly cited.
猜你喜欢
杂志排行

Atmospheric and Oceanic Science Letters的其它文章
- Response of fne particulate matter to reductions in anthropogenic emissions in Beijing during the 2014 Asia-Pacifc Economic Cooperation summit
- Contrasting two spring SST predictors for the number of western North Pacific tropical cyclones
- The impact of solar activity on the 2015/16 El Niño event
- Quantifying the attribution of model bias in simulating summer hot days in China with IAP AGCM 4.1
- Model analysis of secondary organic aerosol over China with a regional air quality modeling system (RAMS-CMAQ)
- Is the interdecadal circumglobal teleconnection pattern excited by the Atlantic multidecadal Oscillation?