Analysis of ‘9.4’ unusual rainfall in Beijing during autumn 2015
2016-11-23ZHAOSiXiongSUNJinHubndLURong
ZHAO Si-Xiong, SUN Jin-Hu,bnd LU Rong,c
aKey Laboratory of Cloud-Precipitation Physics and Severe Storms, Institute of Atmospheric Physics, Chinese Academy of Sciences, Beijing,China;bCollaborative Innovation Center on Forecast and Evaluation of Meteorological Disasters, Nanjing University of Information Science and Technology, Nanjing, China;cCollege of Earth Science, University of Chinese Academy of Sciences, Beijing, China
Analysis of ‘9.4’ unusual rainfall in Beijing during autumn 2015
ZHAO Si-Xionga, SUN Jian-Huaa,band LU Ronga,c
aKey Laboratory of Cloud-Precipitation Physics and Severe Storms, Institute of Atmospheric Physics, Chinese Academy of Sciences, Beijing,China;bCollaborative Innovation Center on Forecast and Evaluation of Meteorological Disasters, Nanjing University of Information Science and Technology, Nanjing, China;cCollege of Earth Science, University of Chinese Academy of Sciences, Beijing, China
In this paper, an unusual rainfall in Beijing that occurred on 4 September (‘9.4') 2015 is studied to clarify the reasons for such a strong rainfall in autumn. It was indicated that various factors, including stationary westerlies disturbance (i.e. low in the west and high in the east), forward-titling trough,warm shear line, unstable stratifcation and convective available potential energy release, low level jet as well as a series of mesoscale convective systems produced the strong rainfall. Ordinarily, this situation is uncommon in autumn.
ARTICLE HISTORY
Revised 15 February 2016
Accepted 22 February 2016
Heavy rainfall; forward-titling trough; warm shear line;
autumn; Beijing
1. Introduction
The rainy season of the Beijing area is concentrated mainly in summer, especially in late July and early August. After mid-August, the rainfall decreases gradually even though some light rainfall may still appear. Typically, it is clear and warm in Beijing during autumn, a period that has been called ‘clear and crisp autumn air' (‘Qiu Gao Qi Shuang' in Chinese) and ‘autumn tiger' when it approaches above normal temperatures. In North America, such weather has been called ‘Indian Summer', which describes a period of unseasonably warm, dry weather with above normal temperatures occurring in autumn (Matthews 1902). Similar weather conditions, with local variations, also exist in other places throughout the world. Primarily, there is less precipitation in autumn than in the other seasons.
Research on summer precipitation systems in Beijing has been conducted (Tao 1980; Ding et al. 1980; Sun et al. 2005, 2013; Zhao and Sun 2013). It was found that precipitation systems in Beijing in summer can be divided into six categories (Tao 1980): short wave trough and cold front, vortex, warm shear line, cyclone, inverse trough of typhoon, and typhoon (especially the interaction between middle-lower latitude systems). They are quite diferent from the band-shaped precipitation area of the Meiyu front in the Yangtze River Valley and the stationary front in South China, with circulation of zonal westerlies with fast-moving and small amplitude troughs resulting in the frequent weather changes observed in Beijing in autumn and the light rain and moderate rain that can sometimes be found when a trough with a cold front passes. From 0100 UTC 4 to 0900 UTC 5 September 2015, average precipitation amounts of 55.3 mm in the Beijing region and 67.7 mm in its urban area were reported. Among them,the accumulated precipitation amounts from 26 stations were larger than 100 mm, with the largest one being 179.5 mm in Xiangshan, Beijing (Figure 1). Therefore, this was an uncommon precipitation event during autumn. Special attention was paid to the weather systems during early September 2015 because a formal parade took place in Beijing's Tiananmen Square on 3 September 2015. Fortunately, the weather was fne on the 3rd of September because an upper level ridge predominated over Beijing,and just one day later, on 4 September, the strong rainfall occurred. What caused the changes in weather from 3 September to 4 September 2015? The scientifc questions should be clarifed.
2. Data and methodology
In this study, the National Centers for Environmental Prediction (NCEP) climate forecast system reanalysis data (Saha et al. 2010) were used to analyze the synoptic weather pattern and to calculate the thermodynamic characteristics, such as moisture fux and divergence of moisture fux. This data-set had a horizontal resolution of 0.5° × 0.5° and a temporal interval of 6 h. Three-hourly surface observations and 12-hourly upper air soundings from the Chinese Meteorological Administration were used to analyze the surface system and to evaluate the evolution at atmospheric stratifcation and convective energy over Beijing. In addition, the Doppler radar echoes and hourlyprecipitation amounts were analyzed to further reveal the characteristics of the mesoscale systems.
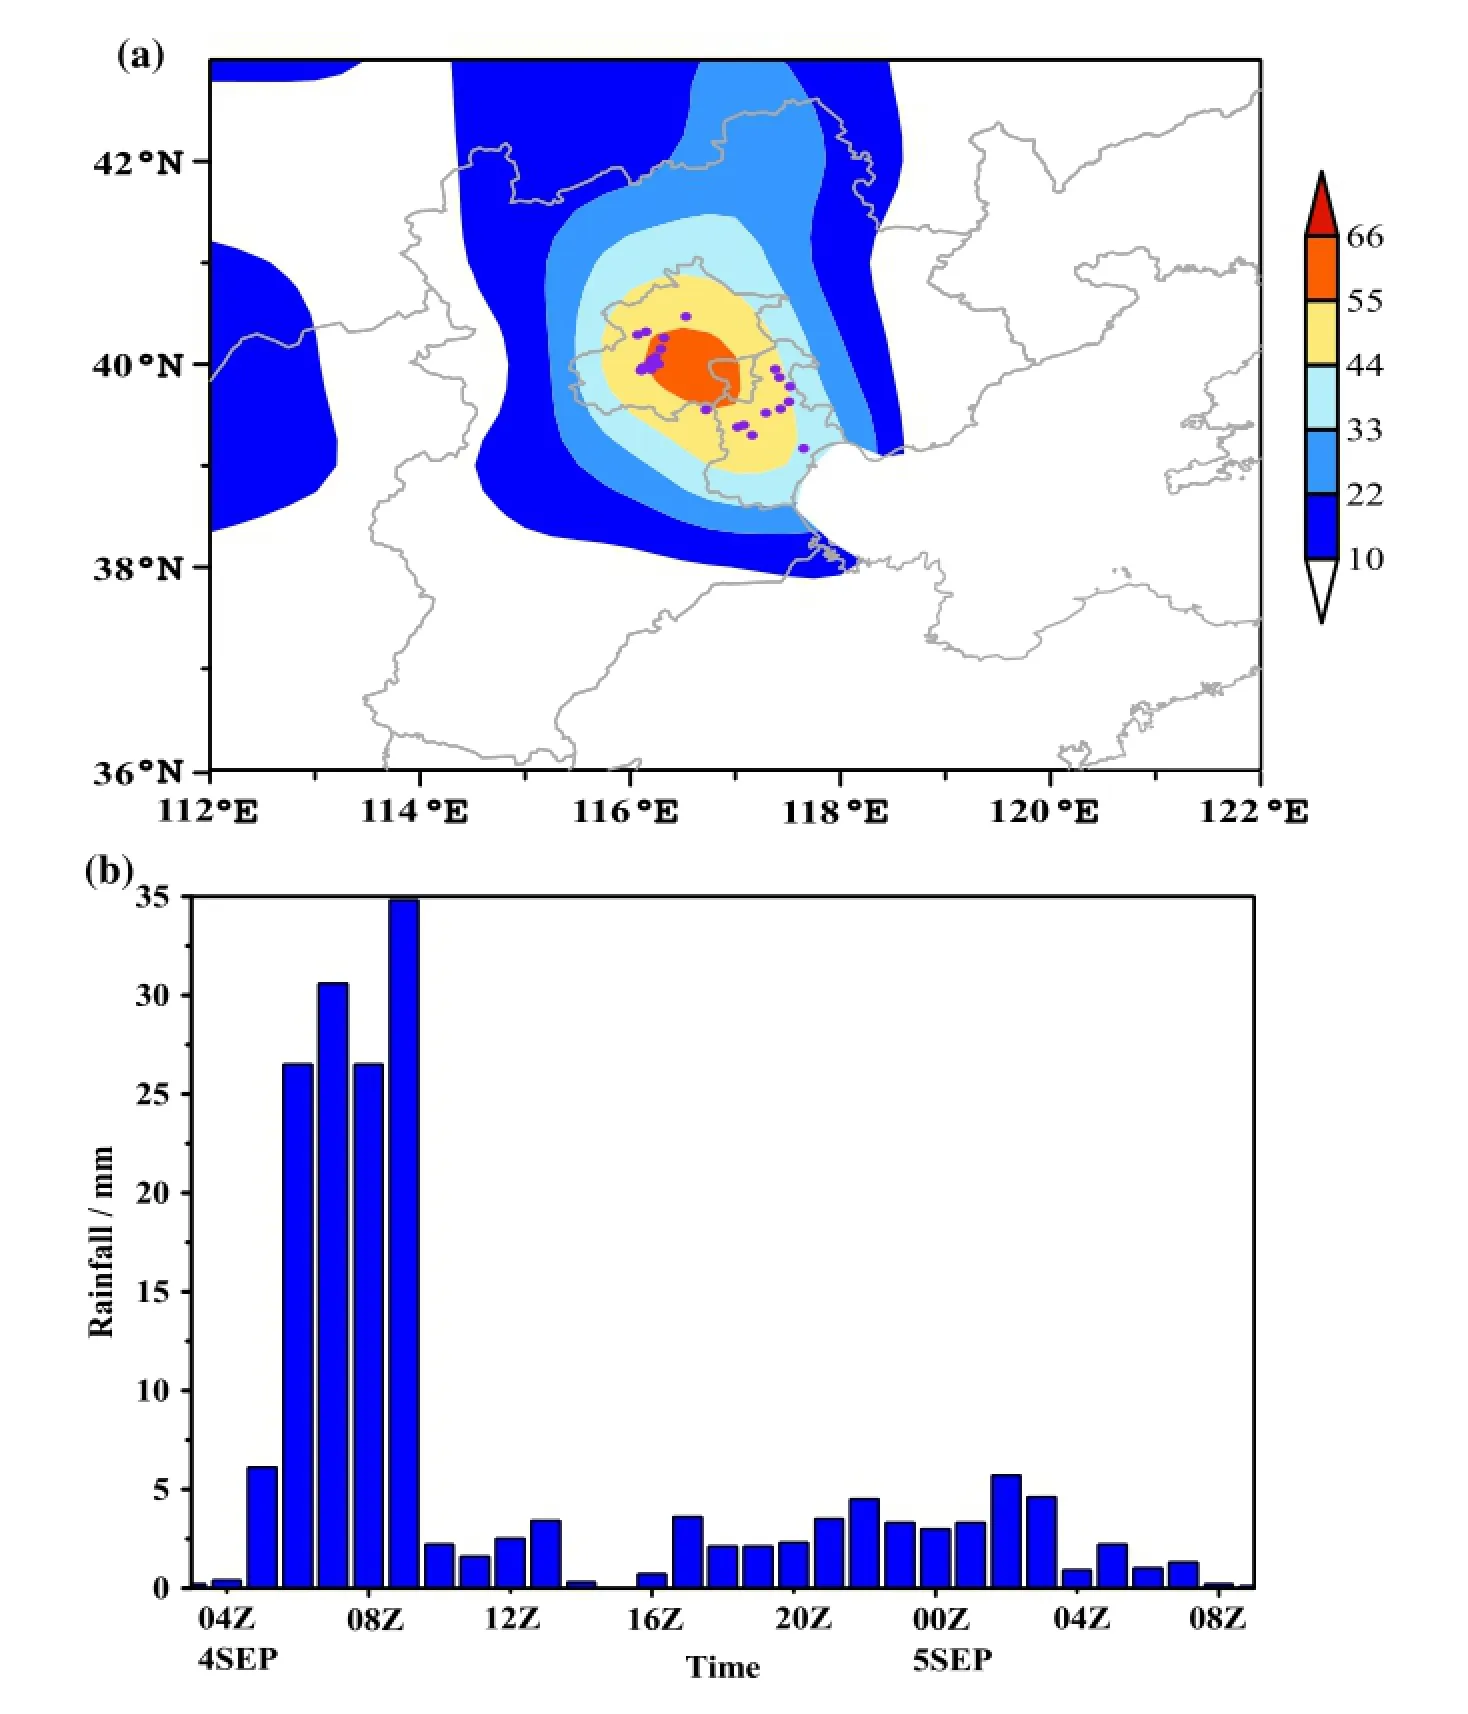
Figure 1.(a) Precipitation amount of automatic weather stations from 0000 UTC 4 to 0000 UTC 5 September 2015 (units: mm). Precipitation amounts larger than 10 mm are shaded and the purple dots represent precipitation amounts larger than 100 mm. (b)Hourly precipitation amount at Xiangshan, Beijing (units: mm).
3. Main results
3.1. Slowly moving-short wave trough
From the weather charts and surface map, it can be observed that the strong autumn precipitation appeared in a background of unusual atmospheric circulation, which corresponded with the ‘high in the east and low in the west' pattern of westerlies. ‘Low in the west' was a short trough slowed and stopped by the ‘high ridge' in the east(Figure 2). Generally speaking, there was a zonal westerly with small amplitude waves that may produce the light rain. In this case, a small ridge was east of Beijing, and the short trough was west of the ridge, at 500 hPa (Figure 2). This pattern was very favorable to the slow-moving of the trough (Ding et al. 1980; Sun et al. 2013) and even stopped it. Beijing was ahead of the 500 hPa trough where conditions were suitable for maintenance of ascending during a longer period. In addition, it can be seen that a 700-hPa low was near the boundary between Mongolia and China, northwest of the Great Bend of the Huanghe River (Figure 2). Although the low was somewhat far from Beijing, one trough on it extended southeastward to Beijing. The trough has more direct impact on Beijing than the low. Additionally, Beijing was also ahead of the trough at 700 hPa. However, it can be seen that the trough was a forward-tilting trough, which is defned by a trough line in the upper level located to the east of the trough line in the lower level. Therefore, the cold air behind the upper trough line moves fast and overlays the warm air ahead of the lower trough line. In this situation, the atmospheric stratifcation changes, stability decreases, and the conditionsbecome favorable for the formation and development of convective systems.
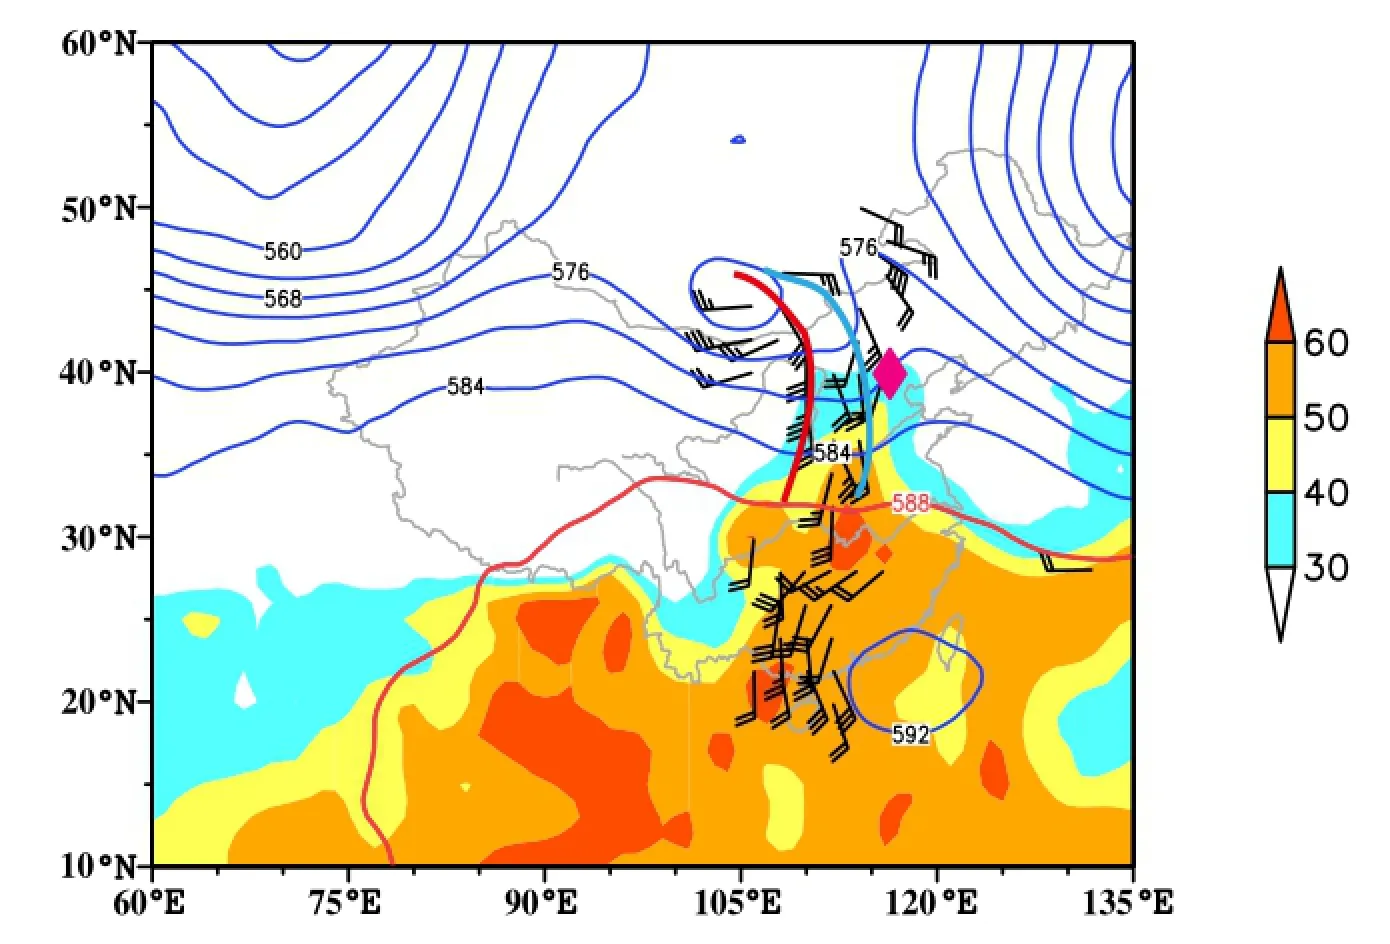
Figure 2.Geopotential height at 500 hPa (units: dagpm) and wind feld greater than 8 m s-1at 850 hPa (full bar: 4 m s-1), 0000 UTC 4 September 2015.
3.2. Warm shear line in lower layers
In addition, it should be emphasized that during this strong precipitation in Beijing, a warm shear line existed in the lower troposphere. This kind of shear line can sometimes be seen in East Asia, especially in East China. While it is one of the more important systems in China during summer, few can be detected in autumn. Unlike the warm conveyor belts in Europe and North America, a warm shear line with a weak temperature gradient is diferent from the typical warm front because it is below 850 hPa at most and has a short life cycle. It is sometimes difcult to detect warm shear lines in comparison with warm fronts. Nevertheless, the warm shear line in this case was clearly apparent and was, indeed,related to the strong precipitation. Moreover, a warm shear line can provide not only the favorable environment but also the possible trigger mechanism for strong rainfall. In China, summer warm shear lines have been noticed by some scientists (You 1965; Guo 1977; Hu and Peng 1996;Zhang et al. 2007), as well as those occurring in spring (Liu et al. 2015). Cases in autumn have not been reported in the literature. In our ‘9.4' case, it can be observed that one continental high combined and merged with another small high to the south of it, which induced the shear line between the southeast and southwest winds. The warm shear line appeared in south Hebei Province at 2300 UTC 3 September(fgure not shown), and it approached to Beijing at 0600 UTC 4 September (Figure 3). On the other hand, the cold air from North China is also important. A current of cold air came down along Taihang Mountain southward, where the warm current to the east of the cold current pushed northward to Beijing through Hebei Province (fgure not shown). A remarkable interaction occurred between the cold and warm air.
3.3. Low level jet and rich water vapor supply
In summer, moisture from the south contributes signifcantly to Beijing's precipitation, especially during strong,heavy rain (Wang 1974). Why was the rainfall in autumn of 2015 so strong? Moisture supply should be investigated in detail. It can be seen from Figure 2 that a strong 850-hPa low level jet (LLJ) extended from South China, passed the Yangtze River Valley and North China, and approached Beijing. Precipitable water was approximately 30 mm near Beijing, and in the LLJ upstream area at the Yangtze River Valley, it was even up to ~50 mm.
To further clarify the water vapor impact, the transportation ability as well as the moisture supply ability were discussed. Thus, the moisture flux and divergence of moisture flux were calculated. As shown in Figure 4, a maximum band (larger than 40 × 10-2kg s-1m-1) extended directly from South China to Beijing, just like a water pipe transporting rich water vapor to North China. The moisture accumulated in the Hebei Province and Beijing and caused strong rainfall as long as it was triggered. Indicationsshowed similarities to the ‘7.21' case (Sun et al. 2013),in which the interaction between middle-lower latitude systems seemed to exist. However, the ‘9.4' case was not accompanied by tropical disturbance and typhoon, and the precipitation amount was weaker than that of the recorded ‘7.21' case.
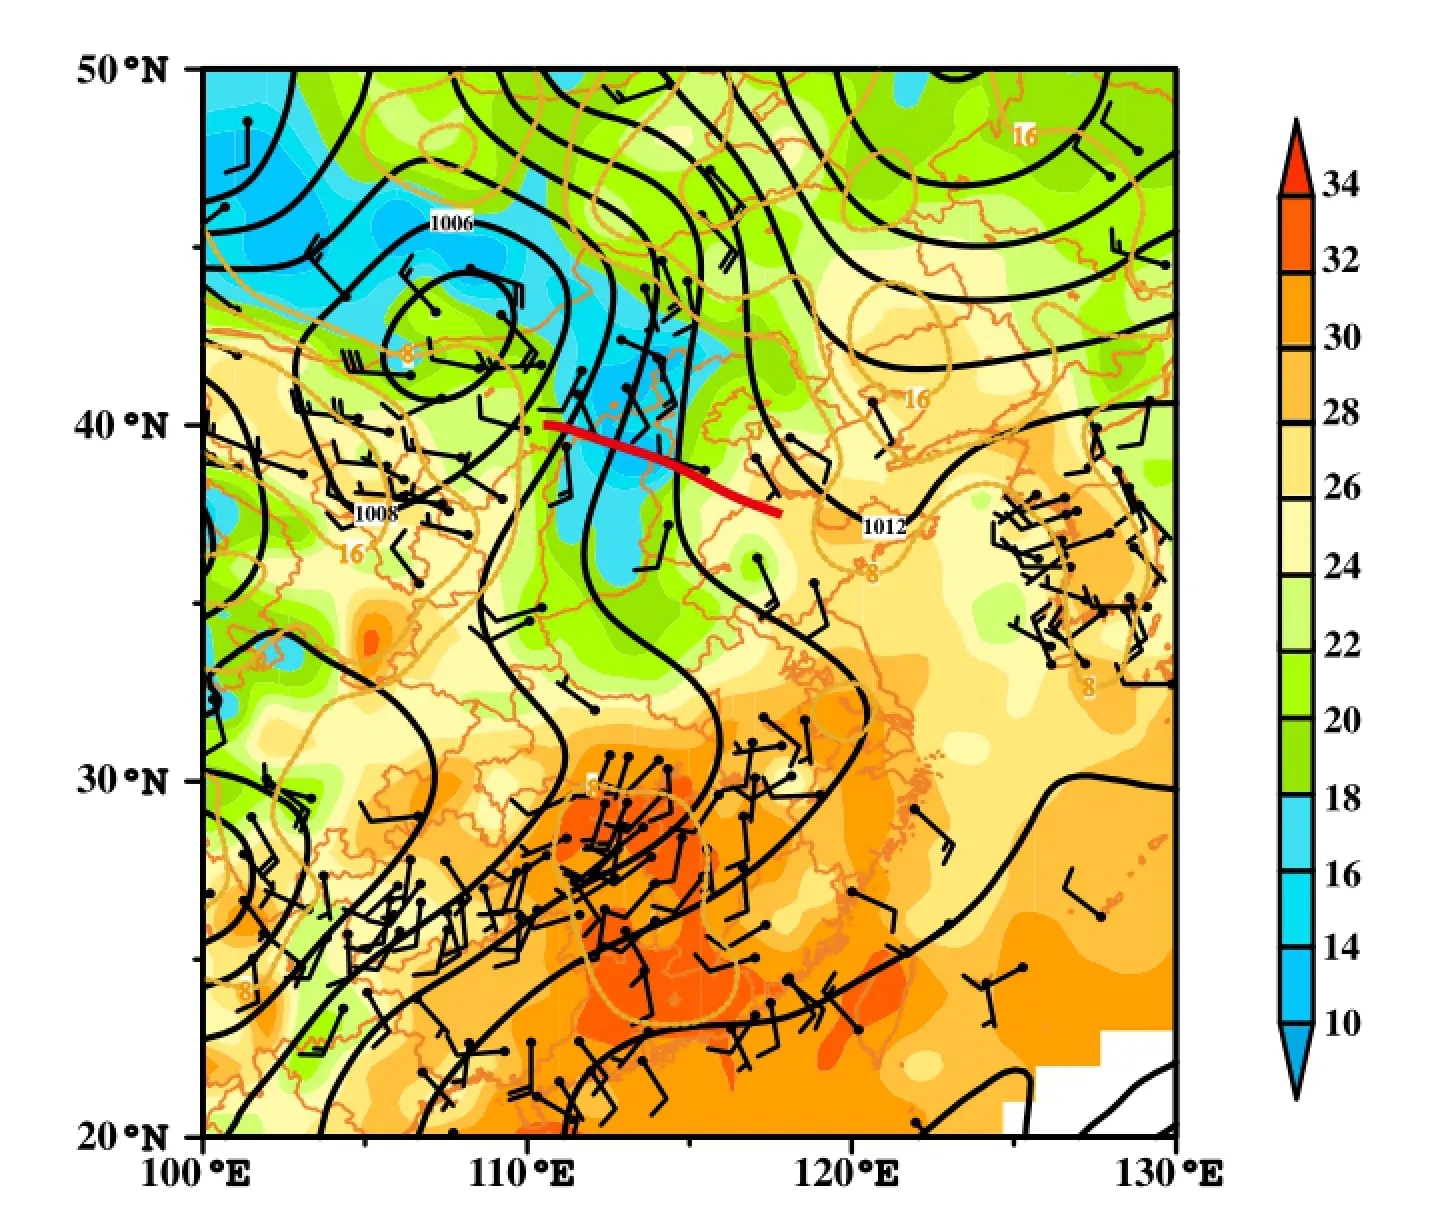
Figure 3.The surface analyses at 0600 UTC 4 September 2015, including sea level pressure (the black solid lines, units: hPa), temperature(color shading, units: °C), and wind feld (full bar, 4 m s-1).

Figure 4.The integrated moisture fux (vector, units: 10-2kg s-1m-1) and divergence of integrated moisture fux (color shaded, units: 10-7kg s-1m-2) from surface to 300 hPa at 0000 UTC 4 September 2015.

Figure 5.Skew T-log p and hodograph (right set) diagram from sounding data at Beijing: (a) 0000 UTC; (b) 1200 UTC 4 September 2015. Notes: Illustration: parallel red curves (dry adiabat), blue lines (isotherm), black parallel lines (isobar), red solid curve (dry adiabat below LCL and moist adiabat above LCL), black solid line (temperature profle), and green dashed curve (dew point profle). Full bar represents 4 m s-1.
3.4. Unstable stratification and CAPE release
As mentioned earlier, Beijing was situated ahead of a trough where there was a possibly unstable area. For confrmation, the sounding radio profles at 0000 UTC and 1200 UTC 4 September 2015 were analyzed (Figure 5). As shown in the thermodynamic diagram (Figure 5), wind direction was in a clock-wise rotation; that is, warm advection predominated in the lower troposphere (surface to 850 hPa) from 1200 UTC 3 to 0000 UTC 4 September 2015,which was favorable to the advance of warm air to Beijing. Southerly wind at 850 hPa and easterly wind at the ground surface were approximately perpendicular to the Yanshan Mountains and Taihang Mountains. It can be qualitatively deduced that the warm air could be lifted by interaction with the related mountains. More quantitative analyses are needed for further proof.

Figure 6.The cross sections along 117°E, including divergence (color shaded, 10-5s-1), pseudo-equivalent potential temperature (black lines, units: K), and meridional circulation (vector: v, ω × 20, units: v, m s-1; ω, Pa s-1) at 0000 UTC 4 September 2015.Note: BJ represents Beijing.
In addition, convective available potential energy(CAPE) and convective inhibition (CIN) were analyzed (Lin 2007). In thermodynamic diagram, CAPE is proportional to the area enclosed by the environmental temperature profle and the moist adiabat of the air parcel in between the level of free convection (LFC) and Level of Neutral Buoyancy. Generally speaking, a positive CAPE is a necessary condition for conditional instability to occur, because the air parcel has potential energy for convection. CIN is defned as the negative area (NA) in general, confned by the dry adiabat (below the lifting condensation level(LCL)) or the moist adiabat (above LCL) to the left, and the sounding to the right, from lower level such as surface to its LFC. The NA represents the energy which is needed and has to be supplied to lift vertically up an air parcel. LCL was 825 hPa, CAPE was only 114 J kg-1, and CIN was 37 J kg-1, therefore it was demonstrated that the air parcel was not easily lifted during 1200 UTC 3 September (fgure not shown). However, the LCL dropped down to 925 hPa,CAPE increased to 421 J kg-1, CIN decreased to 0 J kg-1at 0000 UTC 4 September. This indicates that the environmental conditions were very favorable to the development of convective systems. No CIN to stop the lifting was present. The air parcels can be lifted to LCL, and, with upward motion continuing to a LFC, CAPE can be released. Later,the system development continued and caused the precipitation in Beijing. At 1200 UTC 4 September, the CIN was still 0 J kg-1, CAPE had decreased to 128 J kg-1, and the thickness of the moist layer with dew point-depression less than 3 °C extended from lower troposphere to mid-upper troposphere. The stratifcation was approximately neutral. At that time, the precipitation intensity decreased signifcantly. The rainfall process was over at approximately 0900 UTC 4 September.
The evolution of the stratifcation can also be discerned from the vertical cross sections. For this reason, the zonal(along 40°N) and meridional (along 117°E) vertical cross sections were drawn, respectively. In Figure 6, the distribution of pseudo-equivalent potential temperature(θse), divergence and vertical circulation at 0000 UTC 4 September are shown. It can be concluded that the potential instable area between 800 and 700 hPa extended from 35—45°N. Warm air in the middle layer overlaid upon the cold air in the lower layer. A potential instable maximum of 700 hPa and upward motion below 700 hPa were also detected, located approximately 39°N near Beijing.
3.5. Activity of mesoscale convective systems
There were non-uniform spatial and temporal distributions of the rainfall in Beijing (Figure 1). The rain band moved,extending from Southwest to Northeast. It should be emphasized that mesoscale systems were active during the rainfall. Shown in Figure 1(b), the period of the strong precipitation at Xiangshan station was concentrated mainly during 3 h from 0600 UTC to 0900 UTC 4 September. A precipitation amount of 35 mm/hour (0900 UTC) was reported and mesoscale characteristic was clearly observed by radar echo (fgure not shown). A strong radar echo moved eastward to northwest Beijing at 0530 UTC 4 September and weakened at 0630 UTC 4 September. Then, other strong mesoscale echoes (larger than 45 dBz) arrived at Beijing from the south at 0650 UTC, persisting there for a longer period until 0930 UTC 4 September (fgure not show). Thetwo above mentioned mesoscale convective systems were in agreement with the temporal distribution of the rainy peaks shown in Figure 1(b). This proves that the strong rainfall in Beijing was closely related with the mesoscale systems. However, mesoscale analysis is beyond the scope of this paper and will be presented in detail in another future article.
4. Conclusions
According to statistics, only a few cases of strong rainfall have occurred in Beijing during autumn. Therefore, the precipitation of 4 September 2015 was an uncommon case, even though it was not the only case. Our analyses were completed, and the following conclusions have been drawn: (1)The short wave to the west of Beijing and the ridge to the east of it moved slowly and were almost stationary, providing the favorable environmental conditions for the occurrence of rainfall (i.e. low in the west and high in the east). (2) A forward-tilting trough, where the upper level trough line moved to the east of the lower level trough line, destabilized the air column over Beijing. (3) The warm shear line provided both the favorable environment for rainfall formation and also a possible triggering mechanism. (4) LLJ acted as an important water passage that contributed signifcantly to the transport of rich moisture to the Beijing area, providing the favorable dynamic and thermodynamic conditions for rainfall formation. (5) Unstable stratifcation and CAPE release were observed. (6) Mesoscale systems are still sometimes active in the autumn.
In summary, heavy rainfall in autumn can occasionally occur as long as the favorable environmental and triggering conditions exist. Finally, it should be emphasized that the above mentioned results are preliminary, and further study is needed in the future.
Disclosure statement
No potential confict of interest was reported by the authors.
Funding
This work was supported by the National Key Basic Research Program of China [grant number 2012CB417201]; the National Natural Science Foundation of China [grant number 41375053].
Notes on contributors
ZHAO Si-Xiong is a professor at the Institute of Atmospheric Physics (IAP), Chinese Academy of Sciences (CAS). His main research interests are mesoscale meteorology, Asian monsoon,and atmospheric dynamics. His recent publications include papers in Advances in Atmospheric Sciences, Chinese journal of Atmospheric Sciences, and other journals.
SUN Jian-Hua is a professor at IAP, CAS. Her main research interests are mesoscale meteorology and atmospheric dynamics. Her recent publications include papers in Monthly Weather Review, Journal of Geophysical Research, Geophysical Research Letters, Tellus, and other journals.
LU Rong is a PhD candidate at IAP, CAS. Her main research interests are convective weather in China.
References
Ding, Y., J. Li, S. Sun, Z. Y. Cai, S. X. Zhao, and S. Y. Tao. 1980. “The Analysis on Mesoscale Systems Producing Heavy Rainfall in North China.” Papers of Institute of Atmospheric Physics,Chinese Academy of Sciences (CAS), No. 9, 1—13. Beijing: Science Press.
Guo, X. 1977. “An Initial Case Analysis on Heavy Rainfall Associated with Warm Shear Line in Northern China.” Scientia Atmospherica Sinica (in Chinese) 1 (4): 256—264.
Hu, B., and G. Peng. 1996. “The Structure of the Warm Shear-Line Type Jianghuai Meiyu Front and the Mechanism of Its Formation and the Maintenance.” Scientia Atmospherica Sinica (in Chinese) 20 (4): 463—472.
Lin, Y.-L. 2007. Mecoscale Dynamics, 1—630. Cambridge: Cambridge University Press.
Liu, G., F. Wang, Q. Fu, H. Shen, and P. F. Ji. 2015. “Characteristics of First Thunderstorm Caused by Warm Shear at Beijing Capital International Airport.” Climatic and Environmental Research (in Chinese) 20 (5): 571—580.
Matthews, A. 1902. “The Term Indian Summer.” Monthly Weather Review 30 (2): 69—79.
Saha, S., S. Moorthi, H. Pan, X. Wu, J. Wang, S. Nadiga, P. Tripp,et al. 2010. “The NCEP Climate Forecast System Reanalysis.”Bulletin of the American Meteorological Society 91: 1015—1057. doi:10.1175/2010BAMS3001.1.
Sun, J., X. Zhang, W. Jie, and S. X. Zhao. 2005. “A Study on Severe Heavy Rainfall in North China during the 1990s.” Climatic and Environmental Research (in Chinese) 10 (3): 492—505.
Sun, J., S. Zhao, S. Fu, H. J. Wang, and L. L. Zheng. 2013. “Multiscale Characteristics of Record Heavy Rain over Beijing Area on July 21, 2012.” Chinese Journal of Atmospheric Sciences (in Chinese) 37 (3): 705—718.
Tao, S. 1980. Heavy Rainfalls in China, 1—225. Beijing: Sciences Press.
Wang, J. 1974. “Analysis of Strong Heavy Rain in Beijing on July 2, 1973.” Meteorological Science and Technology 1974 (1): 1—9. You, J. 1965. “Some Characteristics about Structure of Warm Shear Line in Northern China.” Acta Meteorological Sinica (in Chinese) 35 (1): 107—110.
Zhang, L., J. Sun, S. Zhao, and C. Y. Qi. 2007. “A Study on Heavy Rainfall Associated with Warm Shear Line in the Middle Reaches of the Yangtze River in Summer.” Climatic and Environmental Research (in Chinese) 12 (2): 165—180.
Zhao, S., and J. Sun. 2013. “Study on Mechanism and Prediction of Disastrous Weathers during Recent Years.” Chinese Journal of Atmospheric Sciences (in Chinese) 37 (2): 297—312.
4 January 2016
CONTACT SUN Jian-Hua sjh@mail.iap.ac.cn
© 2016 The Author(s). Published by Taylor & Francis.
This is an Open Access article distributed under the terms of the Creative Commons Attribution License (http://creativecommons.org/licenses/by/4.0/), which permits unrestricted use, distribution, and reproduction in any medium, provided the original work is properly cited.
杂志排行

Atmospheric and Oceanic Science Letters的其它文章
- Quasi-biennial oscillation signal detected in the stratospheric zonal wind at 55-65°N
- Long-term surface air temperature trend and the possible impact on historical warming in CMIP5 models
- Precipitation as a control of vegetation phenology for temperate steppes in China
- An observational study on vertical raindrop size distributions during stratiform rain in a semiarid plateau climate zone
- Asymmetric association of rainfall and atmospheric circulation over East Asia with anomalous rainfall in the tropical western North Pacific in summer
- Estimation of the surface heat budget over the South China Sea