Experimental study on simulation test instrument and its penetration performance of soil infiltration clogging
2016-10-31JinzhiYANGZhishuangandLIPengfei
LÜ Jinzhi,YANG Zhishuang and LI Pengfei
College of Construction Engineering, Jilin University, Changchun 130026, China
10.3969/j.issn.1673-9736.2016.03.07
Experimental study on simulation test instrument and its penetration performance of soil infiltration clogging
LÜ Jinzhi,YANG Zhishuang and LI Pengfei
CollegeofConstructionEngineering,JilinUniversity,Changchun130026,China
The three-dimensional seepage simulation test device for siltation dam foundation soil is a multifunctional penetration instrument which is designed for the simulation of infiltration clogging, seepage damage, and dam seepage and so on. This device is different from the traditional instruments for the rock and soil permeability. In order to verify the practicability of the device, the authors collected the soil samples for laboratory penetration test, observed the seepage damage phenomenon, and obtained the dynamic change curve of permeability coefficient and isopotential map of water pressure. At the same time, the Geostudio finite element software is used to simulate the steady seepage of the test device. By contrast of the isopotential maps between simulation and actual water pressures, it is found that they are approximately the same. It is proved that the test data of the device is scientific and reliable, reaching the results of the test and design purposes. The instrument can be used in many aspects of experimental study on soil seepage.
seepage; numerical simulation; penetration performance; soil infiltration clogging
1 Introduction
Seepage is a problem that can’t be ignored in engineering activities. For example, seepage will affect the strength of foundation, soil flow and piping, resulting in underground pipeline leakage (Mai & Chen, 2013). For a long time, the study of seepage is mainly based on Darcy’s law (Zhai, 2013). Currently, most of the instruments used in the study of the permeability of rock and soil are usually the constant hydraulic head and the variable water head (Jingetal., 2008).
Constant head test is carried out in the process, which remains unchanged. Setting the thickness of the sample isL, the cross-sectional area isA, and the water level difference between the upper and lower reaches ish. When testing, using cylinder and stopwatch to measure within a certain time intervaltdownstream of the outlet water quantityQ, the permeability coefficients of the samples can be determined by equation (1).
(1)
Under the condition of change head test on different test section head to test the premise, it goes with the change of time and the corresponding measurement. Setting the cross-sectional area of the water pipe isa, the thickness of the sample isL, the cross-sectional area isA. In the test, the water levelh2andh1corresponding to thet1andt2moments can be measured and the permeability coefficient of the sample can be obtained by equation (2).
(2)
While these two kinds of instruments are widely used in the study of permeability, it fails to monitor the change of the permeability of the soil. And they were all in soil under the condition of seepage field in a one-dimensional vertical test device, in reality, however, engineering in soil dam foundation seepage field exists in three directions of components, the size of the component also differs because of the different spatial location differences. Moreover, the existing seepage test device only considers single seepage flow component of seepage deformation, the soil under the objective conditions of three-dimensional seepage field. The seepage deformation characteristics have greater access to reveal the nature of soil seepage. In order to compensate for the deficiency, the test device can simulate the dynamic change of permeability, seepage flow and seepage field of the dam foundation under the three-dimensional seepage field of the dam foundation. Through the experimental study on the penetration performance of the device, it is expected that the seepage meter can reach the design purpose.
2 Laboratory simulation of seepage flow
2.1Testing device and samples
The test device is as shown in Fig.1. The test sample filling slot the device is composed of a support structure placed on the roof, overlying water inlet and a water outlet connected to the water tank which is composed of high precision step, inserting the specimen filling slot wall monitoring hole type pore water pressure sensor group. The electronic flow-meter, its supporting software, computer composition of pore water pressure and flow monitoring system, the water inlet are at the upper end of the feeding tube, sample container, water injection, water control valve, water valve clogging test sample feeding system, the feed system of injection end and clogging test system water outlet pipeline, connecting the water control valve water pump, water tank, water circulation system which is composed of four parts (Wangetal., 2014). The device of data acquisition system and data logging software are matched to millimeter accuracy in real-time monitoring of pore water pressure by a single sensor connecting two adjacent piezometric holes. The measured head difference calculation is progressive, expanding the sensor monitoring limit value, which is reflected in the soil pore water pressure differences. The outlet end placed three American standard sieve, which is used to collect an outlet stream coerced fine particles, thus contributing to the intuitive observed seepage erosion of the soil body of fine particles. Meanwhile, the piping & soil flow and seepage failure phenomena were observed.
The test samples are collected from the area around the Baicheng of Jilin Province. There are many particles with the good roundness and more sands at the middle section of the river sediment. Take a part of particles to do the test and obtain the grading curve (NHRI, 1999), as shown in Fig.2, among which,Cu=51,Cc=6. If the coefficient of curvature is larger, this shows that the continuity of the particles is poor and the deficiency of the particle size causes that the pore among the larger particles cannot be effectively filled and the pore volume increased. The preliminary forecasting shows that the soil permeability coefficient will be gradually increased in the test to appear the infiltration and sabotage phenomenon (Su L Jetal., 2014).
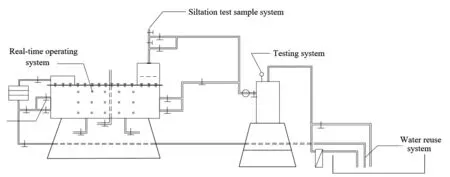
Fig.1 Test device
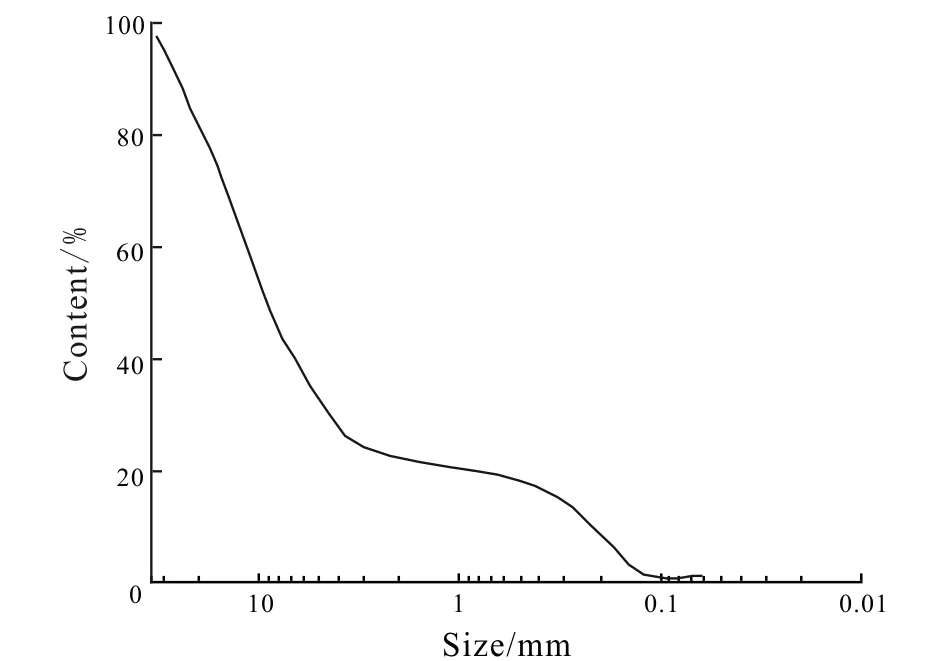
Fig.2 Grading curve of test sand
2.2Test process and result analysis
The test steps are as follows: (1) Loading sample: add the samples in a form of layering and use the vibrating spear to fully stir these samples to make soil body closer to the natural state, after flattening each layer, and then use the rubber hammer to compact the samples to ensure that the sandy soil is fully compacted. (2) Saturated sample: In order to ensure that the samples can be fully saturated, use the layering and add the water to make full saturation, that is, to add the next layer after the soil samples at each layer are fully saturated. (3) Setting of water head, this test is to use the fixed water head with the height of 2.0 m. (4) Operating equipment: open the total drain valve after watering into the filling notch and get data after the reading in the water quantity meter and drainage capacity of the main sewer trends to stable (Li S Betal., 2012).
This test carried out the penetration test for three days at the constant water pressure of 0.02 MPa. The Fig.3 shows the dynamic change curve of the permeability coefficient (k) and its value is gradually stabilized at 2.00 × 10⁻²cm/s.
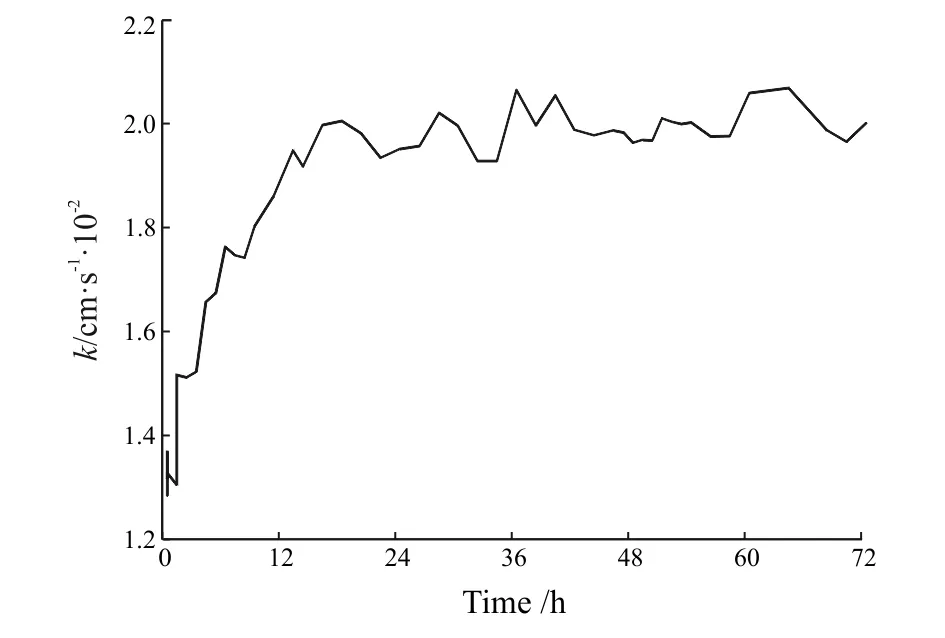
Fig.3 Relationship between permeability coefficient and time
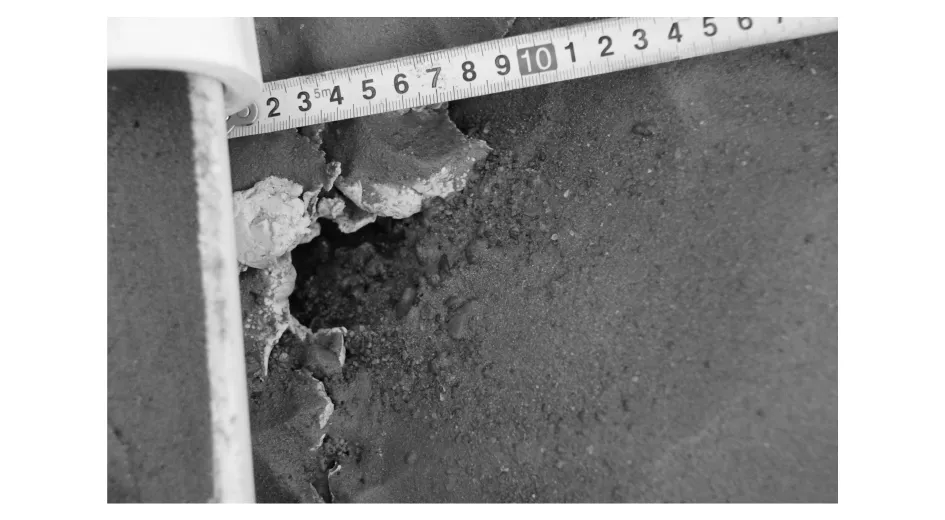
Fig.4 Piping effect in the outlet
The following phenomenon is observed in this test: The water rushes the fine particles under the role of the pressure and the water outlet is very muddy; after the completion of the test, find the tube piping channel (Fig.4). There is a large number of the fine particle in the fine particle collection screen. Carry out the screening and weighing to the rushed fine particles, find that there are approximately 20% of the losses of the fine soil particles. Scratch the upper layer of the soil and only remain the large particles. The test value is line with the forecast value.
3 Finite element analysis and research on seepage flow
3.1Establishment of permeation model
Seep/w model of the Geostudio is a finite element software that may analyze the seepage questions in the soil body (CGSIL, 2011). The seepage coefficient in this test is changed every moment. However, the parameterKin the numerical simulation is constant so that the certain instantaneous state of the samples may be selected to carry out the finite element analysis. The section selected for the geometric model is based on the axis of the loading sample slot to draw the skeleton map of the test device (Simplifying the detailed structure) (Fig.5). The boundary, in addition to water inlet and water outlet, and the remaining boundaries are closed border.
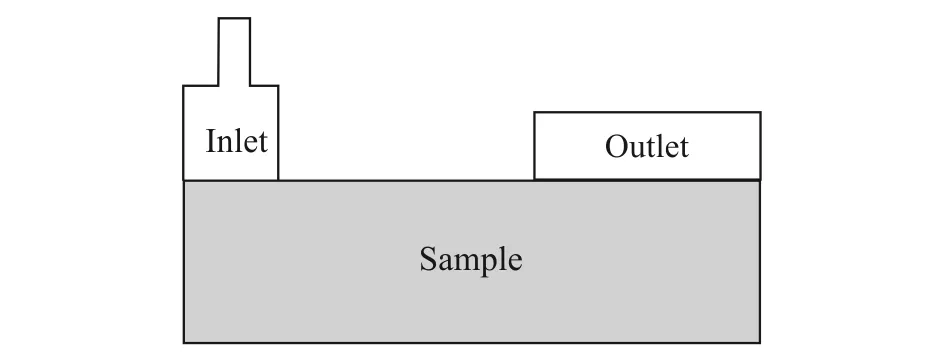
Fig.5 Test device model
3.2Analysis of simulation results
Geostudio may simulate the seepage contour line at a certain time in this test. In the same transient state, the water head value at the axis section of the multi loading slot may be obtained through the pressure sensor group and the contour line of the actual water head pressure may be obtained by using surfer software interpolating. Use the comparative method of the contour diagram of the gross water head to verify the penetrating quality of the testing device (Fig.6).
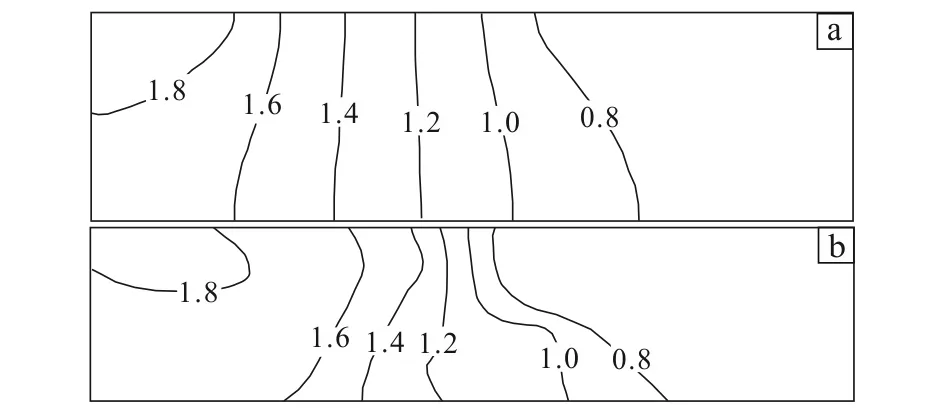
(a) Gross water head contour diagram from Geostudio; (b) gross water head contour diagram from Surfer.Fig.6 Contrast of hydraulic pressure (Unit: m)
The testing water head contour diagram is almost same as the simulative seepage equipotential line diagram (Fig.6). A part of the difference is likely to be caused by the test environment. The equipotential line of the test imaging should be better tortuous than the equipotential line of the analogue imaging and the changes of the width are better significant. But, the environment simulated by the numerical software is desirable and the equipotential line is smooth, its width is uniform. This indicates that the penetration test of the equipment can provide the scientific test data and it is more real than that of the simulation results.
4 Conclusions
(1) Based on the seepage simulation laboratory test, the testing device has monitored the changes of the penetration properties of the soil body and the permeability coefficient gradually increased from 1.28 × 10⁻²cm/s to 2.00 × 10⁻²cm/s. In addition, the piping that may occur in the seepage failure is also observed. The isopotential line of the seepage in the test is consistent with the isopotential line of the simulation. This indicates that the penetrating quality of the device is close to a true circumstance, which can provide the scientific test data to use for the scientific research and teaching.
(2) According to design code for rolled earth-rock dams (SL274-2001), the permeability coefficient of the soil layer in the sample collection region is much larger than 1 × 10⁻⁴cm/s, which is the maximum limit in the code, and the sample collection region is not suitable for the project construction.
(3) The testing device has a broad application prospect, for example, simulation test for impervious wall and leakage monitoring for the underground pipeline, etc. The impermeable clapboard used for the simulation of the test of the diaphragm wall at the dam foundation may be inserted in the soil sample filled in the sample loading slot, by comparison with the water pressure distribution characteristics of the seepage field and small opening at the dam foundation before and after inserting the anti-seepage clapboard, the anti-seepage effect of the diaphragm wall and change situations of the seepage field at soil body before and after carrying out the impermeable construction in the actual water conservancy project may be simulated. The front opening should be set at the front and rear of the sample loading slot along water flow direction and the water pipe to be detected for the leakage should be buried in the soil sample before test, and then the water pipe and leakage pipe should be connected with the monitoring pipe. The changing situation of the internal seepage condition in the soil body may be obtained through the pore water pressure monitoring system to infer the leakage situation of the water pipe and provide the testing data for the relevant researches on the leakage of the underground pipelines.
Canada GEO-SLOPE International Limited (CGSIL). 2011. Unsaturated soil seepage analysis software SEEP/W user guide. Beijing: Metallurgical Industry Press, 1-2.
Jing X D, Yu B, Xie J G. 2008. Test research of permeameter with flexible wall.ExplorationEngineering, 35(9): 28-31. (in Chinese with English Abstract)
Wang Y, Wang Z M, Wang G C. Dam foundation soil infiltration simulation test device for siltation in three dimensions: CH, 2014201852606. 2014-8-13.
Li S B, Wang C M, Wang G C.2012. Infiltration clogging test and simulation by PFC3D for loose dam foundation.JournalofHydraulicEngineering, 43(10): 1163-1170.
Mai J X, Chen T. 2003. Hydraulic structure engineering. Beijing: China Environmental Science Press, 5-8.
Nanjing Hydraulic Research Institute (NHRI). 1999. Geotechnical testing standards (SL237-1999). Beijing: China Water Conservancy and Hydropower Press, 37-40.
Su L J, Zhang Y J, Wang T H. 2014. Investigation on permeability of sands with different particle sizes.RockandSoilMechanics, 35(5): 1289-1294. (in Chinese with English Abstract)
Zhai C. 2013. Study on laboratory simulated test and mechanism of infiltration clogging effect of clay soil: master’s degree thesis. Tianjin: Tianjin University.
1 February 2016, accepted 5 March 2016
Supported by National Natural Science Foundation of China (No.41072197)
Article ID: 1673-9736(2016)03-0182-05
杂志排行
Global Geology的其它文章
- Accumulation conditions of outside source heavy oil in Nepa-Botuoba Sub-basin, Russia and prediction of distribution
- Songjianghe biotite monzonitic granite zircon U-Pb geochronology and geochemical significance
- Mechanism of spatial emplacement of Shanhou gold ore body in Laixi of Shandong and its prospecting significance
- Geochronology, geochemistry and Hf isotope of monzogranite in Niubiziliang of Qinghai
- Geochemical characteristics and petrogenesis of volcanic rocks from Baiyingaolao Formation in northeastern Hailar Basin
- Experimental study of seepage characteristics of single rock fracture based on stress states and stress history
