Numerical simulations of the process of multiple shock-flame interactions
2016-09-23HuaJiangGangDongXiaochenJinTaoWu
Hua Jiang·Gang Dong·Xiao chen·Jin-Tao Wu
RESEARCH PAPER
Numerical simulations of the process of multiple shock-flame interactions
Hua Jiang1·Gang Dong1·Xiao chen1·Jin-Tao Wu1
©The Chinese Society of Theoretical and Applied Mechanics;Institute of Mechanics,Chinese Academy of Sciences and Springer-Verlag Berlin Heidelberg 2016
Based on a weighted essentially nonoscillatory scheme,themultipleinteractionsofaflameinterfacewithan incident shock wave and its reshock waves are numerically simulated by solving the compressible reactive Navier-Stokes equations with a single-step Arrhenius chemical reaction.The two-dimensional sinusoidally perturbed premixed flames with different initial perturbed amplitudes are used to investigate the effect of the initial perturbation on the flame evolutions.The results show that the development of the flame interface is directly affected by the initial perturbedamplitudesbeforethepassagesofreshockwaves,and the perturbation development is mainly controlled by the Richtmyer-Meshkov instability(RMI).After the successive impacts of multiple reshock waves,the chemical reaction accelerates the consumption of reactants and leads to a gradual disappearance of the initial perturbed information.The perturbationdevelopments infrozenflowswiththesameinitialinterfaceasthoseinreactiveflowsarealsodemonstrated. Comparisonsofresultsbetweenthereactiveandfrozenflows show that a chemical reaction changes the perturbation patternoftheflameinterfacebydecreasingthedensitygradient,thereby weakening the baroclinic torque in the flame mixing region,and therefore plays a dominant role after the passage of reshock waves.
Shock-flame interaction·Sinusoidally
perturbed flame·Reshock waves·RMI·Chemical reaction
1 Introduction
When a shock wave interacts with a perturbed interface,baroclinic torque occurs and results in vorticity deposition on the interface owing to the misalignment between the pressuregradientsupportedbytheshockandthedensitygradient across the interface.The interface instability resulting from the vorticity deposition is referred as the Richtmyer-Meshkov instability(RMI)[1-3].In reactive flow,such as a premixed combustion system,a flame front can be regarded as the interface separating reactants from products.The RMI can greatly promote mixing between reactants and products and,therefore,enhance the chemical reactions.As an importantphenomenon,RMIinreactiveflowfrequentlyhappensin supersoniccombustionpropulsion[4,5]andindustrialexplosions[6].
The process of shock-flame interactions is a typical problem of reactive RMI.Markstein[7]first experimentally studied the process in a shock tube.Since his pioneering work,the interaction process of an initially curved flame,for example,a spherical or cylindrical flame,with an incident shock wave and its reflected shock waves has been widely investigated experimentally[8,9]and numerically[10-19]. These studies show that the RMI is the dominant mechanism of flame instability and that the initial spherical or cylindrical flame can be greatly disturbed and accelerated by shock waves during multiple interactions.Furthermore,some studies[8,11-19]have addressed the deflagration-to-detonation(DDT)problem and found that a complex reactive shock bifurcation(RSB)structure induced by multiple shock wave interactions could lead to the formation of hot spots and give rise to detonations in the flow field.
Unlike the RMI of spherical or cylindrical flames,few studieshavebeenreportedontheRMIofaflamewithanini-tialperturbation,forexample,asinusoidallyperturbedflame. What has been reported was only for a single shock-flame interaction.Khokhlov et al.[20]numerically simulated the single interaction of an incident shock with a sinusoidally perturbed flame.In their study,the effects of incident shock strengthandwavenumbersandamplitudesofaninitialflame on perturbation development were investigated.They found that the amplitude of perturbations has a moderate influence on the energy release rate and that the maximum increase in the energy generation rate due to the single interaction does notexceed30times.Recently,Kilchyketal.[21]reportedthe RMIofapremixedflameusingone-dimensionalanalysisand two-dimensional numerical simulation.The study showed that the single interaction of a shock/expansion wave with a sinusoidally perturbed flame significantly changes the fuel consumption rate.Massa et al.[22]studied the mechanism for the RMI development from shock-flame interactions using a linear analysis method.They pointed out that reactivity changes the perturbation growth rate and promotes the absenceofsmall-scaleperturbationsoncorrugatedflamesby developing a pressure gradient at the flame surface.
Thoughtheprocessofasingleinteractionbetweenashock waveandaninitialsinusoidallyperturbedflameinterfacehas been studied to address the reactive RMI in a premixed combustion system[20-22],itwasfoundthatsuchaninteraction had a relatively mild effect on the increase in the chemical reaction rate and RMI evolution.The process of interactions betweenmultipleshockwavesandaninitialsinusoidallyperturbed flame interface would be more complex and needs to bestudied.Tillnow,therehavebeenfewdiscussionsonmultiple interactions of shock-flame interface,and some details of the multiple interactions are still unknown.In this paper,we numerically study the multiple interactions of an initial sinusoidally perturbed flame interface with a planar incident shockwave(ISW)anditsreshockwaves(RSWs).Theeffect of the initial perturbed amplitude on flame evolution is the main focus of the paper.In addition,the effects of RMI and reactivityontheprocessofmultipleshock-flameinteractions arediscussedbycomparingflameevolutioninareactiveflow with that in a frozen flow.
2 Numerical methods
2.1 Governing equations
The two-dimensional reactive Navier-Stokes equations are expressed as follows


where uiis the i-th velocity component(i=1,2);ρ is the density;p is the pressure;Y is the mass fraction of the reactant;E is the total energy per unit volume,defined as,where γ is the adiabatic index andq is the chemical heat release per unit mass;τijis the element of viscous stress tensor:

where δijis the Kronecker function.In Eq.(3),qj= ?is the heat flux,with T denoting temperature;the kinematic viscosity υ,diffusion D,and heat conduction k have a similar tem?pera?ture dependence[6]? ?,where ?are constants and cpis the specific heat at constant pressure,and n=0.7.The Lewis,Prandtl,and Shmidt numbers are all set to 1 so that the constants can be set as υ0=D0=k0= ? A single-step Arrhenius reaction model is used,and the chemical reaction rate is expressed as

where A is the preexponential factor,Eathe activation energy,and R the universal gas constant.The values of these chemical kinetic parameters are selected according to Ref.[23].
To solve Eqs.(1)-(4),a ninth-order weighted essentially nonoscillatory(WENO)scheme[24]is utilized to approximate the numerical fluxes of the inviscid term.The WENO scheme follows the same idea of an essentially nonoscillatory(ENO)scheme[25]with the advantage that it achieves higher-orderaccuracywithfewercomputations.Thescheme goes one step further by taking a weighted average of all candidates for the ENO scheme.Around the discontinuities,WENO schemes behave similarly to ENO schemes to avoid spurious oscillations near shocks,but in the smooth regions of solutions,WENO schemes act like an upstream centered scheme.So the WENO scheme has the advantages of flux smoothness and stability of the convergent solution. A tenth-order central difference scheme is used to discretize the viscous term.The high-order and high-resolution simulations have lower numerical dissipation and are better at exhibiting the fragmentation of structures,symmetry breaking,and increased mixing in interface instability phenomena[26,27].Therefore,thecomputationsinthepresentstudyare ninth-order accurate,at least in space.
In addition,a third-order Runge-Kutta time marching is adopted for unsteady problems in the present study,and aCFL number of 0.5 is used in all of the simulations.Because a single-step irreversible chemical reaction was employed,and only a reactant(Y)is used to describe the combustion process,thestiffnessduetothechemicalreactionsisnegligible.Therefore,the time step for the chemical reactions is the same as those in inviscid and viscous terms.This time step,which is determined by the CFL stability criterion,avoids the occurrence of nonphysical values during computations.
2.2 Computational setup
To study the process of multiple shock-flame interactions,a two-dimensional computational domain,which is an analog of a shock tube experiment,is employed to simulate the perturbation growth of the interface,as shown in Fig.1.The rectangularboxisthecomputationaldomain,thestreamwise length Lyis set to 0.6 m,and the transverse length Lxis set equal to the initial single-mode perturbed wavelength λ0of theflameinterface(Lx=λ0=20 mm).Theuniformsquare cells(Δx=Δy)are filled in the computational domain.A periodic boundary condition is imposed on the transverse direction(x-direction),a solid wall condition is enforced on the end wall,and an inflow condition is imposed for the inlet of fluid.The initial ISW is located 0.11 m from the inlet. The center line of the initial perturbed interface(dashed line in Fig.1)is located 0.12 m from the inlet.These distances ensure that the rarefaction wave produced by the interaction between the ISW and the flame interface cannot move out of the inlet during the computations.
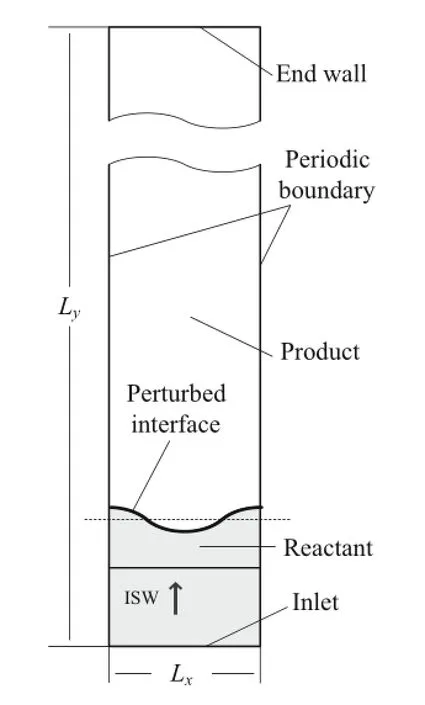
Fig.1 Two-dimensional computational setup for shock-flame interactions
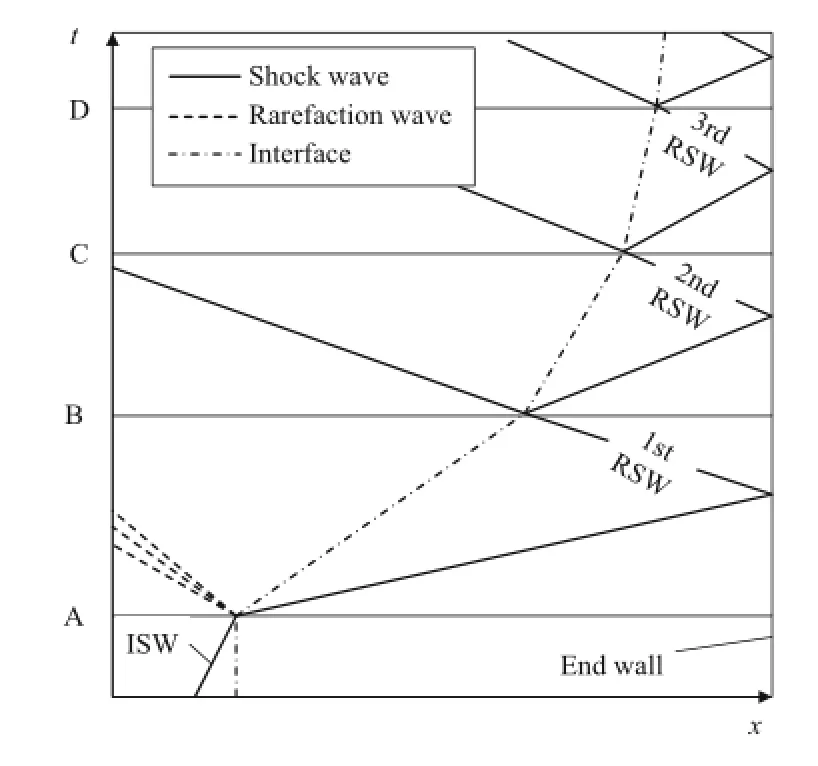
Fig.2 Wave diagram of shock-interface interaction for heavy/light type
An ISW with Ma=1.7 propagates along the streamwise direction through a sinusoidal flame interface that separates the reactant with an initial pressure of 13.3 kPa and an initial temperature of 293 K from the corresponding burning products at constant pressure and then reverberates between the interface and the end wall of the tube.Figure 2 presents a wave diagram of the multiple interactions for the heavy/light interface when an ISW passes through the interface from a heavy fluid zone to a light fluid zone.In the present study,a low-temperature unburned reactant corresponds to a heavy gas,and a burned product with a high temperature corresponds to a light gas.The reverberating shock waves(first,second,third reshock waves,and so on)are generated between the interface and the end wall.The process can be treated as a combination of several stages.Each stage ranges fromthetimewhentheflameinterfaceisimpactedbyashock wave to the time when the interface is impacted by the next shock wave.A,B,C,and D are time points representing the moment when a shock wave interacts with the interface. Thus,stageA-Bisthefirststage(TISW),stageB-Cisthesecond stage(T1stRSW),stage C-D is the third stage(T2ndRSW),stage D-E is the fourth stage(T3rdRSW),and so on.
The initial profile of a single-mode sinusoidal flame interface is defined as

where a0is the initial perturbed amplitude.In this study,we consider three cases with different initial perturbed amplitudes,aslistedinTable1.Sincetheactualflameinterfacehas thicknessandthephysicaldiffusionshouldnotbeignored,an initialdiffusionlayerthicknessofδ=1 mmwasused,wherethe thickness function(multiplying the density)is expressed as[28]

Table 1 Parameters of initial perturbed flame interface

where β is machine zero(=10-9),and d= (xs+a(y)+δ-x)/(2δ),wherexsisthelocationoftheinitialinterface without an initial perturbation.
3 Results and discussions
3.1 Cell resolution tests
Since there are no available experimental measurements on multiple interactions of a perturbed flame interface with shockwavesintheliterature,weselectedsimilarexperimental pictures from Ref.[8]on the interactions between shock waves and a spherical flame as a validation of the chemical reaction model in our previous studies[19,23].These comparisonsbetweentheexperimentalandcomputationalresults indicated that the chemical reaction model employed in the present study is appropriate.However,the chemical reaction model is dependent on the cell size and numerical scheme. Therefore,to examine the effect of cell size on perturbedflame development in shock and reshock accelerated flows,cell-independence tests are carried out using three different uniform cell sizes:?? 0.1,and 0.05 mm.A mean heat release rate of is chosen to identify the cell resolution,expressed as

Here ? is the mean chemical heat release,subscript F represents the flame region(defined as 0.01≤Y≤0.99),and A denotes the area of the flame region.The ? with the differentcellsizesasthetimefunctionforthecasea0=1.0 mm is plotted in Fig.3.It is found that the curve of the Δx= Δy=0.2 mm size shows the remarkable difference from othercurvesofsizesΔx=Δy=0.05 and 0.1 mm,whereas the curves of cell sizes of 0.05 and 0.1 mm show only very slightdifferencesbetweeneachother.Consideringtheexpensive computational costs,a cell size of Δx=Δy=0.1 mm is used for all computations in the following sections.In this case,the cell size is approximately seven times smaller than the width of the reaction zone for a laminar premixed flame of the same gaseous mixture as that in our previous study[16].In addition,it should be noted that a ninth-order WENO scheme with a cell size of 0.1 mm has a cell resolution and a small numerical viscosity similar to those of a fifth-order WENO scheme with a cell size of 0.05 mm[29]. Thus,the high-order scheme and cell size employed in the present study are adequate to describe the development of a flame and the vortex structure with dominant scales during the RMI.
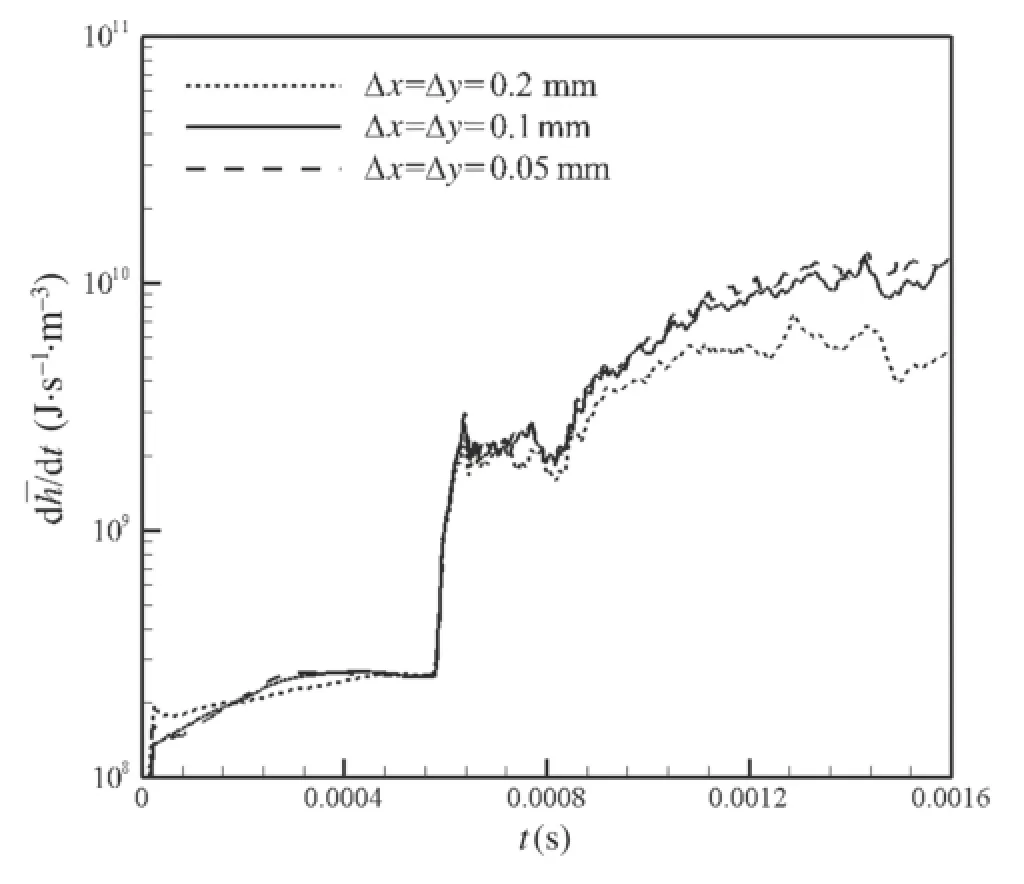
Fig.3 Time histories of mean heat release rate for different cell sizes,a0=1.0 mm
3.2 Two-dimensional visualization
In reactive flow,the perturbation development on a flame interface is affected by both the RMI and the chemical reactivity.In this section,we present the two-dimensional visualized perturbation evolutions of a flame interface.Typically,the early perturbation development of an interface by RMI can lead to the so-called spike-bubble structure.The spike represents an interface structure by which a heavy gas(reactant)extends into the region of a light gas(product),while the bubble represents a structure in which the light gas expands into the heavy gas.To examine the chemical reaction effect,the corresponding perturbation evolutions in frozenflowswerealsonumericallysimulatedusingEqs.(1)-(4)but turning off the chemical term ?in Eq.(4)and setting q=0.
Figure 4 presents the local two-dimensional distributions of the reactant mass fraction for three cases in reactive flowandfrozenflowatfourselectedtimes(t=0.56,0.82,1.00and 1.24 ms),respectively.The four times represent the typical instants at different stages of shock-interface interactions. For t=0.56 ms(Fig.4a)at which the ISW has passed through the interface but at which the first RSW has not reached,the interfaces in the frozen flow show the different large-scale spike-bubble structures for the different initial perturbation amplitudes,that is,unformed roll-up(a0= 0.2 mm),formed but not violent roll-up(a0=0.5 mm),and formed roll-up with a big circle(a0=1.0 mm)on the top of the spike,while in reactive flow the spike-bubble structures are still reserved for three cases;however,the inner spiral structures in the roll-up are invisible at larger amplitudes owing to the consumption of reactant by the chemical reaction.
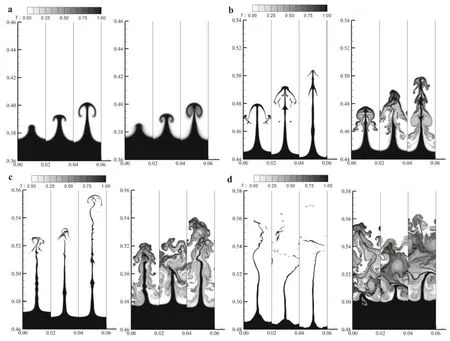
Fig.4 Mass fraction distributions of reactant in reactive flow(left)and frozen flow(right).In each subfigure,a0=0.2,0.5,1.0 mm are aligned from left to right.a t=0.56 ms.b t=0.82 ms.c t=1.00 ms.d t=1.24 ms
At t=0.82 ms(Fig.4b)in which the first RSW has impacted the interface but the second RSW has not,the large-scale structures of the interface for both reactive and frozen flows can be characterized by a streamwise spike of the reactant.The length of the spike rises with the increase in the initial perturbation amplitude.The difference between the reactive and frozen flows can be found by observing the medium-andsmall-scalestructuresonbothsidesofthespike. In the reactive flow case,thin branches are observed owing to the chemical consumption of the reactant,whereas in the case of frozen flow,the complex mixing regions between unburned and burned gases with a vortex structure are visible.Note that a symmetric spike structure is destroyed in frozen flow for cases where a0=0.5 and 1.0 mm,but not in reactive flow cases.
Figure4c,dshowsfurtherdevelopmentsoftheinterfaceat theinstantswhenthesecondandthirdRSWspassthroughthe deformedinterface,respectively.Forbothreactiveandfrozen flows,thespikesarefurtherstretchedinthestreamwisedirection and the breakups of the symmetric spike structure are observed for all cases.However,the length of the spike for reactive flow is larger than that for frozen flow at the same initial perturbation amplitude cases.In addition,the burnoutof the reactant at the top of the spike occurs at t=1.24 ms for reactive flow cases with a0=0.5 and 1.0 mm.
TheresultsofFig.4revealthatthedevelopmentofaflame interface(reactive flow)is necessarily different from that in the corresponding frozen flow.First,the spike formed by the RMI on the flame interface evolves in a thinner and more rapid growth mode in the early and middle stages(Fig.4a-c)compared with the evolution of a spike in frozen flow,and then is burned out at its upper part in the later stage(Fig.4d). Second,the loss of symmetry for the spike in the reactive flow occurs later than that in the frozen flow.Furthermore,for both reactive and frozen flows,the spike evolutions are affected by the initial perturbation amplitude in the early and middle stages but are independent of the amplitude in later stages.
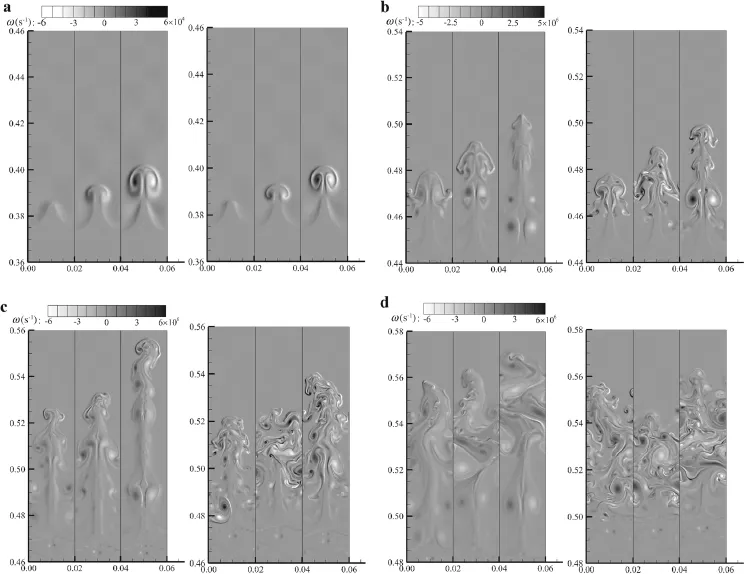
Fig.5 Vorticity distributions in reactive flow(left)and frozen flow(right).In each subfigure,a0=0.2,0.5,1.0mm are aligned from left to right. a t=0.56 ms.b t=0.82 ms.c t=1.00 ms.d t=1.24 ms
Theevolutionsofthespikearecloselyrelatedtothechemical reaction and the vorticity deposition on the interface by RMI.Figure 5 shows the vorticity distributions for three initial perturbation amplitudes in reactive flow and frozen flow at the same instants as those in Fig.4.Figure 5a indicates that the large-scale structures of the interface for both reactive and frozen flows shown in Fig.4a are attributed to the large-scalevorticesdepositedontheinterfacebyRMI.Comparisonsbetweenthereactiveandfrozenflowsrevealthatfor aflameinterfacetheRMIdominatestheevolutionofalargescale structure,while a chemical reaction has little influence on the large-scale structure at early stages.
In Fig.5b,the first RSW has interacted with the deformed interface with large-scale vortex structures and then breaks the vortices into the smaller vortices at the top of the spike. For frozen flow,these smaller vortices are sensitive to the numerical perturbations and thus break the symmetric structures of the spike,especially for a0=0.5 and 1.0 mm cases. Thelossofsymmetryoftheinterfacebysmall-scalevortices was also found in Refs.[26,28],while for the reactive case,thechemical reaction consumes mostofthereactant near thespike and weakens the vorticity in these regions.Therefore,the symmetric structure of the spike is preserved.
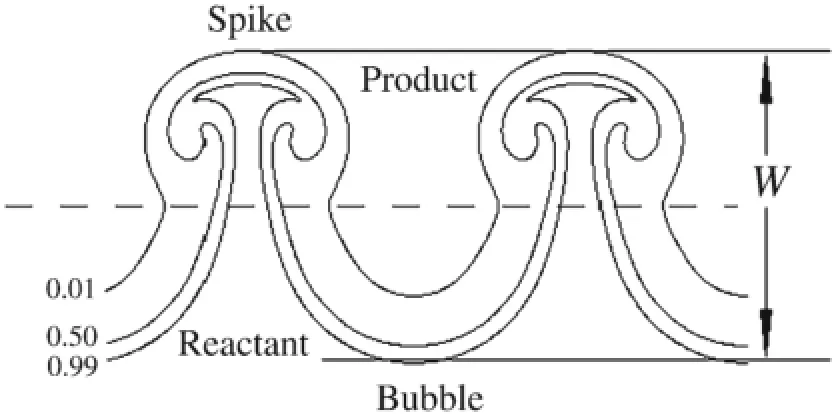
Fig.6 Definitions of mixing zone width for perturbed flame interface(the three contour lines are the reactant mass fraction of 0.01,0.50,and 0.99,respectively)
Figure 5c,d shows the formation of medium-and smallscale vortices that are induced by second and third RSWs,respectively.These vortices further promote the asymmetry of the interface.Owing to the passage of successive RSWs from the top to the bottom of the spike,the vortices in the upper part of the spike are finer than those in the lower part. Thus,the breakup of the spike symmetry begins in the upper part and moves to the lower part.Therefore,the upper part of the spike structure for reactive flow at t=1.00 ms also begins to lose symmetry(Fig.4c),although the vortices are weaker than those for the frozen flow case.Note that at t= 1.00 and 1.24ms,the vortices for frozen flow are obviously stronger than those for reactive flow.This leads to a stronger mixingeffectandthusshortensthestreamwiselengthsofthe spike for frozen flow compared with those for reactive flow,as shown in Fig.4c,d.
3.3 Mixing and chemical reaction properties
The mixing zone width of an interface is usually used to describe the perturbation development and the mixing effect of two fluids with different densities induced by the RMI in inert flow[30,31].Here,we also use the mixing zone width W of a flame interface to describe the perturbation development and the mixing on the flame interface.The definition of W is illustrated in Fig.6.The contour lines in the figure show a typical early-time pattern of flame interface development from an initial sinusoidal perturbation.The dashed horizontal line represents the location of a shocked,unperturbed interface that is used as a separation line between the bubble and the spike.Thus,the width W can be defined as the distance from the top of a spike to the top of a bubble. In the present study,we treat the flame as an interface with a thickness from the reactant mass fraction 0.01 to 0.99,and so W can be determined by measuring the streamwise length from 0.01 of the spike to 0.99 of the bubble,as shown in Fig.6.

Fig.7 Time histories of mixing zone width of flame in reactive flow

Table 2 Growth rates of linear part of previous three stages
The variations in W of the flame interface with different initial perturbed amplitudes along with the time are shown in Fig.7.One can see that in the three earlier stages(TISW,T1stRSW,and T2ndRSW),the mixing zone widths for all cases grow continuously with time,while in the later stages they decline in a zigzag profile.The growing stages of the three cases all have linear characteristics,and the growth rates can be determined using a linear fit(Table 2).For TISWand T1stRSW,thelargertheinitialperturbedamplitude,thehigher the growth rate of the mixing zone width.For each case,the growth rate of T1stRSWis much higher than that of TISW. For T2ndRSW,growth rates of 1.0 and 0.5 mm are slightly decreasing but are still much higher than that of TISW.In later stages,chemical reaction promotes the consumption of the flame interface and thus shortens the mixing zone width(Fig.4d).
It is noted that the linear growth of W in the first three stages in Fig.7 are similar to those in inert flow[30-33],whichimpliesthattheRMIplaysamajorroleatthesestages. Thelarge-scalevorticescausedbyRMImaintainthereactant flow into the spike and lead to a higher growth of the flame interface.
The mixing area of the flame interface is another measure of the mixing of unburned/burned gases.We define the area Amas
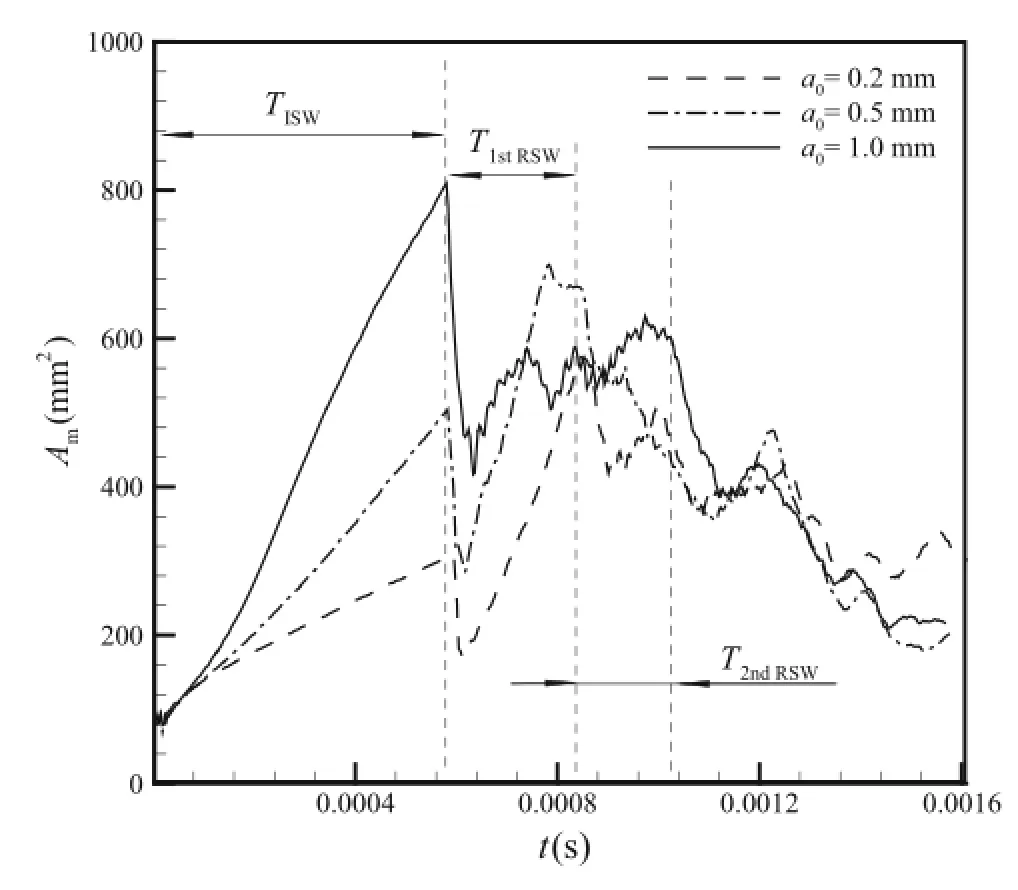
Fig.8 Timehistoriesofmixingareaofflameinterfaceinreactiveflow

where D is the whole computational domain and Y is the mass fraction of reactants for 0.01≤Y≤0.99.
The variations of Amwith different initial perturbed amplitudes along with time are shown in Fig.8.In the first stage(TISW),the growth of Amfor the three cases are similar to the growth of W,that is,the larger initial perturbed amplitudeleadstofastergrowthof Am.Thisfurtherconfirms that the initial perturbed amplitude has a direct influence on the perturbation development through the RMI.However,in the next two stages(T1stRSWand T2ndRSW),the growth patterns of Amfor three cases are complex.On the one hand,the effect of the initial perturbed amplitude is still observed,which implies the role of the RMI.On the other hand,the values of Amare obviously lower in these two later stages than that in TISW.This indicates that the small-and mediumscalevorticespromotelocalmixingandinturnacceleratethe burn-outofreactantand,therefore,reducethemixingareaof theflameinterface.After T2ndRSW,thesmall-scalestructures are nearly burned out(Fig.4d)with the increasing effect of chemicalreaction;thus,the Amofthethreecaseslargelyfollow the same trend.This means that the impact of the initial perturbation disappears completely and the development of theflameiscontrolledbychemicalreactionratherthanRMI.
Comparedwiththemixingzonewidth W showninFig.7,which can only describe large-scale mixing induced by the RMI,the mixing area Amcan better depict the small-and medium-scale mixing of reactant/product gases and the subsequentchemicalconsumptionofthereactant.Therefore,Amisamoresuitablemeasureforcharacterizingtheperturbation development in reactive flow.
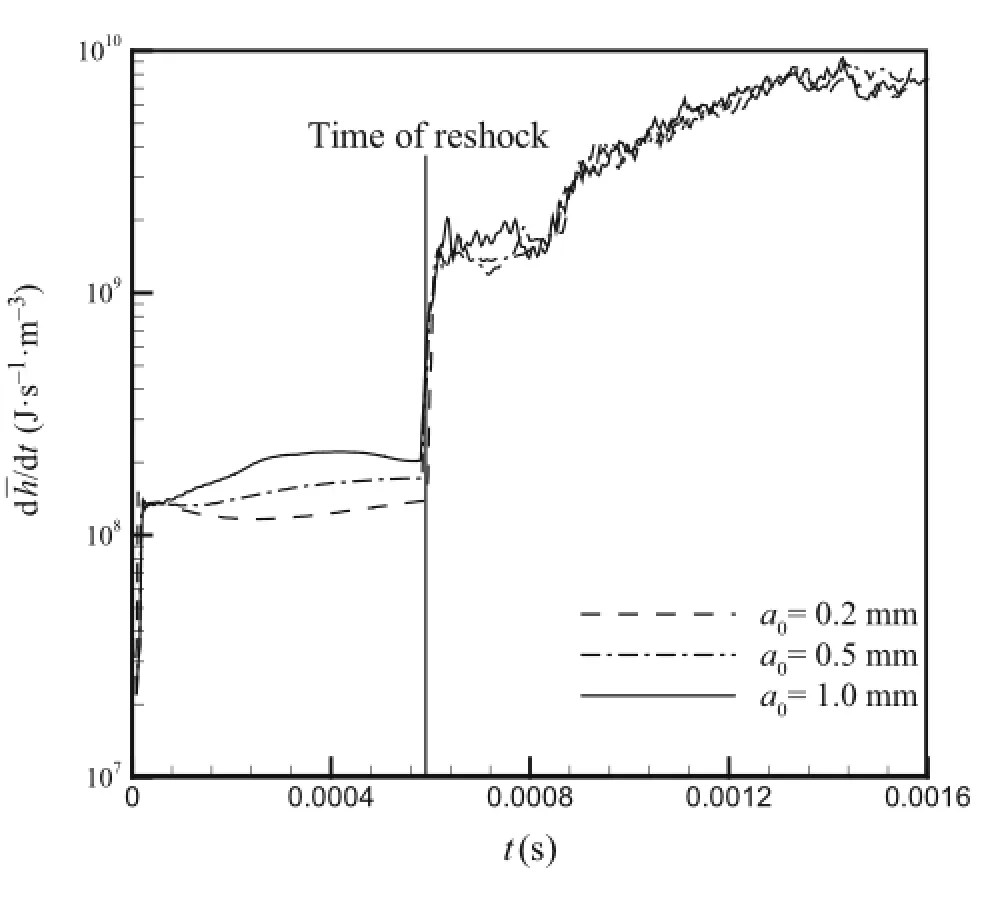
Fig.9 Time histories of mean chemical heat release rate of flame
The mean chemical heat release rate ? characterizes the effect of a chemical reaction on the perturbation development of the flame interface.Figure 9 presents the variations of? for the three cases over time.A black vertical line represents the time of an interface that has just been impacted of the first RSW and divides the curves into two parts.Before the passage of the first RSW,the chemical heat release rate depends on the initial perturbed amplitude,although it is very low for all three cases.The larger initial perturbed amplitude can lead to a longer flame interface,which will enhance the chemical reaction and thus produce a higher chemical heat release rate.After the occurrence of reshock ? rapidly rises for all cases and no obvious differences in? among these cases are observed.The results also suggest that after reshock the chemical reaction plays an important role and the effect of the initial perturbed amplitude is weakened.
3.4 Vorticity properties
Comparisons of vorticity distributions between reactive flow and frozen flow(Fig.5)provide explanations of the effects of the RMI and chemical reactions on the evolution of a flame.Theresultssuggestthattheweakenedvorticesinreactive flow lead to the later asymmetry patterns of the flame interface and attribute these patterns to the longer streamwise spike of the reactant after the successive occurrences of RSWs.Toexaminethevorticitypropertiesofflamedevelopment,we first present and compare the mean magnitude of vorticity ? as a function of time in both reactive and frozen flows,expressed as

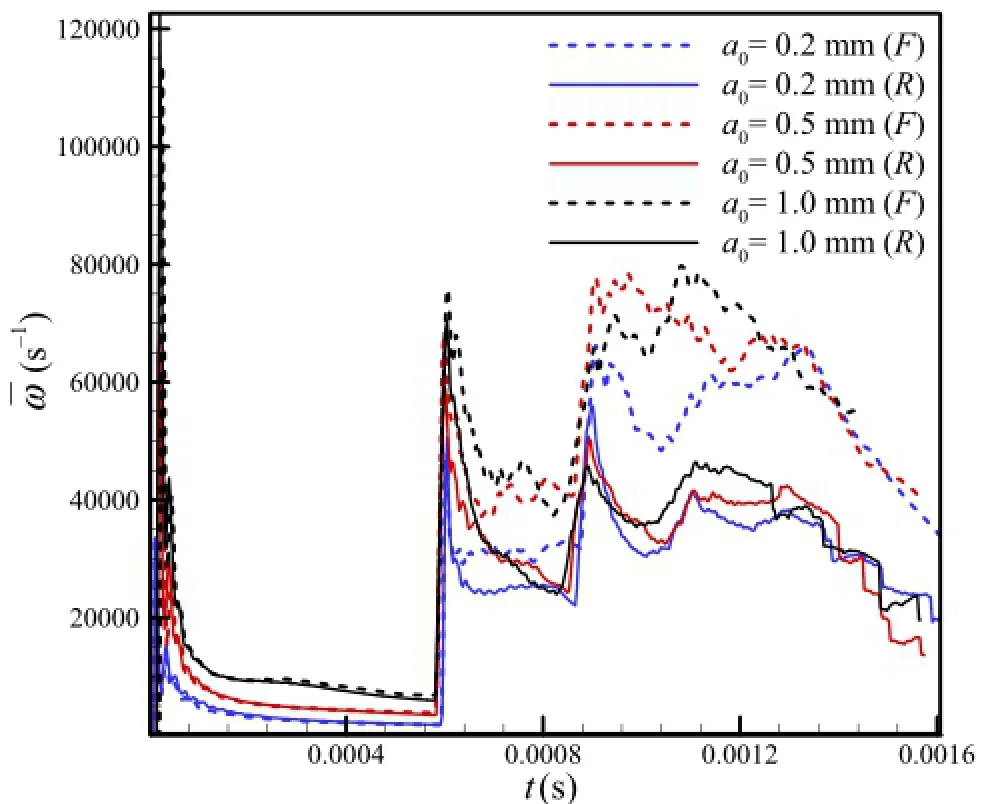
Fig.10(Color online)Time histories of mean vorticity magnitude in flame region.F frozen flow,R reactive flow
where the subscript F represents the rectangular region whoselengthisthestreamwisemixingzonelengthW(Fig.6)and width is Lx(Fig.1).Figure 10 shows the variations of¯ω with different initial amplitudes for reactive and frozen flow cases.
It can be seen that before the occurrence of the first RSW the mean vorticity in the reactive flow is nearly the same as thatinthefrozenflowatthesameinitialperturbedamplitude. This suggests that the chemical reaction has little effect on themeanvorticitymagnitudeandthattheRMIdominatesthe flame interface development.However,once the first RSW passes through the interface,the vortices in the frozen flow cases are obviously larger than those in the reactive flow cases.The results are consistent with those in Fig.5 and suggest that the chemical reaction gradually plays an important role.
A vorticity transport equation can be used to further examinetheeffectsofchemistryandRMIoninterfacedevelopments.The equation is expressed as

where ω is the vorticity,and γ is the kinematic viscosity. The first term on the right-hand side of Eq.(12)represents the vorticity production due to the dilation(compression)effect,the second term represents the effect of the baroclinic torque,and the last term represents the viscous effect.The integral forms of these terms are expressed as follows
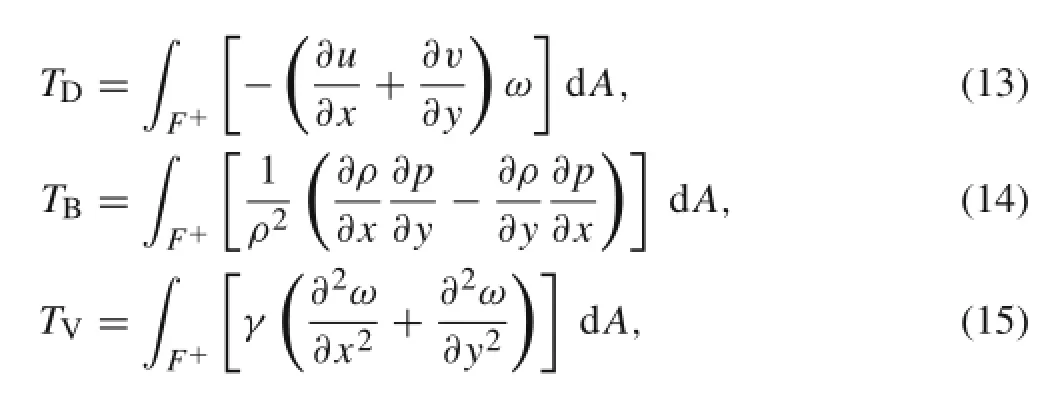
where TDrepresents the dilatation term,TBthe baroclinic torque,and TVthe viscous term;F+is the region where the vorticity value is positive in the region of F.Thus,in the region of F+,if the value of any term is positive,then the corresponding term has a favorable effect on the vorticity production,whereas if the value is negative,then the term has an inhibitive effect.The variations of TD,TB,and TVin reactiveandfrozenflowsforthecasewherea0=1.0 mmare showninFig.11,wherethenegativevaluesofthesetermsare transformedintoan“absolutevalue”(redline)(coloronline)to compare with the positive values.
The results presented in Fig.11a show that the variations of TDin reactive and frozen flows are similar,which implies thatthechemicalreactionhaslittleeffectonthevorticityproduction the by dilatation effect.However,for the baroclinic term TBandtheviscousterm TVthevaluesinfrozenfloware all larger than those in reactive flow after the occurrence of RSWs.Thissuggeststhattheweaknessofvorticitybychemicalreactionismainlyattributabletoreductionsinbaroclinic torqueandtheviscouseffect.Furthermore,forthebaroclinic torqueterm(Fig.11b),thepartwithpositivevaluesisalways largerthanthepartwithnegativevaluesforbothreactiveand frozen flows,which therefore means that the contribution of the baroclinic effect to vorticity production is favorable.In contrast,fortheviscousterm(Fig.11c),thepartwithpositive values is always smaller than the part with negative values for both flows,which means viscosity inhibits vorticity production.In addition,it should be noted that the variations of TBare more than four times larger than those of TV.This indicates that inhibiting the baroclinic effect is a main way to weaken vorticity in reactive flow.
The preceding analysis indicates that the baroclinic term has a dominant effect on the inhibition of vorticity in reactive flow.Because baroclinic vorticity production is due to themisalignmentbetweenthepressureanddensitygradients on the interface,considering the similar pressure gradients for both reactive and frozen flows with the same initial incident shock waves,we only discuss the effect of the density gradient on baroclinic vorticity production.Figure 12 shows the variations in the mean magnitude of the density gradientin both reactive and frozen flows for the case where a0=1.0 mm.Thecan be expressed as

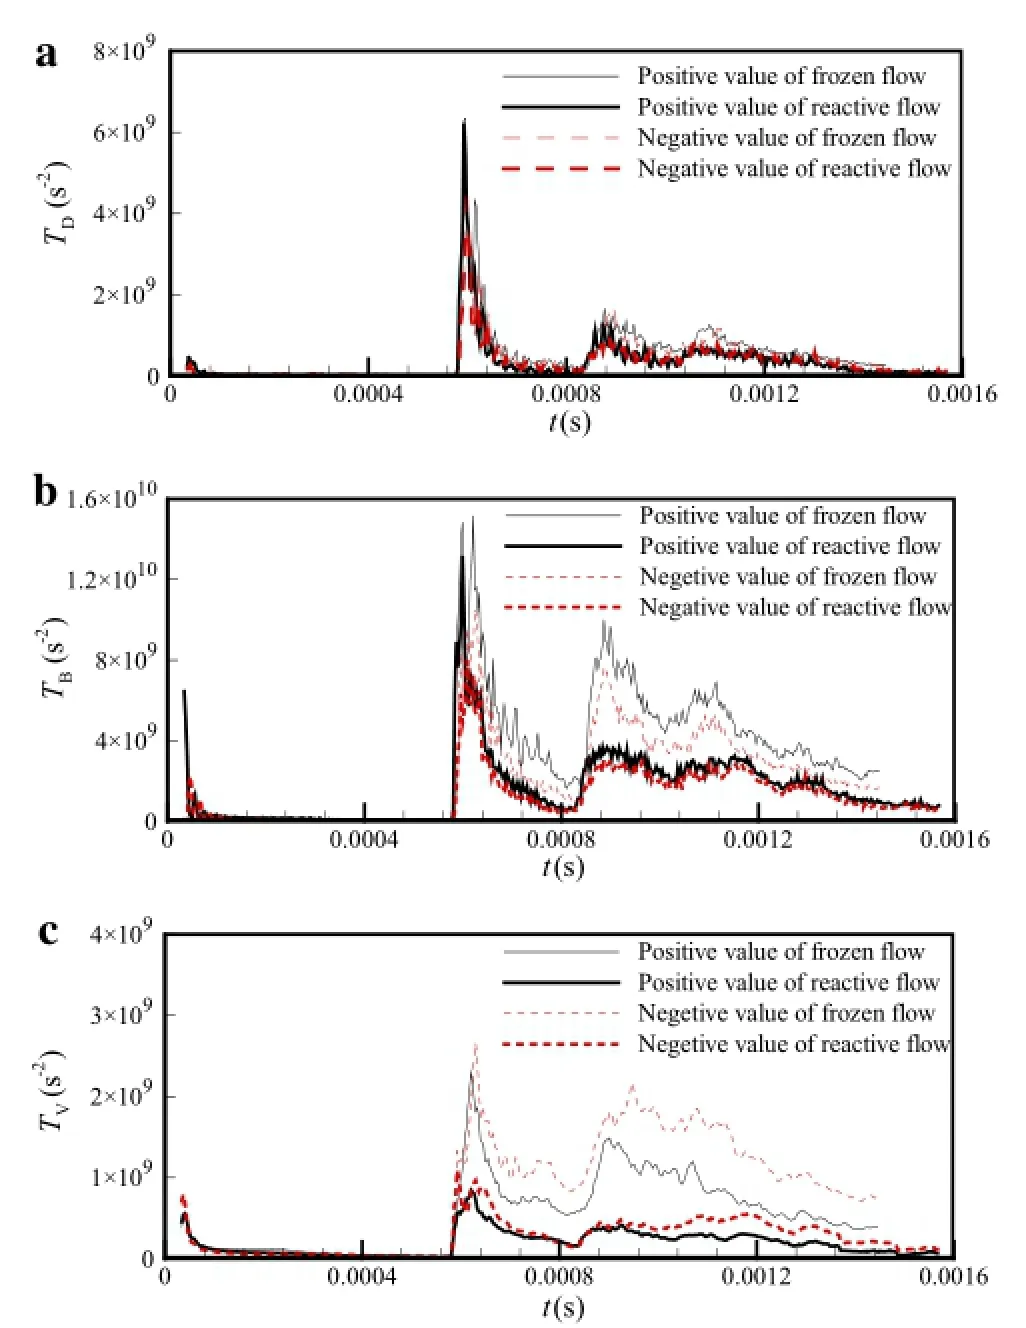
Fig.11(Color online)Time histories of a dilatation term TD,b baroclinic torque term TB,and c viscous term TV;initial perturbation amplitude a0=1.0 mm
where ?,and the subscript F+is the same as that in Eqs.(13)-(15).One can see from Fig.12 that the ? in reactive flow is always low?er than that in frozen flow;in particular,the difference in between reactive and frozen flows is increasingly obvious after the occurrence of RSWs.Obviously,chemical consumption of the reactant reduces the mixing area between reactant and product with different densities and,thus,weakens the density gradient. Theresultconfirmsthattheinhibitionofvorticityproduction in reactive flow is mainly due to the decrease in baroclinic torque through a weakening of the density gradient.
4 Conclusions
Based on two-dimensional compressible Navier-Stokes equations with a single-step chemical reaction and a highresolutionninth-orderWENOscheme,multipleshock-flame interactions are numerically studied for three different initial perturbed amplitudes(a0=0.2,0.5,and 1.0 mm)on a sinusoidally perturbed flame interface.Two-dimensional visualized pictures and several integrated quantities are used to analyze the perturbation developments on a flame interface when multiple shock waves successively impact the interface.The interactions in the frozen flow case are also simulated for the purpose of comparison with those in reactive flow.

Fig.12 Time histories of mean magnitude of density gradient
The results show that before the first RSW,perturbation developments on the flame interface are closely related to the large-scale vortex structures caused by the RMI,which is directly affected by the initial perturbed amplitude.The larger the initial perturbed amplitude,the higher the vorticity deposition,which leads to faster growth of the mixing zonewidthandthemixingarea.FollowingRSWs,small-and medium-scale vortex structures occur in the flame mixing region.These finer vortex structures promote local mixing in the flame region.Owing to the multiple compressions of the RSWs and enhanced mixing,chemical reaction gradually plays a dominant role after the RSWs and inhibits the effect of the initial perturbed amplitude.The consumption of reactant further reduces the density gradient on the flame interface,thereby decreasing the baroclinic torque and subsequently weakening the vorticity in the flame region.As a result,the weakness of the vortex structures delays the loss of symmetry of the spike of the flame interface and leads to a continuousstretchingofthespikeinthestreamwisedirection and subsequent burn-out of the top part of the spike.
AcknowledgmentsThis project was supported by the National Natural Science Foundation of China(Grant 11372140).
References
1.Richtmyer,R.D.:Taylor instability in shock acceleration of compressible fluids.Commun.Pure Appl.Math.13,297-319(1960). doi:10.1002/cpa.3160130207
2.Meshkov,E.E.:Instability of the interface of two gases accelerated by a shock wave.Fluid Dyn.4,101-104(1969).doi:10.1007/ BF01015969
3.Brouillette,M.:The richtmyer-meshkov instability.Ann.Rev. Fluid Mech.34,445-468(2002).doi:10.1146/annurev.fluid.34. 090101.162238
4.Yang,J.,Kubota,T.,Zukoski,E.E.:Applicationsofshock-induced mixing to supersonic combustion.AIAA J.31,854-862(1993). doi:10.2514/3.11696
5.Roy,G.D.,Frolov,S.M.,Borisov,A.A.,et al.:Pulse detonation propulsion:Challenges,current status,and future perspective. Progr.Energy Combust.Sci.30,545-672(2004).doi:10.1016/j. pecs.2004.05.001
6.Oran,E.S.,Gamezo,V.N.:Origins of the deflagration-todetonation transition in gas-phrase combustion.Combust Flame 148,2006(2007).doi:10.1016/j.combustflame.07.010
7.Markstein,G.H.:Nonsteady Flame Propagation.AgarDograph. Pergamon Press,Oxford(1964)
8.Thomas,G.O.,Bambrey,R.,Brown,C.:Experimentalobservations of flame acceleration and transition to detonation following shockflame interaction.Combust.Theory Model.5,573-594(2001). doi:10.1088/1364-7830/5/4/304
9.Gui,M.Y.,Fan,B.C.,Dong,G.,et al.:Experimental and numerical studies on interactions of a spherical flame with incident and reflected shocks.Acta Mechanica Sinica 25,173-179(2009). doi:10.1007/s10409-008-0202-x
10.Haas,J.F.,Sturtevant,B.:Interaction of weak shock waves with cylindrical and spherical gas inhomogeneities.J.Fluid Mech.181,41-76(1987).doi:10.1017/S0022112087002003
11.Khokhlov,A.M.,Oran,E.S.,Thomas,G.O.:Numerical simulation of deflagration-to-detonation transition:The role of shock-flame interactions in turbulent flames.Combust.Flame 117,323-339(1999).doi:10.1016/S0010-2180(98)00076-5
12.Khokhlov,A.M.,Oran,E.S.:Numerical simulation of detonation initiation in a flame brush:the role of hot spots.Combust.Flame 119,400-416(1999).doi:10.1016/S0010-2180(99)00058-9
13.Khokhlov,A.M.,Austin,J.,Pintgen,F.,et al.:Numerical study of the detonation wave structure in ethylene-oxygen mixtures.AIAA Paper 42,792(2004).doi:10.2514/6.2004-792
14.Gamezo,V.N.,Khokhlov,A.M.,Oran,E.S.:Theinfluence of shock bifurcations on shock-flame interactions and DDT.Combust.Flame 126,1810-1826(2001).doi:10.1016/ S0010-2180(01)00291-7
15.Gamezo,V.N.,Oran,E.S.,Khokhlovb,A.M.:Three-dimensional reactive shock bifurcations.Proc Combust.Inst.30,1841-1847(2005).doi:10.1016/j.proci.2004.08.259
16.Dong,G.,Fan,B.C.,Ye,J.F.:Numerical investigation of ethylene flame bubble instabilityinduced by shock waves.Shock Waves 17,409-419(2008).doi:10.1007/s00193-008-0124-3
17.Dong,G.,Fan,B.C.,Gui,M.Y.,et al.:Numerical simulations of interactions between a flame bubble with an incident shock wave and its focusing wave.Proc.Inst.Mech.Eng.Part C 223,2357-2367(2009).doi:10.1243/09544062JMES1467
18.Gui,M.Y.,Fan,B.C.,Dong,G.,et al.:Experimental and numerical studies on interactions of a spherical flame with incident and reflected shocks.Acta Mechanica Sinica 25,173-179(2008). doi:10.1007/s10409-008-0202-x
19.Zhu,Y.J.,Dong,G.,Jiang,H.,et al.:Effect of chemical reactivity on the detonation initiation in shock accelerated flow in a confinedspace.ActaMechanicaSinica29,54-61(2013).doi:10.1007/ s10409-013-0059-5
20.Khokhlov,A.M.,Oran,E.S.,Chtchelkanova,A.Y.,et al.:Interactionofashockwithasinusoidallyperturbedflame.Combust.Flame 117,99-116(1999).doi:10.1016/S0010-2180(98)00090-X
21.Kilchyk,V.,Nalim,R.,Merkle,C.:Laminar premixed flame fuel consumption rate modulation by shocks and expansion waves.Combust.Flame 158,1140-1148(2011).doi:10.1016/j. combustflame.2010.10.026
22.Massa,L.,Jha,P.:LinearanalysisoftheRichtmyer-Meshkovinstability in shock-flame interactions.Phys.Fluids 24,056101(2012). doi:10.1063/1.4719153
23.Zhu,Y.J.,Dong,G.,Liu,Y.X.:Three-dimensional numerical simulations of spherical flame evolutions in shock and reshock acceleratedflows.Combust.Sci.Technol.185,1415-1440(2013). doi:10.1080/00102202.2013.798656
24.Balsara,D.S.,Shu,C.W.:Monotonicitypreservingweightedessentially non-oscillatory schemes with increasingly high order of accuracy.J.Comput.Phys.160,405-452(2000).doi:10.1006/jcph. 2000.6443
25.Shu,C.W.:Efficient implementation of essentially non-oscillatory shock-capturing schemes.J.Comput.Phys.77,439-471(1988). doi:10.1016/0021-9991(88)90177-5
26.Latini,M.,Schilling,O.,Don,W.S.:Effects of WENO flux reconstruction order and spatial resolution on reshocked twodimensionalRichtmyer-Meshkovinstability.J.Comput.Phys.221,805-836(2007).doi:10.1016/j.jcp.2006.06.051
27.Zhang,Y.T.,Shi,J.,Shu,C.W.,et al.:Numerical viscosity and resolution of high-order weighted essentially nonoscillatory schemes for compressible flows with high Reynolds numbers.Phys.Rev.E 68,046709(2003).doi:10.1103/PhysRevE.68.046709
28.Latini,M.,Schilling,O.,Don,W.S.:Effects of WENO flux reconstruction order and spatial resolution on reshock two-dimensional Richtmyer-Meshkov instability.J.Comput.Phys.221,805-836(2007).doi:10.1016/j.jcp.2006.06.051
29.Shi,J.,Zhang,Y.T.,Shu,C.W.:Resolution of high order WENO schemes for complicated flow structures.J.Comput.Phys.186,690-696(2003).doi:10.1016/S0021-9991(03)00094-9
30.Ukai,S.,Balakrishnan,K.,Menon,S.:Growth rate predictions of single-and multi-mode Richtmyer-Meshkov instability with reshock.Shock Waves 21,533-546(2011).doi:10.1007/ s00193-011-0332-0
31.Leinov,E.,Malamud,G.,Elbaz,Y.,etal.:Experimentalandnumerical investigation of the Richtmyer-Meshkov instability under re-shock conditions.J.Fluid Mech.626,449-475(2009).doi:10. 1017/S0022112009005904
32.Jiang,H.,Dong,G.,Chen,X.:Numerical study on the effects of small-amplitude initial perturbations on RM instability.Acta Mechanica Sinica 46,544-552(2014).doi:10.6052/ 0459-1879-13-347.(in Chinese)
33.Collins,B.D.,Jacobs,J.W.:PLIFflowvisualizationand measurements of the Richtmyer-Meshkov instability of an air/SF6interface.J.FluidMech.464,113-136(2002).doi:10.1017/ S0022112002008844
26 May 2015/Revised:25 October 2015/Accepted:22 November 2015/Published online:27 April 2016
✉ Gang Dong dgvehicle@yahoo.com
1Key Laboratory of Transient Physics,Nanjing University of Science and Technology,210094 Nanjing,China
杂志排行
Acta Mechanica Sinica的其它文章
- Delayed detached eddy simulations of fighter aircraft at high angle of attack
- Plate/shell topological optimization subjected to linear buckling constraints by adopting composite exponential filtering function
- Analytical and finite-element study of optimal strain distribution in various beam shapes for energy harvesting applications
- The comparative analysis of rocks’resistance to forward-slanting disc cutters and traditionally installed disc cutters
- Modal parameter identification of flexible spacecraft using the covariance-driven stochastic subspace identification(SSI-COV)method
- New method for oblique impact dynamics research of a flexible beam with large overall motion considering impact friction force
