A Complex Network Model for Analyzing Railway Accidents Based on the Maximal Information Coefficient∗
2016-05-10FuBoShaoandKePingLi
Fu-Bo Shaoand Ke-Ping Li
State Key Laboratory of Rail Traffic Control and Safety,Beijing Jiaotong University,Beijing 100044,China
1 Introduction
In the past several decades,railway transportation has been developing on an unprecedented scale due to its economy,punctuality,and low pollution et al.Many advanced information,control and communication technologies have been applied into the railway system.Although the technology of railway is developing and the number of railway accidents is declining,there are also some more serious accidents happening,such as derailments and collisions.Railway accidents may result in immeasurable injuries or fatalities.Thus,much more attentions are still required to be paid to improve railway safety.Methods for analyzing railway accidents become particularly urgent and important.
To better analyze accidents,various traditional models are proposed and accidents are usually denoted as a complicated system phenomenon.[1]Traditionally,there are three kinds of accident models:the epidemiological accident model,the sequential accident model,and the systemic accident model.Accident events are regarded as the spreading procedure of a disease by the epidemiological accident model.That is,results and factors happen to exist together in space and time.[2−3]The sequential accident model[4]regards accident causation as a chain of discrete events occurring in a particular temporal order,and the cause-e ff ect relationship among consecutive events is assumed to be linear and deterministic.But,accident causation in modern socio-technical systems cannot be comprehensively explained by the sequential accident model.[5]The third kind of model is the systematic accident model and the main methods include Accimap,HFACS,and STAMP.[6]Accimap is used to identify and contact the errors among six socio-technology levels based on the Rasmussen’s risk management framework.[7]And some accident classification analysis methods are added into the Reason’s Swiss cheese model in HFACS.[8]STAMP applies the control theory and system dynamics methods to explain these errors which lead to accidents.[9]
Besides above traditional models,some other methods,such as data mining[10−12]and complex network model,[13]are also used to accident analysis.And the complex network model is a new approach used to analyze railway accidents.But,the edges are randomly generated between factors in Ref.[13],rather than considering correlations of factors.
In fact,factors affecting railway accidents are likely to be from different sub-systems of the railway system,such as the control sub-system,the signal sub-system,the vehicle sub-system,and the electric sub-system.In order to construct the complex network model with so many factors,a measure of dependence for pairs of variables is firstly needed.
The maximal information coefficient(MIC)is a good measure of dependence for two-variable relationships due to its two good properties:generality and equitability.[14−18]Generality means that,with sufficient sample size,MIC can capture a wide range of interesting associations,not limited to specific functional types.Equitability means that MIC gives similar scores to equally noisy relationships of different types.MIC has been applied to many fields to look for important two-variable relationships,such as pharmacogenomics,[19]biology,[20]and environment.[21]And some valuable and important results have been obtained.Although MIC has these advantages,some researchersquestion MIC.The focuses of controversy are mainly on the power[22−23]and equitability[24−25]of MIC.Reshef et al.[14,16]respond these comments about his research work[15]and emphasize that the focus of MIC is data exploration rather than the maximal power of the existence or non-existence of relationships.The application scenario of data exploration is emphasized.
With MIC,the strength of dependence between any two factors can be measured.Then nodes denote factors in fluencing railway safety and edges are generated between two factors of which the MIC value is larger than or equal to the dependent criterion.The complex network model for railway accident analysis can be obtained.
Complex network can well describe real world with many factors and the development of complex network is driven by practical demands.Real networks,which are usually with complex topological features,have become one of the most important topics in the research of complex systems.[26−28]The new development of complex network is largely inspired by the empirical study of real-world networks such as world wide web,[29]social network,[30]and epidemiology.[31]
The aim of this paper is to design a complex network model for railway accident analysis.With the model,important influencing factors of railway accidents will be identified.In addition,as the increasing of dependent criterion,the variety of the network structure will also be studied.Firstly,MIC,a good measure of dependence for pairs of variables,is introduced as the measurement of edges generating.Afterwards,with the variation of dependence between factors,the variety of the network structure is presented.Moreover,the most important factors can be identified.More specially,the contributions of this paper are as follows.
(i)A complex network model for railway accident analysis is proposed.The node is the factor of railway accidents.The edge is generated according to the value of MIC which is introduced to measure the dependence for pairs of variables.
(ii)The variety of the railway accident network structure is studied.In the proposed complex network model,there is a parameter θ,which is like a filter,to measure the dependent strength between two factors.If the MIC value of two factors is larger than or equal to θ,there is an edge linking the two factors.Otherwise,there is no edge.As the variation of the parameter θ,that is the dependent criterion,the variety of the proposed railway accident network structure is studied.
(iii)The important factors are identified by employing the proposed complex network model.With the increasing of the dependent criterion θ,for railway accidents,these more important factors are identi fied and those not very important factors are filtered out.
The paper is organized as follows.Firstly,in Sec.2,the maximal information coefficient(MIC)is introduced.Then the complex network model for railway accident analysis is given in Sec.3.The data set used to analyze railway accidents is described and preprocessed in Sec.4.Section 5 presents some results based on the analysis of the proposed complex network.At last,conclusions are drawn in Sec.6.
2 The Maximal Information Coefficient(MIC)
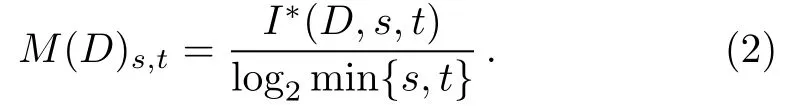
The definition of the maximal information coefficient(MIC),a good criterion to measure correlations between two factors,is firstly proposed by Reshef et al.[15]D is a finite set of ordered pairs,D={(x,y)|x is correlated or non-correlated with y}.The scale of the data set D is n,i.e.,n=|D|.The x-values of D are partitioned into s bins and the y-values are divided into t bins.Then an s-by-t grid G is obtained.DGdenotes the distribution induced by the points in D on the cells of G.In other words,the probability mass in each cell of G is the fraction of points in D falling in that cell.Given a fixed finite data setand the fixed positive integers s,t,

where the maximum is over all grids G with s columns and t rows,and I(DG)is the mutual information of DG.[15]Normalizing by log2min{s,t},the entry of the characteristic matrix is given as follows.
At last,the maximal information coefficient(MIC)of the set D of ordered pairs is obtained.

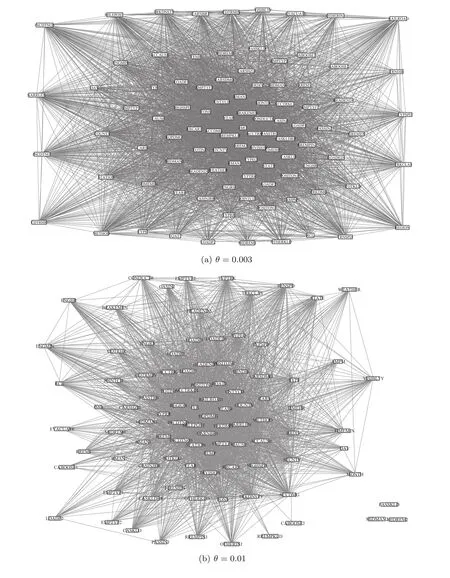
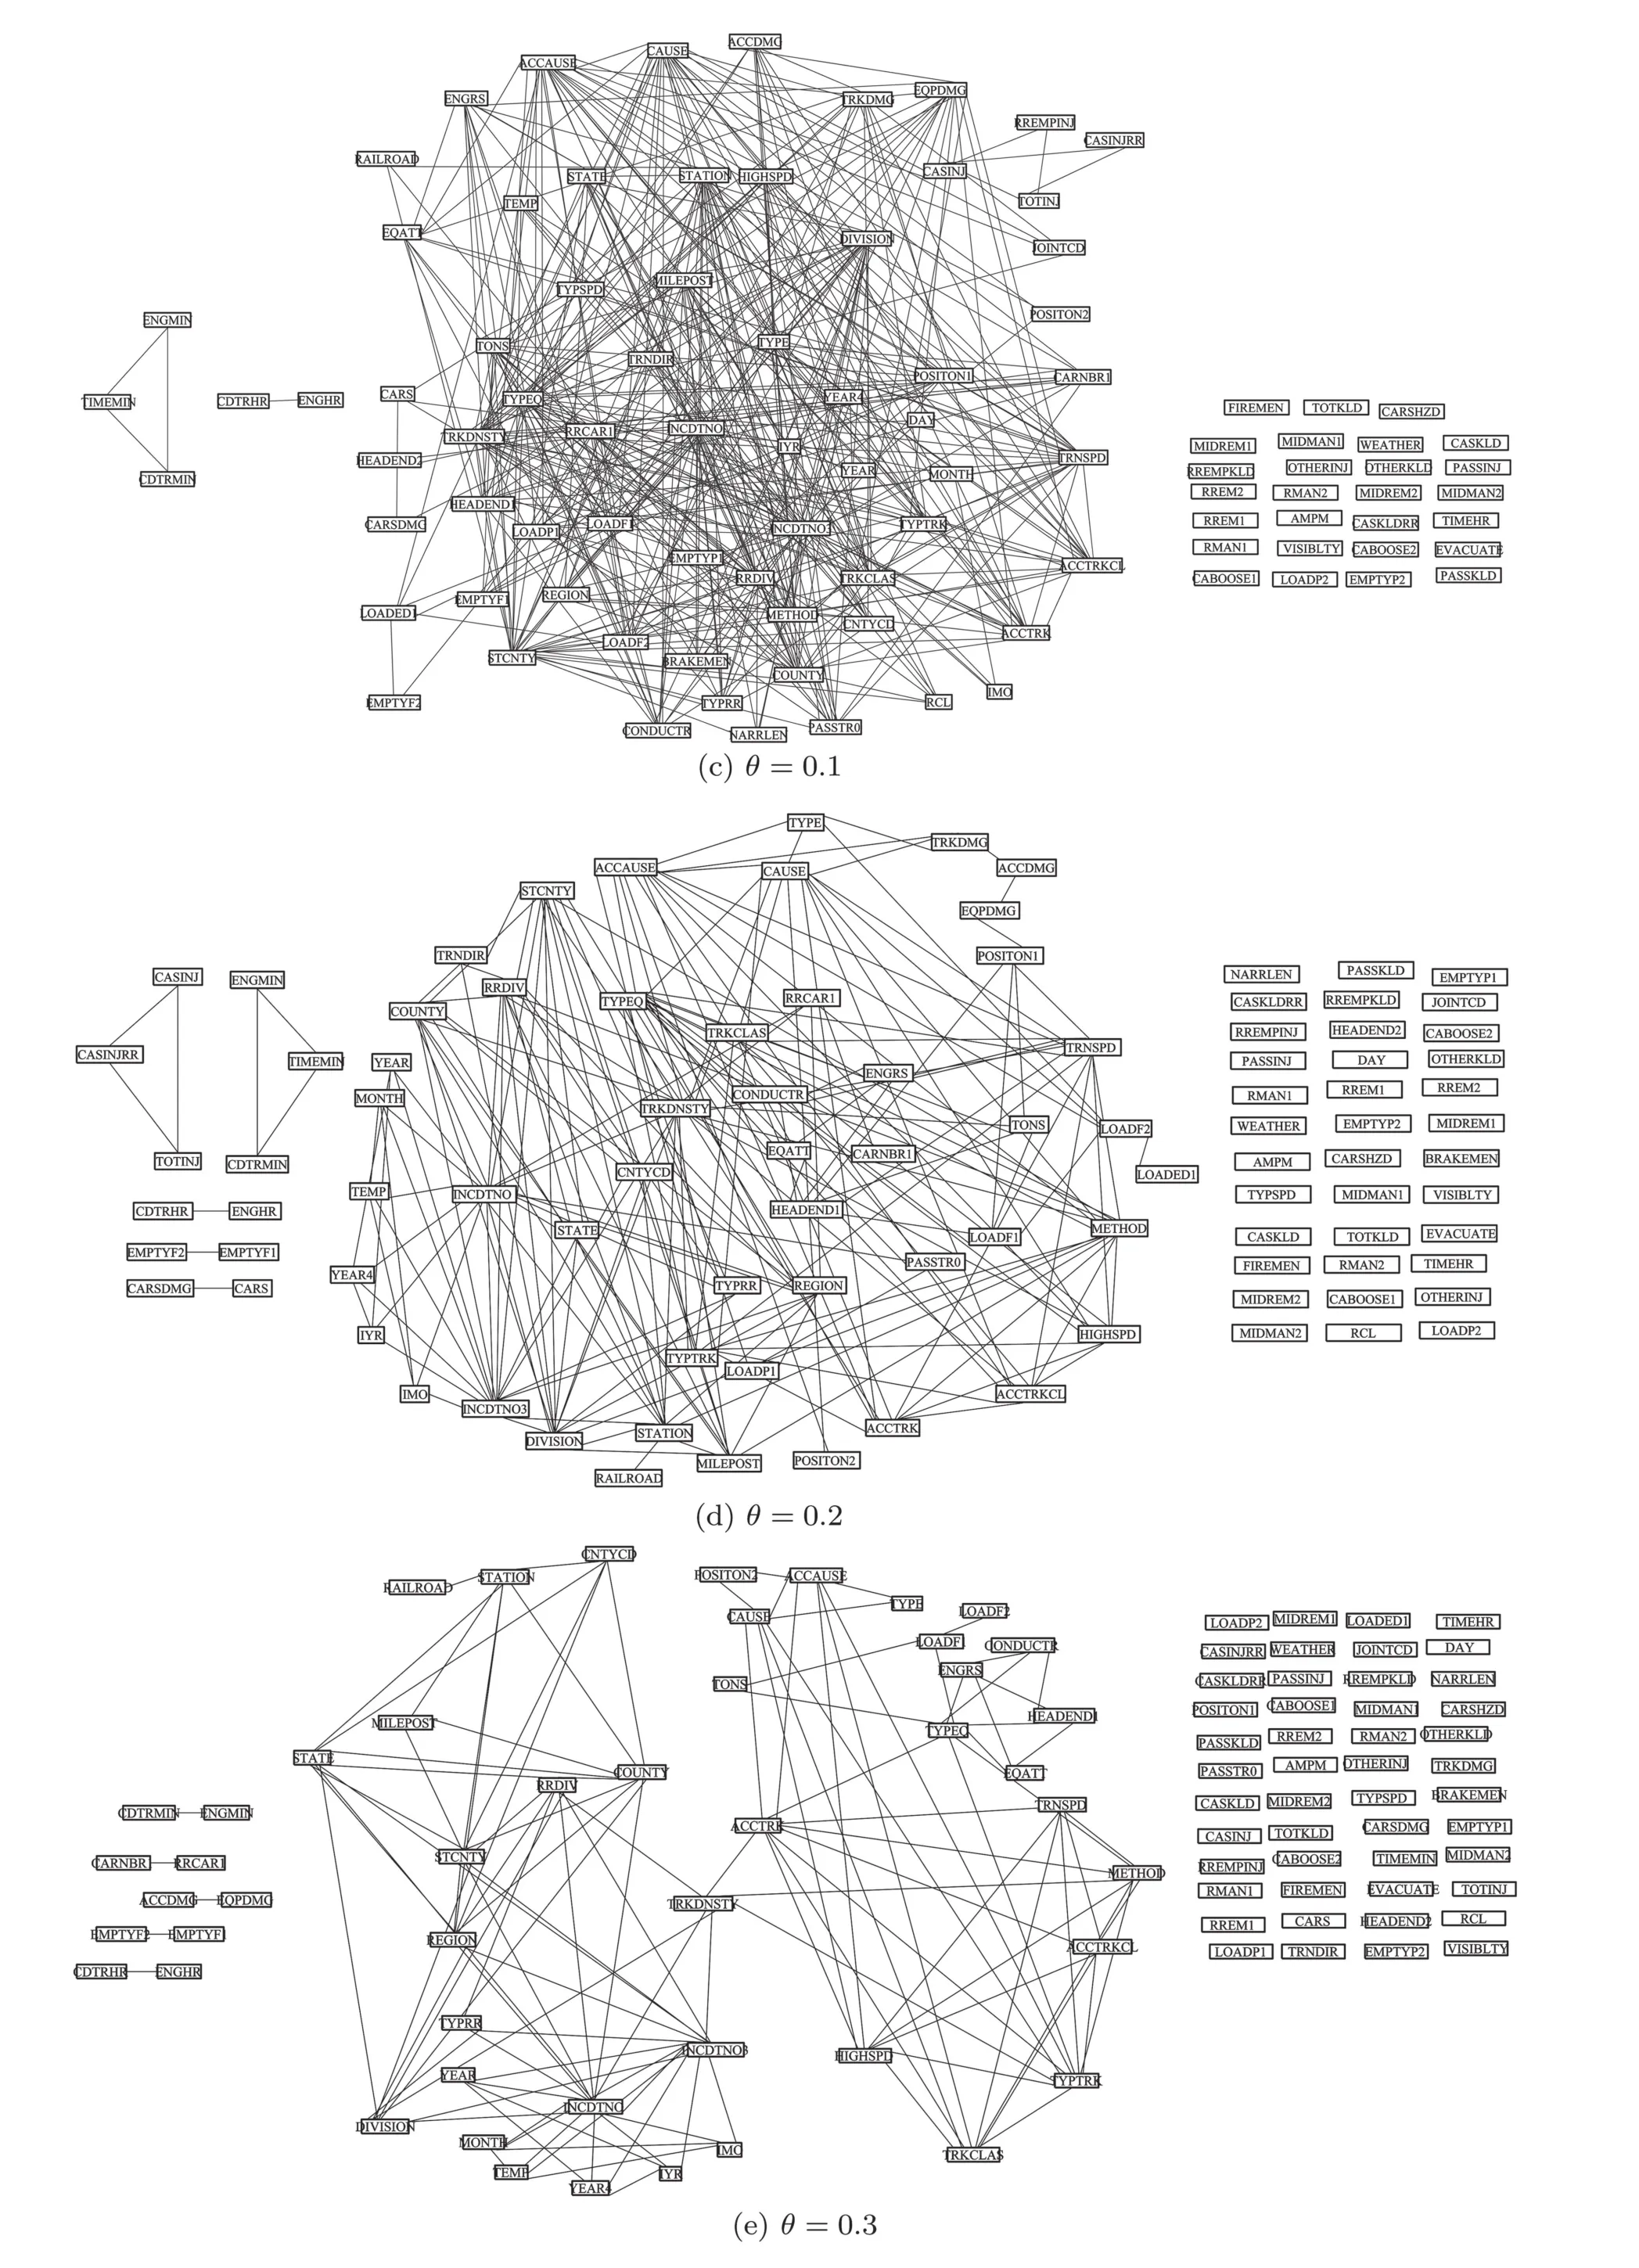
where the grid size is less than or equal to B(n),i.e.,st≤ B(n),and ω(1) The MIC value of the data set D is used to measure the correlation between the two factors,x and y,in the data set D.Higher the MIC value is,more dependent the two factors,x and y,are.From the definition of MIC,we know that the interval of MIC is[0,1].[15] The complex network is usually described as an ordered pair(V,E),where V denotes the set of N nodes,v1,v2,...,vN,and E is the set of edges.If there is an edge linking the node viand the node vj,(vi,vj)is an element of set E.Otherwise,(vi,vj)is not the element of E.Specially,in the constructed complex network for the railway accident analysis,a node denotes an influencing factor in railway accidents and an edge denotes that there is a dependent relationship between the two nodes of the edge.The proposed complex network model is constructed based on the following assumptions. Assumption 1Edges of the constructed complex network model can denote a wide range of dependent relationships due to the generality property of MIC.Generality means that,with sufficient sample size,MIC can capture a wide range of relationships of two variables.In the data set of railway accidents,there are many factors,and among these factors,there are various types of relationships of two factors.The sample size of rail equipment accidents data set from 2004 to 2013(the size is 16383)is large enough for MIC to capture a wide range of relationships of two factors.In Ref.[15],when the size of data set is 320,MIC can capture a wide range of relationships.Thus,the assumption is sensible. Assumption 2The constructed complex network is unweighted.If the MIC value of two factors is large enough(larger than or equal to the dependent criterion θ),there is an edge linking the two factors.Otherwise,there is no edge.All edges(relationships)in the constructed complex network are treated equally important and the weights of all edges are equal. In the constructed complex network,nodes denote factors of railway accidents and edges are generated according to MIC values as above mentioned in Assumption 2.Suppose that,there are N factors in railway accidents,that is,there are N nodes in the complex network.The constructed complex network is denoted as G=(V,E),where V is the set of nodes,v1,v2,...,vN,and E is the set of edges linking two nodes in V.And E is usually described with N×N square adjacency matrix A.For the unweighted complex network,if the element Aijis equal to 1,there is an edge linking the node viand the node vj.Otherwise,there is no edge. In the constructing process of the complex network,the edge linking two factors is generated according to the MIC value of the two factors.If the value of MIC of two factors is larger than or equal to the dependent criterion θ,there is an edge linking these two factors.Otherwise,there is no edge.With the increasing of the dependent criterion θ,the most important relationships(edges)of two factors(nodes)are identi fied.The constructing process of the complex network model for railway accident analysis is as follows. Step 0Input. The measurement for the dependent strength between two factors is the parameter θ. Step 1The set V of nodes.Nodes are factors of railway accidents.V={v1,v2,...,vN}. Step 2Calculate MIC values of all relationships between any two factors via employing the program implemented by Albanese et al.[32]Given two factors vi,vj,Mijdenotes the MIC value of the relationship between the two factors.And according to the definition of MIC,Mi,j=Mj,i.The symmetric matrix M is obtained. Step 3Adjacency matrix A.For all elements in the symmetric matrix M,if the element Mijis larger than or equal to the dependent criterion θ,the element Aij=1.Otherwise,Aij=0.The set E of edges is obtained. In the above constructing process of the complex network,MIC is introduced to measure the dependence of two factors.The higher the MIC value of two factors is,the more important the relationship between the two factors is.In the model,the parameter θ,which is like a filter,is the criterion for edges generating.With θ,these relationships,of which the MIC values are less than θ,are discarded.Only the relationships,of which the MIC values are larger than or equal to θ,are preserved.Then,for railway accident damages(or injuries/fatalities),its influencing factors of which the importance is larger than or equal to θ are identified from many factors.In the following analysis,some important results will be presented for different values of θ. The data set,rail equipment accidents of ten years,from 2004 to 2013,is downloaded from the website of Federal Railroad Administration (FRA,http://www.fra.dot.gov).The data set includes reported cases of collisions,derailments,explosions, fires,or other events involving the operation of railroad on-track equipment and involving damages exceeding the reporting threshold for the year reported.And the reporting threshold is periodically adjusted for inflation.This data base is relatively comprehensive.And it is a typical pubic railway safety data base.Many researches are developed based on this data base. The sample size of the data set is 16383 and the number of factors is 146.But,because there are some descriptive factors and classification labels,the original data set should be preprocessed before analyzed.And the procedure of data preprocessing is as follows. Firstly,many descriptive factors in the data set are deleted.And some factors with the same values for all points are also deleted.After that,the sample size is 16383 and the number of factors is 98. Secondly,some classification labels are replaced by numbers.For example,the classification labels,A,B and C,are replaced by 1,2 and 3,respectively.Then the numerical data set is obtained which can be dealt with by the algorithm proposed by Reshef et al.[15] Thirdly,select any two factors and a subset with the two factors is obtained.The sample size of the subset is 16383 and the number of factors is 2.Calculate the MIC value of the subset with two factors.At last,MIC values are calculated.Among these values,we find that the MIC values of all relationships between one factor and any one of the other 97 factors are zero.So this factor is deleted.Then the number of factors is 97. After above three preprocessing steps,the symmetric matrix M is obtained.For a fixed dependent criterion θ,the edges set E of the complex network G is obtained,and the nodes of the complex network are 97 factors.The complex network is constructed,G=(V,E). Based on the proposed complex network and the data set of rail equipment accidents,some interesting results are reported in this section.With the increasing of the dependent criterion θ,some un-important relationships are filtered out,and at the same time,the complex network structure varies from a globally coupled network to isolated nodes. Fig.1 The variety of the complex network structure with the increasing of the dependent criterion θ.When θ=0.003,the network is shown in Fig.1(a),which is close to a globally coupled network.Of course,when θ=0,the network will be exactly globally coupled.As the increasing of θ,θ=0.003,0.01,0.1,0.2,0.3,and 0.4,the number of edges is declining and isolated nodes appear.If θ is larger than or equal to 1,all nodes are isolated.With the increasing of θ,for the fixed node(the investigated factor in railway accident analysis),these not very important edges(relationships)are removed.Given a fixed dependent criterion θ,for the investigated factor,its influencing factors,of which the influence is larger than or equal to the dependent criterion θ,can be identified.Of course,conversely,as the declining of θ,these less important relationships(edges)are added into the network. Firstly,with the increasing of the dependent criterion θ,the variety of the network structure is given in Fig.1 and the degree distribution of nodes is presented in Fig.2.The numbers of the edges in Figs.1(a)–1(f)are 3201,2354,445,202,124,and 79,respectively.When θ=0,the number of edges isand the network is globally coupled.When θ=0.003 in Fig.1(a),the number of edges is 3201,which is close toThat is,Fig.1(a)is approximate to a globally coupled network.The reason is that when the dependent criterion θ is very small,edges will almost be generated between any two nodes(factors)even though the dependent strength of the two factors is very weak.According to Fig.2(a),when θ=0.003,there are 29(29.9%)nodes of which the degrees are not less than 90,and 74(76.3%)nodes of which the degrees are not less than 50.There is only 1(1.0%)node of which the degree is less than 10 and the degree of this node is 5.With the increasing of the dependent criterion θ,those weak relationships between two factors are filtered out and the number of edges has declined.The approximately globally coupled network is decomposed into some sub-networks,even isolated nodes. The variation of the degree distribution of networks is shown in Fig.2.When the dependent criterion θ is very small,such as θ=0.003,0.01,the fitting curve of the degree distribution is upward sloping.However,when the dependent criterion θ becomes larger,such as θ=0.1,0.2,0.3,0.4,the fitting curve is downward sloping.The upward sloping fitting curve implies that there are many nodes with high degrees.As mentioned above,when θ=0.003,76.3%nodes are with not less than 50 degrees.That is most nodes are with high degrees.With the increasing of the dependent criterion θ,the number of nodes with high degrees falls.Most nodes are with low degrees and there are only a small part of nodes with high degrees.The approximate scale-free network appears.The network structure has changed. Secondly,analyze some key factors in rail equipment accidents. In railway accident analysis,there are two types of factors we are most concerned about.One is the cause of accidents,and the other is the damage.In rail equipment accidents, fields related to accident cause include:accident primary cause and accident cause,and fields related to the damage include:rail equipment damage,track,signal,way&structure damage,and total accident damage.different causes may lead to different types of accidents.And different types of accidents will lead to varying degrees of damages. When the dependent criterion θ=0.1,there is only one different factor among influencing factors of the primary cause and accident cause.And when θ=0.2,0.3,0.4,and 0.5,factors influencing the primary cause and accident cause are the same.That is,the two factors,the accident cause and the primary cause,are affected by the same factors.Furthermore,the value of MIC of the relationship between the primary cause and the accident cause is 0.97,which is very close to 1.That is,there is a strong relationship between the primary cause and the accident cause.In other words,we can say that the accident cause is decided by the primary cause.It is consistent with fact. When θ=0.3,0.4,there is an edge between total accident damage and equipment damage,and the node denoting track,signal,way and structure damage is isolated,see Figs.1(e),1(f).When θ=0.2,the accident damage is related with equipment damage and track,signal,way and structure damage,and the track,signal,way and structure damage is related with accident type,total accident damage and primary cause.The equipment damage is related with the car position in train( first involved),see Fig.1(d).When θ=0.003,0.01,0.1,there are more factors related to total accident damage and equipment damage,and the node denoting track,signal,way and structure damage,see Figs.1(a),1(b),and 1(c).With the increasing of the dependent criterion θ,for the investigated factor,the more important influencing factors are identified.The total accident damage is mainly composed of equipment damage,and the equipment damage is impacted by the position of the first involved car. With the increasing of the dependent criterion θ,the designed complex network is decomposed,and for the investigated factor,its relatively important influencing factors are identified. Thirdly,the annual track density-gross tonnage is an important factor which is the cut vertex of the subnetwork in Fig.1(e).Factors of railroad locations,such as railroad division,railroad division and railroad assigned number,are connected to factors of types of track,such as type track code for this incident,method of operation and type of track,through the factor of the annual track density-gross tonnage.This can be explained that the development of railway is unbalanced for different states.Thus different locations are with different track densities.And different classes of track also lead to different track densities.Then track density is the bridge between factors of locations and factors of types of track. Fig.2 The variety of the degree distribution of nodes in the constructed complex network with the increasing of θ.When θ=0.003,0.01,the fitting curve of degree distribution is upward sloping and there are many nodes with high degrees.However,when θ is larger than or equal to 0.1,the fitting curve is downward sloping and most nodes are with low degrees.There are only a small part of nodes with high degrees.This implies that the network structure has changed and these networks describe different realities. In this paper,based on the maximal information coefficient(MIC),a complex network model for railway accident analysis was proposed.In the proposed complex network,nodes denoted accidents factors and edges were generated between two nodes of which the MIC value was larger than or equal to the dependent criterion θ.The variety of network structure was studied.As the increasing of the dependent criterion θ,the network structure had changed and the network varied from the globally coupled network to some sub-networks or even isolated nodes.The fitting curves of degree distribution changed from upward sloping to downward sloping.With the proposed complex network,for the investigated factor,its important influencing factors were identified.From the railway accident analysis,the annual track density-gross tonnage was an important factor which is a cut vertex when the dependent criterion θ=0.3.This fact showed that the development of railway was unbalanced for different states. In the future research,we will study the community structure of the proposed complex network model according to different values of the parameter θ. References [1]N.G.Leveson,Safety Sci.49(2011)55. [2]E.Hollnagel,Barriers and Accident Prevention,Ashgate,Aldershot(2004). [3]P.Underwood and P.Waterson,Acci.Anal.Prev.68(2014)75. [4]T.S.Ferry,Modern Sccident Investigation and Analysis,John Wiley&Sons,Hoboken(1988). [5]Z.H.Qureshi,in Proceedings of the Twelfth Australian Workshop on Safety Critical Systems and Software and Safety-Related Programmable Systems-Volume 86,Australian Computer Society,Inc.,(2007)47. [6]P.M.Salmon,M.Cornelissen,and M.J.Trotter,Safety Sci.50(2012)1158. [7]J.C.Le Coze,Safety Sci.71(2015)123. [8]S.T.Chen,A.Wall,P.Davies,Z.Yang,J.Wang,and Y.H.Chou,Safety Sci.60(2013)105. [9]M.Ouyang,L.Hong,M.H.Yu,and Q.Fei,Safety Sci.48(2010)544. [10]B.Depaire,G.Wets,and K.Vanhoof,Accid.Anal.Prev.40(2008)1257. [11]A.Mirabadi and S.Shari fian,Safety Sci.48(2010)101427. [12]Y.Xie,D.Lord,and Y.Zhang,Accid.Anal.Prev.39(2007)922. [13]X.Ma,K.P.Li,Z.Y.Luo,and J.Zhou,Chin.Phys.B 23(2014)028904. [14]D.N.Reshef,Y.A.Reshef,M.Mitzenmacher,and P.C.Sabeti,arXiv:1301.6314(2013). [15]D.N.Reshef,Y.A.Reshef,H.K.Finucane,et al.,Science 334(2011)1518. [16]D.N.Reshef,Y.A.Reshef,M.Mitzenmacher,and P.C.Sabeti,Proc.Nat.Acad.Sci.USA 111(2014)E3362. [17]F.Shao,K.Li,and Y.Dong,Intelligent Data Analysis 20(2017)597. [18]F.Shao,K.Li,and X.Xu,Intelligent Data Analysis,in press. [19]J.Fan and H.Liu,Advanced Drug Delivery Reviews 65(2013)987. [20]E.E.Schadt,M.D.Linderman,J.Sorenson,L.Lee,and G.P.Nolan,Nature Reviews Genetics 11(2010)647. [21]A.Eiler,K.Zaremba-Niedzwiedzka,M.Mart´ınez-Garc´ıa,K.D.McMahon,R.Stepanauskas,S.G.Andersson,and S.Bertilsson,Environmental Microbiology 16(2014)2682. [22]M.Gor fine,R.Heller,and Y.Heller,Unpublished Manuscript.Available at http://iew3.technion.ac.il/gorfinm/files/science6.pdf(2012). [23]N.Simon and R.Tibshirani,arXiv:1401.7645(2014). [24]J.B.Kinney and G.S.Atwal,Proc.Nat.Acad.Sci.USA 111(2014)3354. [25]J.B.Kinney and G.S.Atwal,Proc.Nat.Acad.Sci.USA 111(2014)E3364. [26]A.L.Barab´asi and R.Albert,Science 286(1999)509. [27]S.H.Strogatz,Nature(London)410(2001)268. [28]D.J.Watts and S.H.Strogatz,Nature(London)393(1998)440. [29]M.Faloutsos,P.Faloutsos,and C.Faloutsos,ACM SIGCOMM Comput.Commun.Rev.Vol.29,ACM 251. [30]M.E.Newman,Proc.Nat.Acad.Sci.USA 98(2001)404. [31]C.Moore and M.E.Newman,Phys.Rev.E 61(2000)5678. [32]D.Albanese,M.Filosi,R.Visintainer,S.Riccadonna,G.Jurman,and C.Furlanello,Bioinformatics 29(2013)407.3 Model
4 Data
5 Results

6 Conclusions
杂志排行

Communications in Theoretical Physics的其它文章
- First-Principles Study of Structural,Magnetic,Electronic and Elastic Properties of PuC2∗
- On d-Dimensional Lattice(co)sine n-Algebra∗
- In fluence of Defects and Crystallographic Orientation on Mechanical Behavior of Nanocrystalline Aluminium∗
- Critical Behavior of Spatial Evolutionary Game with Altruistic to Spiteful Preferences on Two-Dimensional Lattices∗
- Study of Friction between Liquid Crystals and Crystalline Surfaces by Molecular Dynamic Simulations∗
- Relativistic Correction on Neutrino Emission from Neutron Stars in Various Parameter Sets∗