Association mapping of genetic network for plant morphological traits in cotton
2016-05-04

Association mapping of genetic network for plant morphological traits in cotton
MEI Yongjun1†*, YU Jiwen2†, XUE Angli3†, FAN Shuli2, SONG Meizhen2, PANG Chaoyou2, PEI Wenfeng2, YU Shuxun2, ZHU Jun3*
(1.CollegeofPlantScience,TarimUniversity,Alar843300,Xinjiang,China; 2.StateKeyLaboratoryofCottonBiology/KeyLaboratoryofCottonBiologyandGeneticBreedingofMinistryofAgriculture,InstituteofCottonResearch,ChineseAcademyofAgriculturalSciences,Anyang455000,Henan,China; 3.ZhejiangKeyLabofCropGermplasm,CollegeofAgricultureandBiotechnology,ZhejiangUniversity,Hangzhou310058,China)

Key wordscotton; association mapping; morphological traits; epistasis; simple sequence repeat marker
CLC numberQ 348Document codeA
Upland cotton (GossypiumhirsutumL.) is one of the most important economic crops in the world. One of the main objectives for the cotton-producing countries is to improve fiber production. Vegetative growth is the basis for life circle of the plants, which provides the essential nutrition for initiating cotton flowers, bolls, and fiber. Revealing genetic basis and estimating effects for quantitative trait loci (QTLs) related to plant morphological traits[1]by linkage mapping can provide useful information for conducting marker-assisted selection (MAS).
Association mapping is an efficient method for detecting polymorphic genotypes to phenotypic variations, and the genome-wide association study (GWAS) is a special analysis method for association mapping. It can scan the molecular markers of entire genome for particular traits of interest[2-3]. Mapping genetic loci can be performed by using RAPD (random amplification polymorphism DNA), SCAR (sequence characterized amplified region), SSR (simple sequence repeat), and SNP (single nucleotide polymorphism) markers,etc. In this study, we utilized PCR-based molecular markers SSRs, which came mostly from the cotton marker database (CMD).
Linkage mapping has been widely used in cotton among the previous studies. But most of them concentrated on the fiber traits and yield traits, such as micronaire value, lint yield, and boll mass[4-8]. These traits were direct factors related to cotton industry, so the breeders wanted to understand their genetic basis and find ways to improve them. Few works had been reported on plant morphological traits[9-11]. Indirect factors including plant height, stem diameter, and stem node, also influenced the growth of cotton and hence the yield. Therefore, we aimed to dissect the genetic basis, find the QTSs (quantitative trait SSRs) associated to the traits and provide more information for cotton breeding.
In this study, we performed association mapping for 872 marker loci of 39 cultivars and their 178 F1hybrids in three environments. A newly developed software QTXNetwork (http://ibi.zju.edu.cn/software/QTXNetwork/) based on mixed linear model approaches[12]was applied in this study. A full genetic model with genetic effects of additive, dominance, epistasis and their environment interactions was built. The association mapping results revealed the importance of genetic architecture on plant morphological traits in cotton.
1Materials and methods
1.1Parent selection and experimental design
In this study, the mapping population was provided by the Institute of Cotton Research, Chinese Academy of Agricultural Sciences and Tarimu University. These cultivars were representatives of cotton-growing regions in China. Thirty-nine cotton cultivars were sampled and their 178 F1hybrids were analyzed for four morphological traits at three environments (e1: Anyang of Henan Province in 2012; e2: Anyang of Henan Province in 2013; e3: Alar of Xinjiang Autonomous Region in 2012). Anyang of Henan Province located in the Yellow River valley cotton-growing region, and Alar of Xinjiang Autonomous Region located in the northwestward cotton-growing region. For field experiments, a completely randomized block design with three replications was applied. Each block was settled with two rows, and each row was kept in a plot of 5.00 m in length and 0.70 m in width. The distance between plants was 0.25 m in width in Anyang, and 0.10 m in width in Alar. Plant height (PLH), stem diameter (STD), stem first (STF) and stem node (STN) were evaluated to dissect the genetic network of these morphological traits.
1.2DNA extraction and SSR markers screening
Two cotyledons from two plants were collected randomly for each line in the plots in March 2012. DNA from 39 parent samples was extracted according to the method of PATERSONetal.[13]. The sequences of SSR primers, which came mostly from the cotton marker database (CMD, http://www.cottonmarker.org/cgi-bin/panel.cgi), were downloaded to obtain specific information about the markers. This database is an integrated web-enabled database, providing a centralized access to all publicly available cotton microsatellites and single nucleotide polymorphisms, which provides more efficient applications of molecular markers and facilitates basic and applied research in molecular breeding and genetic mapping in cotton. A standard screening panel contained the polymorphic information of upland cotton cultivars and other tetraploid species. Among the 39 lines, there were 5 052 SSR primer pairs in total to be examined for screening polymorphisms. Those markers included DPL, GH, HAU, JESPR, NAU, BNL, CIR, CGR, DC, MUSS, MGHES, C, CER and CM series. The marker nomenclature consisted of a letter that indicated the origin of the marker, followed by the primer number. SSR analysis was carried out according to the procedure proposed by YAOetal.[14]. To sum up, 872 marker loci were obtained to conduct association analysis.
1.3Statistical analysis
To analyze different effect values, a full genetic model was used for the phenotypic value of thek-th individual in theh-th environment (yhk), which can be presented by the following mixed linear model,

(Equation1)
whereμis the population mean; aiis the additive effect of thei-thlocus with coefficient xAik; diis the dominance effect of thei-th locus with coefficient xDik; aaij, adij, daijand ddijare the digenic epistasis effects with coefficients xAAijk, xADijk, xDAijkand xDDijk; ehis the random effect of theh-th environment; aeihis the additive × environment interaction effect of thei-th locus in theh-th environment with coefficient uAEihk; deihis the dominance × environment interaction effect of thei-th locus in theh-th environment with coefficient uDEihk; aaeijh, adeijh, daeijhand ddeijhare the digenic epistasis × environment interaction effects with coefficients uAAEijhk, uADEijhk, uDAEijhkand uDDEijhk; and εhkis the residual effect of thek-th individual in theh-th environment population.
The mixed linear model can be expressed in matrix notation as follows,
y=1μ+XAeA+XDeD+XAAeAA+XADeAD+
XDAeDA+XDDeDD+UEeE+UAEeAE+
UDEeDE+UAAEeAAE+UADEeADE+UDAEeDAE+
UDDEeDDE+eε


(Equation2)

The total heritability can be estimated by the following equation,


(Equation 3)
1.4Association analysis
本刊记者曾在2018年第4期的《中国储运》文章中得出过这样的一个结论:一向以轻资产来运作的阿里其实需要很多重资产的力量,而解决这一问题的重要途径就是通过市场并购来迅速增强企业的重资产比重,提高企业的核心竞争力。

2Results
2.1Estimatedheritabilityandgeneticeffects
Atotalof25experiment-wisesignificantQTSs(PEW-value< 0.05)weredetectedforthefourplantmorphologicaltraits(5-7QTSsforeachtrait)incotton(Fig.1,TableS1availableathttp://www.journals.zju.edu.cn/agr/EN/article/showSupportInfo.do?id=10359).

PLH: Plant height; STD: Stem diameter; STF: Stem first; STN: Stem node. Circle: QTS with additive effect; Square: QTS with dominant effect; Line between two QTSs: Epistasis effect; Red color: QTS with general effects for three environments; Green color: QTS with environment-specific effects; Blue color: QTS with both general and environment-specific effects.Fig.1 G×G plot of detected significant QTSs (PEW-value < 0.05) for four plant morphological traits
Traitsh1A(%)h1D(%)h1I(%)h1AE(%)h1DE(%)h1IE(%)h1T(%)Rr^PLH19.1228.970.004.4920.970.0073.550.81STD29.586.510.0013.3313.660.0063.080.83STF37.552.630.0016.2121.890.0078.280.79STN22.1826.478.074.352.754.5468.360.93

2.2Plantheighttrait

AtotalofsevenQTSsweredetectedforPLH(Fig.1,TableS1availableathttp://www.journals.zju.edu.cn/agr/EN/article/showSupportInfo.do?id=10359).ThereweresevenindividualQTSshighlysignificant(PEW-value< 1×10⁻⁵) (Table2),amongwhichthreeQTSs(GH111-5,GH638-3andJESPR153-6)werefoundwithadditiveeffects.AndtheotherfourQTSsweredetectedwithdominanceeffects.TheGH638-3wasdetectedwithenvironment-specificdominanceeffectsine1,whileNAU1269-3wasdiscoveredwithenvironment-specificadditiveeffectsine1.Nopairepistasisinteractioneffectwasidentified.SelectinggenotypesqqofGH111-5andQQofGH638-3,JESPR153-6fordifferentenvironmentscouldimprovePLH.Duetolargeenvironment-specificdominanceeffect,heterozygoteQqofGH638-3ine1couldincreasePLH.Besides,selectinggenotypeqqofNAU1269-3ine1couldalsoresultinhigherPLH.
Table 2Estimated genetic effects, standard error (SE), significance and heritability for highly significant QTSs (PEW-value < 1×10⁻⁵) of four plant morphological traits

TraitsQTSEffectEstimateSE-lgPEWh1(%)PLHCGR5876-3CGR6719-2GH111-5GH638-3HAU1081-3JESPR153-6NAU1269-3d-2.4700.4996.12.72d2.6670.5705.53.17a-2.1070.3797.61.98a4.4450.33439.58.82de15.7031.1805.99.52d3.9850.6539.07.09a4.0680.33133.87.39d4.0990.55312.97.50ae1-3.0460.44211.21.38STDBNL3569-6CGR5534-3DPL282-1MGHES44-3a 0.0350.0069.13.80a0.0360.0069.33.98d-0.0420.0087.55.37de10.0520.0089.38.91a0.0810.00553.519.89ae1-0.0710.00631.612.96ae30.0880.0167.712.96a-0.0250.0055.71.92
Continuation of Table 2Estimated genetic effects, standard error (SE), significance and heritability for highly significant QTSs (PEW-value <1×10⁻⁵) of four plant morphological traits
TraitsQTSEffectEstimateSE-lgPEWh1(%)STFCGR5704-1DPL268-1DPL0354-1HAU0377-5HAU2119-1JESPR153-5a0.3480.02737.49.23ae1-0.3360.03126.47.14ae30.4100.0698.57.14a0.1770.02710.52.38a0.3630.02642.610.07ae1-0.1590.0307.04.09de1-0.4540.06711.012.10a0.4080.02653.212.70ae1-0.2780.03020.03.60a0.1960.02415.02.92ae1-0.1610.0287.91.38de1-0.4310.05613.89.79STNCGR6150-1CGR6270-2DPL0504-4GH189-1HAU1523-1NAU862-3NAU1221-5a0.2560.0419.32.25d-0.3160.0656.03.44a-0.2950.04510.42.99a0.2320.0466.31.85d0.4880.0779.68.19a0.3540.05310.64.31a-0.3890.04715.95.20ae10.5200.05421.54.35a0.4030.05114.75.58
PLH: Plant height; STD: Stem diameter; STF: Stem first; STN: Stem node.d: Dominance effect;a: Additive effect;de1,ae1andae3are the environment-specific genetic effect in given environments (e1: Anyang in 2012; e3: Alar in 2012).
For STD, a total of five QTSs were detected (Fig.1, Table S1 available at http://www.journals.zju.edu.cn/agr/EN/article/showSupportInfo.do?id=10359). Four highly significant QTSs (PEW-value < 1×10⁻⁵) were listed in Table 2. All the four highly significant QTSs were detected for additive effects. Environment-specific effects were identified for CGR5534-3 byde1and DPL282-1 byae1andae3. Increasing thick diameter of stem could be expected by selecting genotypesQQof BNL3569-6 andqqof MGHES44-3. Selecting genotypesqqof DPL282-1 in e1andQqof CGR5534-3 in e1could also improve this trait due to environment-specific additive/dominance effects.
For STF, there were six QTSs (CGR5704-1, DPL268-1, DPL0354-1, HAU0377-5, HAU2119-1 and JESPR153-5) highly significant with positive additive effects (Fig.1, Table 2). For this trait, additive effects contributed nearly half heritability. In addition, CGR5704-1, HAU2119-1 and JESPR153-5 had environment-specific additive effects in e1and e3, and the same was DPL0354-1 in all three environments. Besides, DPL268-1 was detected with positive effects. Among these six QTSs, all the effects were negative in e1but positive in e3; therefore STF could be reduced via selecting genotypesQQof CGR5704-1, DPL0354-1, HAU2119-1 and JESPR153-5 in e1orqqof CGR5704-1 in e3.
The number of STN was determined by genetic and environmental factors, and had an essential impact on the final plant height. A total of eight QTSs were significantly dissected for STN (Fig.1, Table S1 available at http://www.journals.zju.edu.cn/agr/EN/article/showSupportInfo.do?id=10359). Most genetic effects were contributed by additive and dominance effects, ranging from 22.18% to 26.47% (Table 1). For the highly significant QTSs (Table 2), CGR6270-2 had negative dominance effect, while other six QTSs (CGR6150-1, DPL0504-4, GH189-1, HAU1523-1, NAU862-3 and NAU1221-5) were additive effects. NAU862-3 was discovered with environment-specific additive effect in e1. The only one epistasis was between GH189-1 and NAU1221-5, and environment-specific dominance-additive effect in e1was discovered (Table S1 available at http://www.journals.zju.edu.cn/agr/EN/article/showSupportInfo.do?id=10359), which had the highest heritability in STN. Selecting genotypesqqof DPL0504-4, NAU862-3 orQQof CGR6150-1, GH189-1, HAU1523-1 and NAU1221-5 could increase STN. GenotypeQQof NAU862-3 in e1could also be chosen to further increase STN.
2.4Predicted genetic effects for different genotypes
Based on the estimated genetic effects of each QTS for three environments, the maximum and minimum genotypic effects of the superior lines and superior hybrids were predicted (Table 3). Moreover, the genotypic effects of homozygotes (QQ,qq) and heterozygote (Qq) were also predicted for the four morphological traits in the three environments. For the traits of PLH, STD, STF and STN, the predicted genotypic effects were positive for major-allele homozygoteQQ, but negative for minor-allele homozygoteqq. It was suggested that the selection had the potential to increase plant height, stem diameter, first stem, and stem node. The predicted genotypic effects of heterozygoteQqwere positive for PLH and STN in all environments, but various for STF and STD across the environments, suggesting that the PLH and STN could be improved through hybrid vigor.
Table 3Predicted total genotypic effects across environments (G) and in three environments for genotypes ofQQ,qq,Qq, superior line and superior hybrid for four plant morphological traits
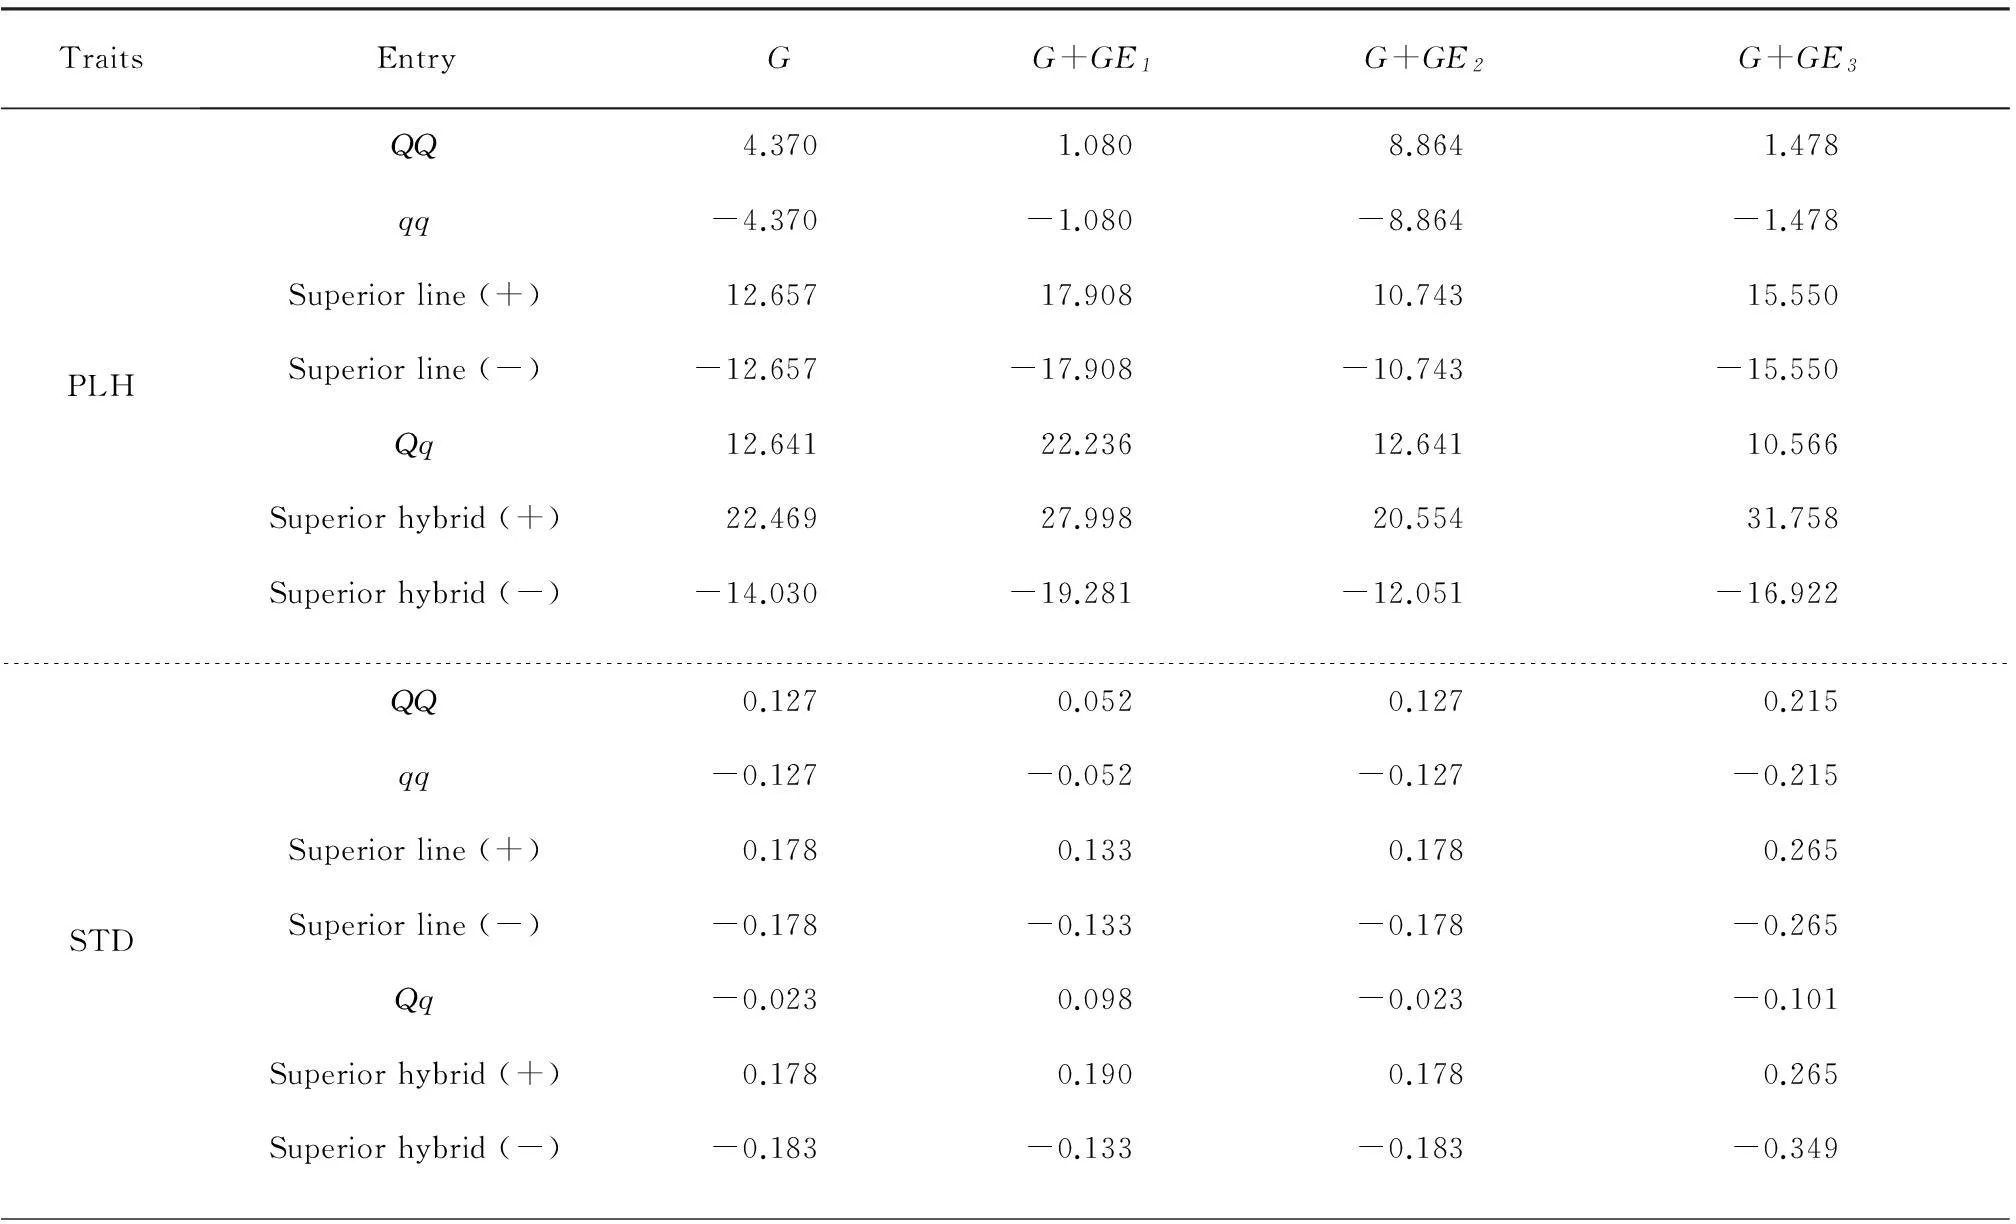
TraitsEntryGG+GE1G+GE2G+GE3PLHQQ4.3701.0808.8641.478qq-4.370-1.080-8.864-1.478Superiorline(+)12.65717.90810.74315.550Superiorline(-)-12.657-17.908-10.743-15.550Qq12.64122.23612.64110.566Superiorhybrid(+)22.46927.99820.55431.758Superiorhybrid(-)-14.030-19.281-12.051-16.922STDQQ0.1270.0520.1270.215qq-0.127-0.052-0.127-0.215Superiorline(+)0.1780.1330.1780.265Superiorline(-)-0.178-0.133-0.178-0.265Qq-0.0230.098-0.023-0.101Superiorhybrid(+)0.1780.1900.1780.265Superiorhybrid(-)-0.183-0.133-0.183-0.349
Continuation of Table 3Predicted total genotypic effects across environments (G) and in three environments for genotypes ofQQ,qq,Qq, superior line and superior hybrid for four plant morphological traits
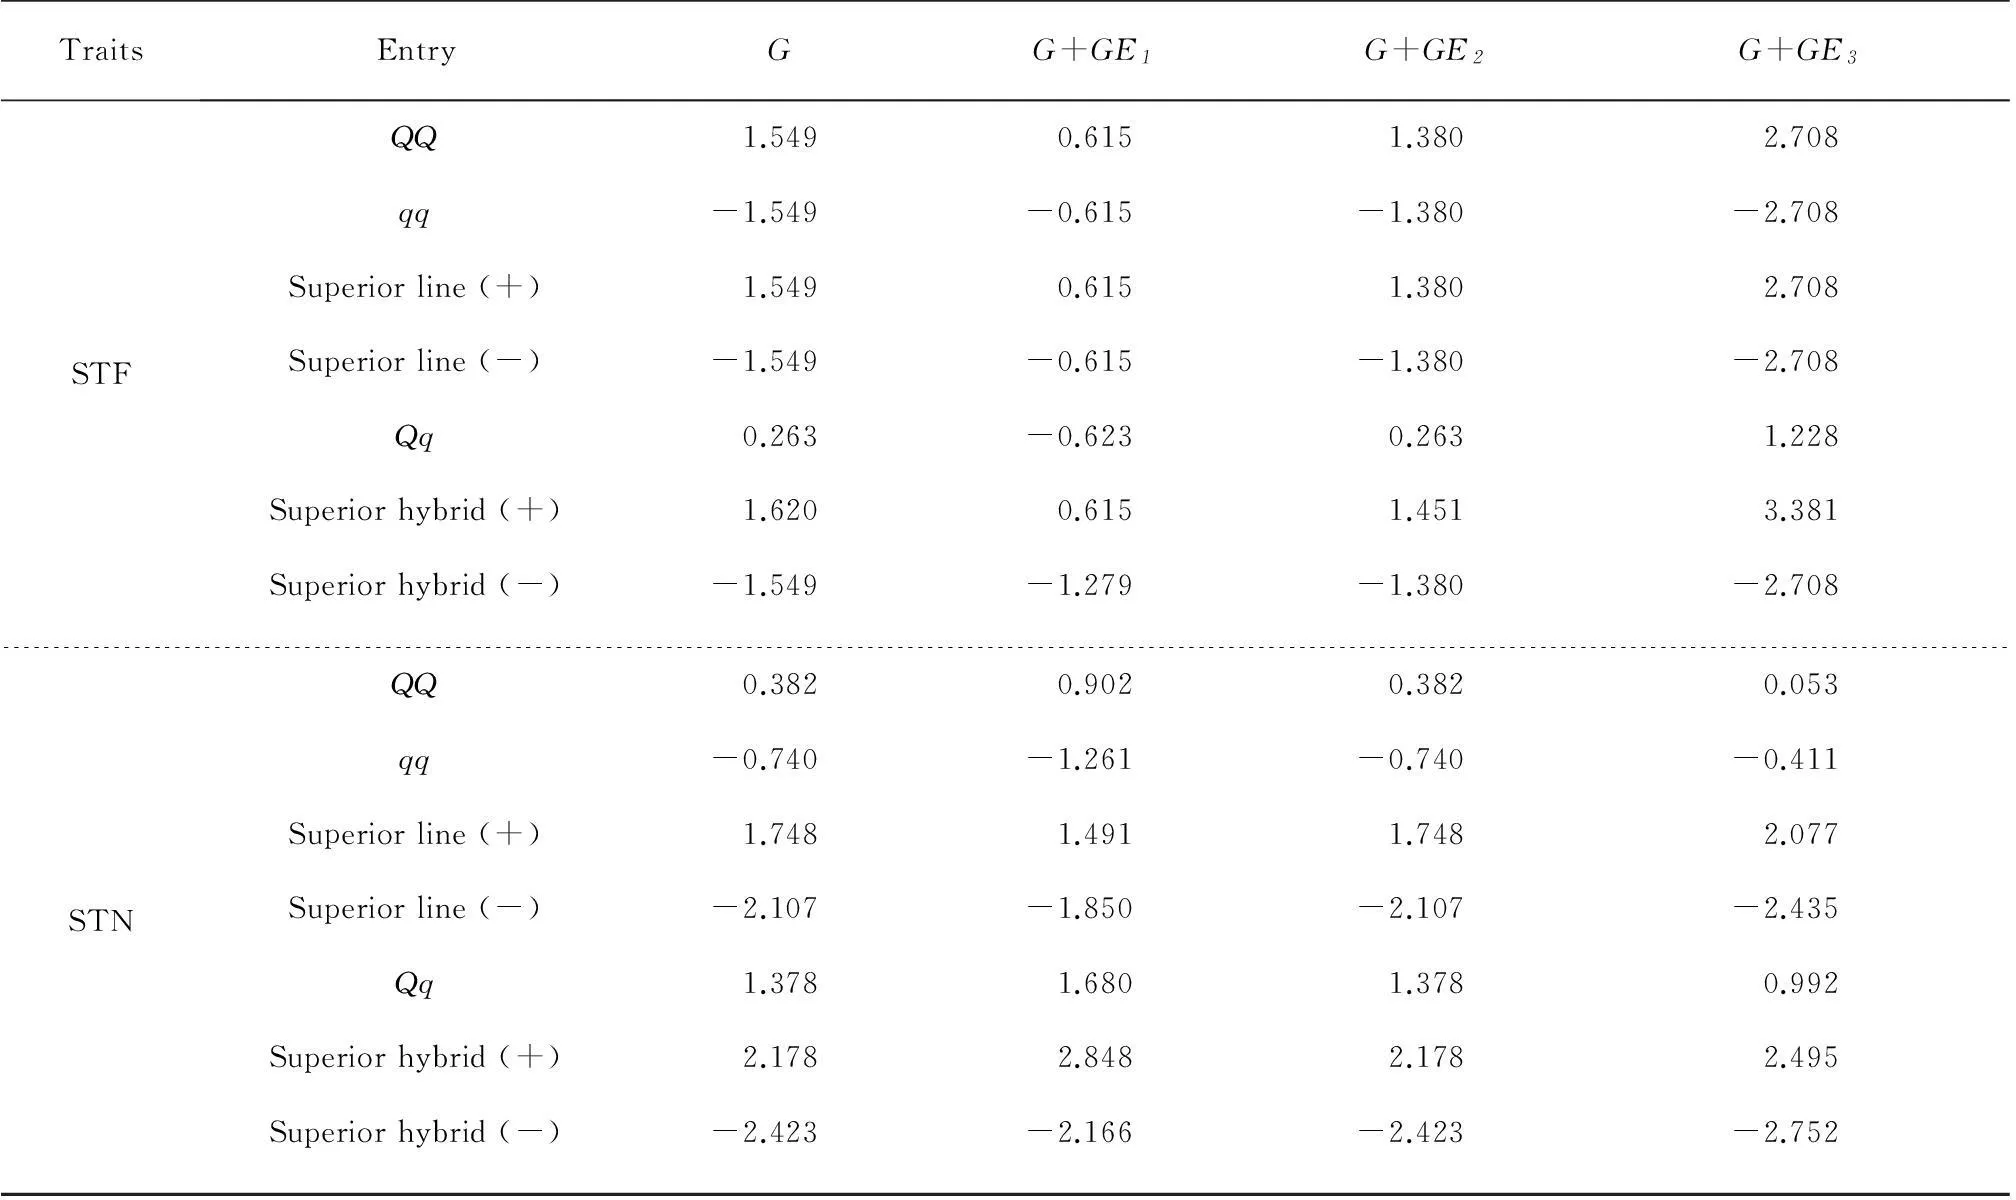
TraitsEntryGG+GE1G+GE2G+GE3STFQQ1.5490.6151.3802.708qq-1.549-0.615-1.380-2.708Superiorline(+)1.5490.6151.3802.708Superiorline(-)-1.549-0.615-1.380-2.708Qq0.263-0.6230.2631.228Superiorhybrid(+)1.6200.6151.4513.381Superiorhybrid(-)-1.549-1.279-1.380-2.708STNQQ0.3820.9020.3820.053qq-0.740-1.261-0.740-0.411Superiorline(+)1.7481.4911.7482.077Superiorline(-)-2.107-1.850-2.107-2.435Qq1.3781.6801.3780.992Superiorhybrid(+)2.1782.8482.1782.495Superiorhybrid(-)-2.423-2.166-2.423-2.752
PLH: Plant height; STD: Stem diameter; STF: Stem first; STN: Stem node.QQ: Homozygote of all loci with major-alleles;qq: Homozygote of all loci with minor-alleles;Qq: Heterozygote of all loci withQq; Superior line: Predicted genotypic effect of line in the selected population with highest values; Superior hybrid: Predicted genotypic effect of hybrid in the selected population with highest values.
These four morphological traits are moderate, and need to be balanced through breeding and cultivation techniques. Except for the superior lines (±) of STF, most of the absolute breeding values of superior lines (±) in the mapping population were larger than those of homozygote genotypesQQandqq. It was indicated that the breeders could increase or decrease three morphological traits (PLH, STN and STD), through selecting superior lines with a mixture of homozygoteQQandqqgenotypes of detected QTSs. And the breeding value of the superior hybrid could also be reinforced for each trait by selecting a hybrid with a mixture of heterozygote (Qq) and homozygotes (QQ,qq).
3Discussion
Association mapping is a powerful tool to dissect quantitative trait loci underlying complex traits, and has been widely used in different studies. But due to the lack of suitable statistical methodology and heavy computational demand, epistasis and environment interaction effects were often missed in current GWAS[18-20]. Ignoring epistasis and environment interaction might lead to biased estimation of effects on loci and lower detecting power[21]. Furthermore, the heritability of target traits would be missed if reduced models were used[22-23]. To solve the computational burden problems, LOUetal.[24]developed a new approach, which combined GPU (graphics processing unit) with GMDR (generalized multifactor dimensionality reduction). GPU could accelerate the operating speed in order to deal with millions of markers, and GMDR was able to detect high dimension interactions.
In this study, the software QTXNetwork was utilized to perform association mapping[12]. QTXNetwork is a software for GPU computation of linkage and association analyses on full genetic model, including epistasis and environment interaction of complex traits based on omics genotypes. Compared with the reduced models used in the previous research, a full mixed linear model (MLM) could dissect total heritability into different parts: additive, dominance, epistasis and their environment interactions. Although diverse softwares such as PLINK[25], TASSEL[26], R[27]were used, and different models including MLM, GLM were applied in previous studies, only the narrow or broad-sense heritability could be calculated[28-31].
Several highly significant QTSs detected by this analysis for morphological traits were also found by other mapping analyses in cotton, which were DPL0504[32], CGR5534[33], NAU1269[34], HAU2119[35], JESPR153[36]. This could validate the efficiency of the mixed linear model approach for association mapping to identify relevant loci for complex traits. Furthermore, we identified different alleles of one SSR that had effects on STF (JESPR153-5) and PLH (JESPR153-6). This provided evidence that some QTSs could have pleiotropic or physiological associations for accelerating the process of MAS programs in cotton breeding. We had also calculated theR-values (correlation coefficient) of the predicted genotypic effects in Table 1. For these four traits, theR-values ranged from 0.79 to 0.93, which were close to the total heritability. It was suggested that the genotypic variation could be predicted very well by the full genetic model.
AcknowledgementsWe are grateful to Prof. YUAN Y L, WANG K B, FU X Q and LIU F from Institute of Cotton Research, Chinese Academy of Agricultural Sciences for providing the primers used in this research.
References:
[1]WILLCOX M C, KHAIRALLAH M M, BERGVINSON D,etal. Selection for resistance to southwestern corn borer using marker-assisted and conventional backcrossing.CropScience, 2002,42(5):1516-1528.
[2]NUSSBAUM R, MCINNES R R, WILLARD H F. Thompson & Thompson genetics in medicine.TheJournaloftheAmericanMedicalAssociation, 1992,267(15):2115.
[3]GIBSON G, MUSE S.APrimerofGenomicScience. 2nd ed. Sunderland, England: Sinauer Associates, 2005:408-409.
[4]JIANG C X, WRIGHT R J, EL-ZIK K M,etal. Polyploid formation created unique avenues for response to selection inGossypium(cotton).ProceedingsoftheNationalAcademyofSciencesoftheUSA, 1998,95(8):4419-4424.
[5]ULLOA M, MEREDITH JR W R. Genetic linkage map and QTL analysis of agronomic and fiber quality traits in an intraspecific population.JournalofCottonScience, 2000,4(3):161-170.
[6]PATERSON A H, SARANGA Y, MENZ M,etal. QTL analysis of genotype × environment interactions affecting cotton fiber quality.TheoreticalandAppliedGenetics, 2003,106(3):384-396.
[7]SUN F D, ZHANG J H, WANG S F,etal. QTL mapping for fiber quality traits across multiple generations and environments in upland cotton.MolecularBreeding, 2012,30(1):569-582.
[8]JIA Y H, SUN X W, SUN J L,etal. Association mapping for epistasis and environmental interaction of yield traits in 323 cotton cultivars under 9 different environments.PLoSONE, 2014,9(5):e95882.
[9]WANG M H, JIANG N, JIA T Y,etal. Genome-wide association mapping of agronomic and morphologic traits in highly structured populations of barley cultivars.TheoreticalandAppliedGenetics, 2012,124(2):233-246.
[10]GUO Y F, MCCARTY J C, JENKINS J N,etal. QTLs for node of first fruiting branch in a cross of an upland cotton,GossypiumhirsutumL., cultivar with primitive accession Texas 701.Euphytica, 2008,163(1):113-122.
[11]LI C Q, SONG L, ZHAO H H,etal. Quantitative trait loci mapping for plant architecture traits across two upland cotton populations using SSR markers.TheJournalofAgriculturalScience, 2014,152(2):275-287.
[12]ZHANG F T, ZHU Z H, TONG X R,etal. Mixed linear model approaches of association mapping for complex traits based on omics variants.ScientificReports, 2015(5):10298.
[13]PATERSON A H, BRUBAKER C L, WENDEL J F. A rapid method for extraction of cotton (Gossypiumspp.) genomic DNA suitable for RFLP or PCR analysis.PlantMolecularBiologyReporter, 1993,11(2):122-127.
[14]YAO J, WANG L X, LIU L H,etal. Association mapping of agronomic traits on chromosome 2A of wheat.Genetica, 2009,137(1):67-75.
[15]SEARLE S R, CASELLA G, MCCULLOCH C E.VarianceComponents. Hoboken, USA: John Wiley & Sons, 2009:208-218.
[16]YANG J, ZHU J, WILLIAMS R W. Mapping the genetic architecture of complex traits in experimental populations.Bioinformatics, 2007,23(12):1527-1536.
[17]YANG J, ZHU J. Methods for predicting superior genotypes under multiple environments based on QTL effects.TheoreticalandAppliedGenetics, 2005,110(7):1268-1274.
[18]CARLBORG O, HALEY C S. Epistasis: Too often neglected in complex trait studies?NatureReviewsGenetics, 2004,5(8):618-625.
[19]JIM O A, RUTTEN B P F. Gene-environment-wide interaction studies in psychiatry.AmericanJournalofPsychiatry, 2009,166(9):964-966.
[20]MANOLIO T A, COLLINS F S, COX N J,etal. Finding the missing heritability of complex disease.Nature, 2009,461:747-753.
[21]CULVERHOUSE R, SUAREZ B K, LIN J,etal. A perspective on epistasis: Limits of models displaying no main effect.AmericanJournalofHumanGenetics, 2002,70(2):461-471.
[22]BRACHI B, MORRIS G P, BOREVITZ J O. Genome-wide association studies in plants: The missing heritability is in the field.GenomeBiology, 2011,12(10):5-7.
[23]ZUK O, HECHTER E, SUNYAEV S R,etal. The mystery of missing heritability: Genetic interactions create phantom heritability.ProceedingsoftheNationalAcademyofSciencesoftheUSA, 2012,109(4):1193-1198.
[24]LOU X Y, CHEN G B, YAN L,etal. A Generalized combinatorial approach for detecting gene-by-gene and gene-by-environment interactions with application to nicotine dependence.AmericanJournalofHumanGenetics, 2007,80(6):1125-1137.
[25]PURCELL S, NEALE B, TODD-BROWN K,etal. PLINK: A tool set for whole-genome association and population-based linkage analyses.TheAmericanJournalofHumanGenetics, 2007,81(3):559-575.
[26]BRADBURY P J, ZHANG Z, KROON D E,etal. TASSEL: Software for association mapping of complex traits in diverse samples.Bioinformatics, 2007,23(19):2633-2635.
[27]R Core Team. R: A language and environment for statistical computing. R Foundation for Statistical Computing: Vienna, Austria, 2012. http://www.R-project.org.
[28]MEI H X, ZHU X F, ZHANG T Z. Favorable QTL alleles for yield and its components identified by association mapping in Chinese upland cotton cultivars.PLoSONE, 2013,8(12):e82193.
[29]WANG B H, GUO W Z, ZHU X F,etal. QTL mapping of fiber quality in an elite hybrid derived-RIL population of upland cotton.Euphytica, 2006,152(3):367-378.
[30]KANTARTZI S K, STEWART J M D. Association analysis of fibre traits inGossypiumarboreumaccessions.PlantBreeding, 2008,127(2):173-179.
[31]RAKSHIT A, RAKSHIT S, SINGH J,etal. Association of AFLP and SSR markers with agronomic and fibre quality traits inGossypiumhirsutumL.JournalofGenetics, 2010,89(2):155-162.
[32]梁冰,范术丽,宋美珍,等.陆地棉农艺性状与SSR标记的关联分析.棉花学报,2014,26(5):387-395.
LIANG B, FAN S L, SONG M Z,etal. Association analysis of agronomic traits in upland cotton using SSR markers.CottonScience, 2014,26(5):387-395. (in Chinese with English abstract)
[33]LI C Q, SONG L, ZHAO H H,etal. Identification of quantitative trait loci with main and epistatic effects for plant architecture traits in upland cotton (GossypiumhirsutumL.).PlantBreeding, 2014,133(3):390-400.
[34]LIU D X, LIU F, SHAN X R,etal. Construction of a high-density genetic map and lint percentage and cottonseed nutrient trait QTL identification in upland cotton (GossypiumhirsutumL.).MolecularGeneticsandGenomics, 2015,290(5):1683-1700.
[35]ALI I, KAUSAR A, UR-REHMAN M,etal. Development of genetic linkage map of leaf hairiness inGossypiumhirsutum(cotton) using molecular markers.PakistanJournalofBotany, 2009,41(4):1627-1635.
[36]LI C Q, LIU G S, ZHAO H H,etal. Marker-assisted selection ofVerticilliumwilt resistance in progeny populations of upland cotton derived from mass selection-mass crossing.Euphytica, 2013,191(3):469-480.
棉花植株形态学性状遗传网络的关联分析(英文).浙江大学学报(农业与生命科学版),2016,42(2):127-136
梅拥军1†*, 余霁雯2†, 薛昂立3†, 范术丽2, 宋美珍2, 庞朝友2, 裴文锋2, 喻树迅2, 朱军3*(1.塔里木大学植物科学学院,新疆 阿拉尔 843300;2.中国农业科学院棉花研究所,棉花生物学国家重点实验室/农业部棉花生物学与遗传育种重点实验室,河南 安阳 455000;3.浙江大学农业与生物技术学院,浙江省作物种质资源重点实验室,杭州 310058)
摘要棉花形态性状对于棉株营养生长至关重要,同时,对其生殖生长也有着关键影响。该研究对来源于3个不同种植环境下的39个陆地棉品种材料及其178个F1组合的株高、茎秆粗、第一果节数和果枝数的遗传结构进行了剖析。关联分析采用基于混合线性模型的统计方法,剖析的遗传效应包括加性效应、显性效应、上位性效应及其与环境的互作效应。结果共检测到25个数量性状SSR(simple sequence repeat,简单重复序列)位点与这4个形态学性状显著相关,总遗传率达到63.08%~78.28%;加性、显性及其与环境的互作效应是棉花形态性状遗传的重要遗传资源,直接选择显著的SSR位点可优化棉株的形态性状。
关键词棉花; 关联分析; 形态性状; 上位性; 简单重复序列标记
*Corresponding authors: ZHU Jun (http://orcid.org/0000-0002-8509-8304), E-mail:jzhu@zju.edu.cn; MEI Yongjun (http://orcid.org/0000-0003-3592-6703), E-mail:xnmeiyj@126.com
Foundation item: Project supported by the National High Technology Research and Development Program of China (No. 2009AA101104), the National Science Foundation of China (No. 31371250), the National Basic Research Program of China (No. 2011CB109306), the National Cotton Industry Technology System (No. CARS-18), and the Scientific Research Program of the Higher Education Institution of Xinjiang, China (No. XJEdu 2006I59).
† The authors contributed equally to this study.
Received: 2016-01-19; Accepted: 2016-03-02; Published online: 2016-03-20
URL:http://www.cnki.net/kcms/detail/33.1247.S.20160321.1424.002.html
