Numerical simulation of groundwater under complex karstconditions and the prediction of roadway gushing in a coal mine: a case study in the Guang'an Longtan Reservoir in Sichuan Province,China
2016-04-18JiangChengxinShiHuapengLiYaYuHongming
Jiang Chengxin·Shi Huapeng·Li Ya·Yu Hongming
Numerical simulation of groundwater under complex karst
conditions and the prediction of roadway gushing in a coal mine: a case study in the Guang'an Longtan Reservoir in Sichuan Province,China
Jiang Chengxin1·Shi Huapeng1·Li Ya1·Yu Hongming1
DOI 10.1007/s11631-015-0077-zAbstract Numerical simulation of groundwater in karst areas has long been restricted by the dif fi culty of generalizing the hydrogeological conditions of reservoirs and of determining the relevant parameters due to the anisotropy and discontinuity of the karst water-bearing media in these areas.In this study,we used the Guang'an Longtan Coal mine in Sichuan as an example,and generalized the complex hydrogeological conditions in the reservoir area.A fi nite element numerical fl ow model was used to simulate current and future scenarios of roadway gushing at the bottom of the coal mine at pile number 1+700 m.The results show that the roadway section corresponding to valleys has a gushing quantity of 4323.8-4551.25 m3/d before impoundment.Modeled water in fl ow after impoundment increased to 1.6 times the water in fl ow before impoundment,which threatens the impoundment as well as the roadway's normal operation.Therefore,roadway processing measures are needed to guarantee the safety of the impoundment and of the mining operation.
Karst reservoir·Roadway gushing· Numerical simulation·Hydrogeological conditions generalization
1 Introduction
With economic development in China,the construction of water conservancy and hydropower projects has increased annually,leading to an increased interest in hydro-geological modeling.It is difficult to use numerical simulation of groundwater to generalize the hydro-geological conditions in karst regions and to calculate the related parameters(Li GR et al.2012).Various scholars from different countries have conducted many studies to model and forecast tunnel water inf l ow(Anderson and Woessner1992;Zhao etal.2011;LiCM et al.2015;Petrovskii and Sergeeva 1976;Veremchuk 1981). Since the 1950s,Chinese scholars have used empiricalmodels of steady f l ow and statistics to predict water inf l ow(China NationalAdministration of CoalGeology 2001).In the 1970s,the simulation of groundwater f l ow was performed using numerical analysis and discrete mathematics.In the 1990s to the early 21st century,finite element simulation software was used for the qualitative analysis and even quantitative simulation of groundwater(Yang et al.2007;Dong et al.2009).
In this paper,the objectives of the study were to propose a finite element model of groundwater in the Longtan Reservoir and to model the tunnel water inf l ow in the mine at the bottom of the reservoir area in Guang'An,Sichuan. This paper used FEFLOW finite element software to conduct the finite element numerical simulation for the karst geological condition,peculiar to the reservoir area,and to reasonably generalize the geological conditions.To address the problem that this software's interpolation procedure fails near steep rock strata,this study used AutoCAD to build virtual boreholes to perform the interpolation calculation and imported the results into the interpolation program to build a geological model conforming to the actual situation.Previous studies have failed to obtain a good generalized fit for the water inf l ow into the mine,and thisinf l ow has only been calculated for two conditions-during a drought period and in the wet season.This study generalized three penetration points of the mining tunnel into the pumping well for the model and simulated the three water gushing points near pile 1+700 m along the coal mine roadway to make a comparison with collected data and to substantiate the calculation of the water inf l ow during the drought period and the wet season.This produced results with a better fit to reality.Based on the improved water inf l ow information,future water retention in the reservoir was forecast and analyzed,and treatments were suggested.
2 Engineering geology in the study area
Longtan reservoir is a level-III medium-scale water conservancy project that was built for comprehensive utilization by agricultural irrigation,rural water supply,and power generation.This multi-year regulating reservoir has a verified f l ood level of 429.54 m,a total capacity of 30.81 million m3,a normal storage level of 425 m,and a designed irrigation area of 78,200 mu.The wellhead of the Longtan Coal Mine is located at Jiangjia Courtyard on the west side of the Pizicao River area of the Longtan Reservoir.The main roadway crosses the lower part of the Pizicao riverbed and enters the main mining area 4400 m beyond the river.The mining area covers an area of 10.6068 km2,and the elevation of the mine ranges from 400 to 630 m.The location of the study area is shown in Fig.1.
The Longtan Reservoir engineering area is located on the west side of the middle segment of the Huaying Mountains.The western foot of the Huaying Mountains is generally divided into three terraces.The first terrace,also the regional watershed,has an elevation of 1000-1100 m;the second terrace has an elevation of approximately 900 m;and the third terrace has an elevation of 600-700 m.The three terraces basically correspond to the elevations of the regional planation surfaces.The hydrogeological conditions in the reservoir area are shown in Fig.2.
2.1 Tectonic geology
The reservoir area is located in the middle region of the duplex anticline of the Huaying mountains,plunges to the north and south ends,and is a complete anticline reservoir structure(Fig.3).
Faults in the reservoir area were primarily developed near or at two sides of the axes of both the Daluowan Anticline and the Tianwan Syncline,and their general strikes were basically consistent with the axes.

Fig.1 Geographic location of the study area
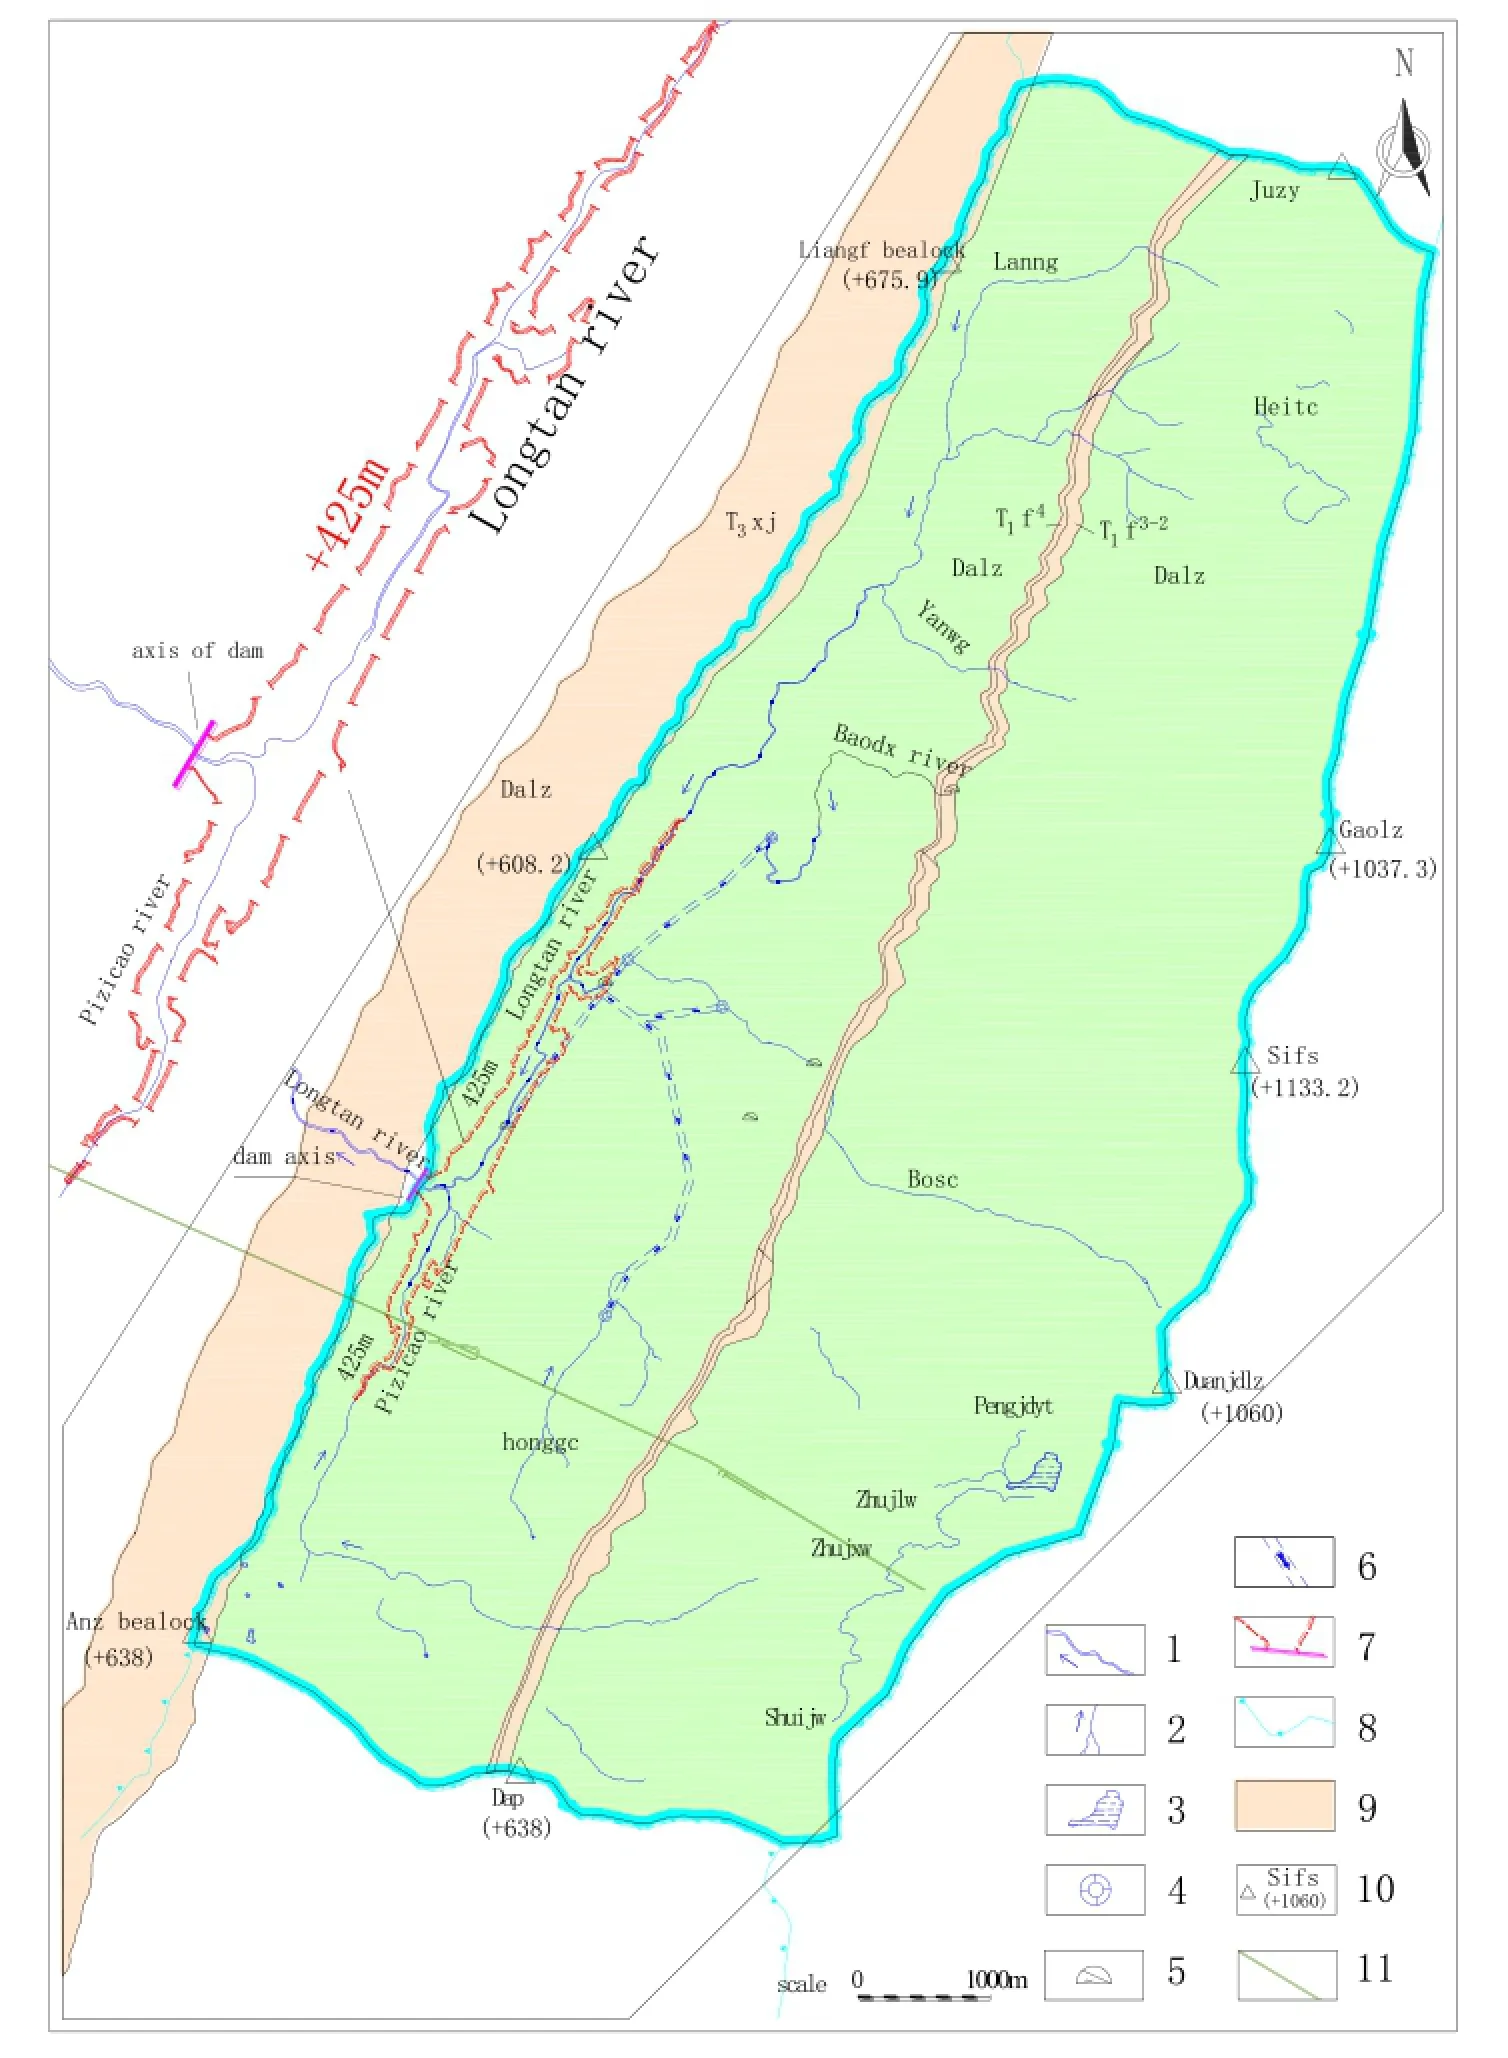
Fig.2 Hydrogeological map of the Longtan reservoir.1-Rivers and f l ow directions;2-Streams,grooves,and f l ow directions;3-Ponds;4-Avens;5-Karst caves;6-Speculated karst tunnels and f l ow directions;7-Dam axis and normal storage level;8-Watershed line;9-Relative water-resisting layer;10-Places and elevations;11-Main roadway in the mining area
As shown in Fig.3,the whole reservoir area is located at the west wing of the Daluowan Anticline,which has a monoclinal structure.The attitude of the beds is very stable,striking N20°-35°E and dipping NW at an angle of 50°-85°.The Gaodeng mountain line in the middle and the Juantong line in the north are uplifts and form a nearly EW-trending regional surface watershed.The deep cutting of the Jialing River captures groundwater and drives the Gaodeng groundwater watershed slightly northwards.With the two surface watersheds as the boundary,the groundwater systems between the two watersheds and at the two sides have independent supply,runoff,and drainage systems and form three complete hydrogeological units in the southern,middle,and northern regions.The longitudinal surface watershed along the EW trend is the bead-shaped long-beam ridges along the Daluowan Anticline axis.The Longtan reservoir area is located at the runoff area that is south of the middle hydrogeological unit and has the Qujiang River as the lowest drainage base level.
2.2 Static lithology and water-bearing system division in the reservoir area
The outcropped strata in the reservoir area are,from new to old:quaternary loose accumulative strata,middle/lower Jurassic sand-shale interbedded karst strata,the Upper Triassic Xujiahe Formation(T3xj),Middle Triassic Leikoupo Formation(T2l),and Lower Triassic Jialingjiang(T1j)and Feixianguan Formations(T1f).

Fig.3 Tectonic geology. 1-Dam axis and normal storage level;2-Watershed line;3-Faults;4-Rivers;5-Main roadway in the mining area;6-Attitudes of beds;7-Syncline and anticline;8-Places and elevations
Based on the lithological combinations and karst developmental characteristics of the outcropped strata in the reservoir area,the strata can be divided into five groups: strong karst water-containing permeable rock group,medium karst water-containing permeable rock group,weak karst water-containing permeable rock group(relative water-resisting layer),water-resisting group,and loose accumulative rock group.The division of water-containing rock groups in the reservoir area is shown in Table 1.

Table 1 Division of bedrocks in the reservoir area
3 Geological modeling in the reservoir area
According to the hydrogeological conditions,the groundwater runoff in the study area basically strikes through the relative water-resistant layers-from the west wing of the Daluowan Anticline in the eastern-most part to the reservoir area,it converges into the Longtan River and the Pizicao River,and then drains into the proposed dam on the west side,which is the only natural outlet(Fig.1).Based on the stratum penetrability and attitude changes in the reservoir area,the study area was generalized into five regions and six large layers.All layers are heterogeneous and anisotropic.Therefore,the water f l ow systems in the reservoir area were generalized into a 3D unsteady f l ow system.The 3D geological models were built using FEFLOW(Diersch 1996;Elad et al.2010;Dong DL et al. 2012)(Fig.4)and dissected and optimized into corresponding to sections(Fig.5).
3.1 Geological model optimization
During the construction of the geological model,FEFLOW defines rectangular units in the horizontal and vertical directionsasnodes and layers.Therefore,FEFLOWcan only portray the horizontal strata and move the units vertically to form new strata and interfaces;FEFLOW cannot portray inclined steep strata or interfaces.In this study,AutoCAD was used to construct virtual drilling interpolations.In the vertical direction,the strata were interpolated and the stratic interfaces were controlled to construct near-vertical steep strata.Therefore,the strata contact manner during construction of the unit nodes on FEFLOW was changed from a horizontal contact to a steep contact,more closely modeling existing stratic contact conditions(Figs.4,5).
3.2 Mathematical models
Based on the analyses above,the groundwater f l ow systems in the study area were generalized into heterogeneous,horizontally isotropic,and vertically varying 3D unsteady groundwater f l ow systems,which can be expressed from the definite conditions of the following partial differential equations(Lin and Chen 2010):
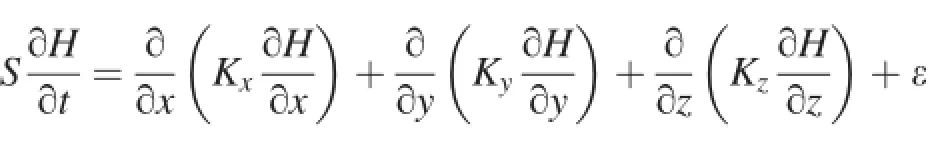

Fig.4 3D models in the study area

where Ω is the seepage area;H is the groundwater water head(m);Kx,Ky,Kzare the x-,y-,z-direction permeability coefficient components,respectively(m/d);S is the aquifer storage coefficient(1/m);Knis the permeability coefficient in the normal direction of the boundary faces(m/d);μ is the gravity specific yield in the phreatic aquifer;P is the atmospheric precipitation infiltration recharge per unit area(m/d);H0is the initial water head in the aquifer(m);Γ,Γ1,Γ2are the upper boundary,second type boundary,and lower boundary in the simulated area,respectively;n is the unit normal direction vector in the simulated area;ε is the source sink term in the aquifer(1/d);and q(x,y,z,t)is the fl ow per unit width at the lateral boundary(m/d).
3.3 Initial hydrogeological conditions and generalized boundary conditions
A simulation area involving the reservoir was outlined based on the data above.This area had a total area of 25.13 km2,and the numerical model was divided into 58,123 grids.The boundaries of the simulation area were generalized based on the geological conditions:(1)The surface watershed in the eastern part of the reservoir area is also located underground and is in the contact area between the water-resisting layer and the permeable layer,so this watershed is treated as a zero-f l ow boundary.(2)The western part of the simulation area is treated as a water-resisting layer because of the arch structure.(3)The southern and northern parts are regarded as f l owing boundaries,but because the water head ratio is<5%,the northern and southern boundaries are approximated as having zero f l ow and are treated as zero-f l ow boundaries.(4)The simulation area was supplied by atmospheric precipitation and leakage of local surface water,and the recharge varies with precipitation.(5)The elevation of the lowest draining base level,the Qujiang River,which is 300 m below,is regarded as an impermeable base(Sun 1981).

Fig.5 Study area and geological section
3.3.1 Groundwater system structure
The groundwater systems in the simulation area were divided into four groundwater subsystems:(1)A waterresistant layer system in the western region where the strata are dominated by the Triassic Xujiahe Formation with an average thickness of 550 m and near the Leikoupo Formation in the eastern region with high water-resistance;(2)The western part of the surface watershed in the reservoir area,together with the second Triassic Leikoupo Formation segment in the eastern part,as the moderately permeable karst rock group with an average thickness of 190 m;(3) The first segment east of segment two in the Leikoupo Formation with a weakly permeable layer,an average stratum thickness of~220 m,and without the development of karst pipes;(4)The Triassic Jialingjiang Formation karst aquifer subsystem,which was largely exposed and east of the Leikoupo Formation.Due to separation by the anticline water-resisting layer,this subsystem was generalized into two adjacent water-containing systems;the thickness of the water separation system is approximately 429-534 m.
The division of the permeability coefficients(Laronne Ben-Itzhak and Gvirtzman 2005)is shown in Fig.5.Thepermeability coefficients in each area are shown in Table 2.
3.3.2 Groundwater supply and drainage
The main surface water systems in the study area are the Pizicao and Longtan Rivers.Under natural conditions,the karst groundwater in these areas is discharged into the two rivers in the form of karst pipes or streams.In the watershed segments,groundwater is supplied along the watershed lines vertically into the Longtan and Pizicao Rivers. Based on the geomorphologic characteristics,the bedrock exposure conditions,the lithologic differences and the distribution of the quaternary covering layers,we adjusted the rainfall infiltration coefficients on the planes according to the variation of the gradients.The relationships between the values of the rainfall infiltration supply and the effects of the slopes are shown in Table 2.The sideways supply fl ows were determined from each aquifer as well as the water-resisting layer permeability coef fi cient,K;the thickness;the width;and the hydraulic gradient,I.The water inf l ow at the mine water penetration point was generalized and analyzed as a hydrogeological well.

Table 2 Permeability coefficients in all subareas of the study area(m/d)
4 Model identification and sensitivity analysis of the numerical simulation groundwater model(FEFLOW)in the reservoir area
4.1 Model identification
The model was adjusted based on existing hydrogeological data with steady and nonsteady f l ow simulations performed using FEFLOW(Awan 2010;Elango et al.2012).The distribution of the groundwater water levels under the above generalized hydrogeological conditions was determined(Voss 2011)such that the simulated results were in agreement with the real observations of the water levels and could more accurately ref l ect the coal mine roadway gushing(Elango et al.2012;Sulzbacher et al.2012).
From the 43 hydrogeological monitoring wells available in the study area(Fig.6),dynamic hydrogeological drilling data from four monitoring wells were selected and used in the identification of the steady f l ow model.The identif ication period was 1 year,from September 2012 to August 2013.The positions of the monitoring wells,the calculated embedded water level depth,and the fitted curves of the observed water level from the four selected wells are shown in Figs.7 and 8.
The one-year water level change curves of the four holes ref l ect the composite effect of all the hydrogeological parameters in the simulation area.The simulated data andthe observed water level data are generally consistent for all four holes,indicating that the simulated data are similar to the real geological data.

Fig.6 Distribution of the monitoring drill holes in the simulation area
The data of the embedded water level depth from the four holes were used in a linear regression correlation analysis,where a correlation coefficient r2=1 indicates full consistency between the simulated results and the observed results;r2<1 indicates that the degree of fitting decreases;and r2<0.6 indicates no value of the reference. The correlation coefficients between the simulated results and the observed results for the four selected drill holes are shown in Fig.8.
As shown in Fig.8,the r2from all four drill holes was>0.6.The simulated results are more similar to the real conditions for wells 6,8,and 16 because these wells were near the Longtan River channel,and the water table levelswere low.Well 21 was located at a very high elevation and at the watershed between the water-resisting and the watercontaining layers;therefore,its simulated results were impacted by the boundary conditions,resulting in very large errors(Figs.9,10).

Fig.7 Fitted curves of the water levels from the monitoring drill holes. a Monitoring drill hole No.8. b Monitoring drill hole No.6. c Monitoring drill hole No.21. d Monitoring drill hole No.16

Fig.8 Validation of the correlation coefficients in the monitoring drill holes. a Monitoring drill hole No.8. b Monitoring drill hole No.6. c Monitoring drill hole No.21. d Monitoring drill hole No.16
4.2 Sensitivity analysis
Sensitivity measures how the results of a model respond to variation in a parameter(Zhai et al.2010),and is typically represented by a sensitivity coefficient.By inducing avariation in a boundary condition parameter and keeping other conditions unchanged,we computed the sensitivity coefficient of a parameter to the dependent variable by estimating the variation of this dependent variable divided by the variation of the parameter(Zheng and Gordon 2001):
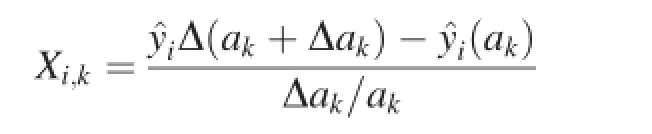

Fig.9 Simulated and observed roadway percolating capacity before impoundment under steady f l ow conditions.a For the simulated result.b For the observed result

Fig.10 The simulated result of the roadway percolating capacity after impoundment using transient f l ow conditions
where Xi,kis the dependent variable at the i-th monitoring point;is the sensitivity coefficient of the k-th parameter;akis the value under basic conditions;is the disturbanceimposed onto this parameter;and are the values of the dependent variable before the addition of such a disturbance,respectively(Table 3).
We select the horizontal permeability coef fi cient,Kxy;the vertical permeability coef fi cient,Kz;and the rainfall in fi ltration coef fi cient,α,and calculate the absolute sensitivity coef fi cient(Table 4).The results show that,of the parameters,the horizontal and vertical permeability coeffi cients vary signi fi cantly and are very sensitive to the groundwater model(Zhai et al.2010).

Table 3 Infiltration coefficients considering the effects of gradients

Table 4 Sensitivity coefficients from all monitoring pores
5 Prediction of the gushing quantity
This model was used to estimate the current and future conditions of the water inf l ow at three main penetration points at the 1+700 m transport roadway in the Longtan Coal Mine area both before and after impoundment according to local hydrogeological data and the mine's well water gushing report.This segment is located right below the Pizicao River and slightly towards the left bank. This segment was found to have the most concentrated and greatest water gushing quantity,with a total of up to 4320 m3/d.Using the two main penetration points at this segment as representative points,the characteristics of pumping wells were generalized(Zhou et al.2012).Based on the hydrogeological data,the regional annual precipitation was set at 1200 mm.After impoundment,the water level at the reservoir area was defined as an impoundment level of 425 m,and the simulation time was 1 year.
During the simulation of the current conditions,the hydrogeological parameters were unchanged.Then,the percolating capacities of the tunnel penetration points before impoundment in 2012 were simulated with steady hydrogeological conditions.The simulated results are quite consistent with the real conditions,with water inf l ows of 4323.8-4551.25 m3/d(50.03-52.67 L/s).
During the simulation of future conditions,the reservoir water head was set at 425 m.The roadway penetration points were also generalized.The percolating capacities of the roadway penetration points before impoundment in 2012 were simulated using transient f l ow conditions
The predicted results show that immediately after impoundment,the reservoir condition was very similar to the steady condition before impoundment.With a prolonged simulation time and changes in the boundary conditions,the water inf l ows at the three water gushing points along the 1+700 m segment after impoundment gradually increased in an exponential manner.After impoundment,the maximum water gushing quantity in this segment was 7084.8 m3/d,which was 1.6-fold greater than before impoundment.Therefore,if a reservoir is to be built in this location,anti seepage measures will be necessary.
6 Conclusions
1.During the generalization of the complex karst geologic body,the coal mine exploitation roadway was generalized into pumping wells to simulate the effects on the underground f l ow field.The large-area boundary conditions along the east wing of the anticline were generalized into water-resisting layers and combined with the local strata,demonstrating high simulation performance.
2.With respect to the high-dip-angle strata exclusive to the karst areas,the bedding planes of each stratum were delaminated and interpolated during geological modeling to reconstruct the original geological shapes in the reservoir area,which improved the authenticity of the model.
3.The numerical model was used to simulate the three main penetration points along the 1+700 m segment. The results show that under impoundment conditions,the leakage amount in this segment increased twofold. This mining area was subject to very high drainage pressure.If a reservoir is to be built in this tunnel leakage segment,anti seepage measures will be necessary.
Acknowledgments This research was supported by the National Natural Science Foundation of China(41272377).
Anderson MP,Woessner WW(1992)Applied groundwater modeling: simulation of f l ow and advective transport.Academic Press,San Diego
Awan UK(2010)Coupling hydrological and irrigation schedule models for the management of surface and groundwaterresources in Khorezm,Uzbekistan[D]Dissertation,University of Bonn,Bonn
China National Administration of Coal Geology(2001)Coal mining hydrogeology of China.China Coal Industry Publishing House,Beijing(in Chinese)
Diersch HJG(1996)Interactive,graphics-based finite-element simulation system FEFLOW for modeling groundwater f l ow,contaminant mass and heat transport processes.User's Manual v.4.5.Institute for Water Resources Planning and System Research,Ltd,Dordrecht
Dong D,Wang H,Wu C,Chen S,Lv Z,Li Y(2009)Seepage characters of roof aquifers in faults and sliding structure and risk analysis of water inrush.J Rock Mech Eng 28(2):373-378(in Chinese with English abstract)
Dong DL,Sun WJ,Xi S(2012)Optimization of Mine Drainage Capacity Using FEFLOW for the No.14 Coal Seam of China's Linnancang Coal Mine[J].J Mine Water Environ 31:353-360
Elad D,Avi B,Haim G(2010)Effects of Karst and geological structure on groundwater f l ow:the case of Yarqon-Taninim Aquifer,Israel.J Hydrol 389:260-275
Elango L,Brindha K,Kalpana L,FabySunny NRN,Murugan R(2012)Groundwater f l ow and radionuclide decay-chain transport modelling around a proposed uranium tailings pond in India. J Hydrogeol 20:197-212
Laronne Ben-Itzhak L,Gvirtzman H(2005)Groundwater f l ow along and across structural folding:an example from the Judean Desert,Israel.J Hydrol 312:51-64
Li GR,Zhao Z,Chen ZH(2012)Numerical simulation for groundwater under draining condition in complex karst mining area:an example from the Makeng iron mine in Fujian province. J Carsol Sin 31(4):382(in Chinese with English abstract)
Li CM,Yang G,ZD Q,Zou SB,Li JC(2015)Simulation and prediction on variations of groundwater in mining area based on FEFLOW and GIS.J Arid Land Geogr 38(2):359-361(in Chinese with English abstract)
Lin ZX,Chen XG(2010)Analysis on gushing water in complex karst mining area-A case in ferromanganese mine II in Daoxian,Hunan province.J Carsol Sin 29(1):62-65(in Chinese with English abstract)
Petrovskii MB,Sergeeva NS(1976)Monitoring seepage f l ows through the body and foundation of the concrete dam at the Krasnoyarsk hydroelectric plant.Power Technol 10(12):1210-1216
Sulzbacher H,Wiederhold H,Siemon B,Grinatunther M,Hinsby K(2012)Numerical modelling of climate change impacts on freshwater lenses on the North Sea Island of Borkum using hydrological and geophysical methods.J Hydrol Earth Syst Sci 16:3621-3627
Sun NZ(1981)Mathematical models and numerical methods of groundwater f l ow.Geological Publishing House,Beijing(in Chinese)
Veremchuk IA(1981)Steady seepage f l ow under aprons in anisotropic ground.Fluid Dyn 16(6):931-933
Voss C(2011)Editor's message:Groundwater modeling fantasiespart 1,a drift in the details.J Hydrogeol 19:1281-1284
Yang T,Tang C,Tan Z,Zhu W,Feng Q(2007)State of the art of inrush models in rock mass failure and developing trend for prediction and forecast of groundwater inrush.J Rock Mech Eng 26(2):268-276(in Chinese with English abstract)
Zhai YZ,Wang JS,Su XS,Zuo R(2010)Parameter sensitivity analysis in groundwater numerical simulation.J Yellow River 32(12):99-100(in Chinese with English abstract)
Zhao C,Ding L,Huo Z(2011)Numerical simulation of mine water inrush features and quantity in Linnancang mine.J Coal Eng 5:80-82(in Chinese with English abstract)
Zheng CM,Gordon DB(2001)Applied contaminant transport modeling.Wiley,New York
Zhou NQ,Xu XP,Jiang SM et al(2012)Numerical simulation of groundwater and mine inf l ow forecast in Wushan copper mineral deposit.J Site Investig Sci Technol 2:37-38(in Chinese with English abstract)
Received:11 August 2015/Revised:7 September 2015/Accepted:14 October 2015/Published online:8 December 2015
©Science Press,Institute of Geochemistry,CAS and Springer-Verlag Berlin Heidelberg 2015
✉Yu Hongming yuhongming55@sohu.com
1Faculty of Engineering,China University of Geosciences,Wuhan 430074,China
杂志排行

Acta Geochimica的其它文章
- The Moon
- Equilibrium and kinetic Si isotope fractionation factors and their implications for Si isotope distributions in the Earth's surface environments
- Study of oxygen fugacity during magma evolution and ore genesis in the Hongge mafic-ultramafic intrusion,the Panxi region,SW China
- Determination of rhenium and osmium by ICP-MS for galena and sphalerite
- Oil-source correlation of Lower-Triassic oil seepages in Ni'erguan village,Southern Guizhou Depression,China
- The inf l uence of three mangrove species on the distribution of inorganic nitrogen and phosphorus in the Quanzhou Bay estuarine wetland soils