关中地区重污染期间PM2.5输送与来源的模拟研究
2016-03-13李国辉
李国辉,冯 添,
(1.中国科学院气溶胶化学与物理重点实验室,西安 710061;
2.中国科学院地球环境研究所 黄土与第四纪地质国家重点实验室,西安 710061;3.西安交通大学 人居环境与建筑工程学院,西安 710054)
关中地区重污染期间PM2.5输送与来源的模拟研究
李国辉1,2,冯 添2,3
(1.中国科学院气溶胶化学与物理重点实验室,西安 710061;
2.中国科学院地球环境研究所 黄土与第四纪地质国家重点实验室,西安 710061;3.西安交通大学 人居环境与建筑工程学院,西安 710054)
本文应用WRF-CHEM模式模拟分析了关中地区2014年2月14日至16日的一次重污染过程。模式模拟了西安地区和宝鸡地区城市大气PM2.5的时间变化和空间分布特征,较好地再现了污染过程。敏感性试验分析表明,关中盆地东部地区(西安市及其周边地区)形成的PM2.5对盆地西部地区(宝鸡市及其周边地区)影响较大,贡献可以达到30%,其主要原因为盆地发生重污染时,盛行东风造成西安市及其周边地区形成的污染物向西输送,影响宝鸡市的空气质量。污染源分析表明,居民生活源是关中盆地在2月份最重要的PM2.5源,贡献超过40%,交通运输源的贡献小于10%。因此在重霾情况下,限行机动车的作用很小。
空气污染;PM2.5;WRF-CHEM
大气细粒子(PM2.5)通过直接和间接方式对地球辐射平衡有重大的影响。直接方式表现为颗粒物直接吸收和散射太阳辐射,从而影响辐射平衡(Seinfeld and Pandis,2006)。间接方式则通过颗粒物作为云凝结核(CCN)和冰核(IN)改变云的反照率和寿命期进而影响辐射平衡(Zhang et al,2007),因而对气候也有深远的影响。高浓度的PM2.5能够大幅降低大气能见度(Seinfeld and Pandis,2006;Cao et al,2012b),严重影响人类健康(Cao et al,2012a),并与农作物产量有密切联系(Greenwald et al,2006),是影响空气质量和造成大气污染的关键因素。
当前在经济快速发展和城镇化过程中,我国很多地区包括京津冀、长三角、珠三角和关中地区正经历严重的空气污染过程(He et al,2001;Cao et al,2005,2007,2012b;Guinot et al,2007;Shen et al,2009;Yang et al,2011;Zhang et al,2013,2015a;He et al,2015;Tie et al,2015a)。在各种污染物当中,大气细粒子以其重要的环境和健康效应尤为受到人们关注。Zhang et al(2013)研究表明,北京夏、秋、冬季PM2.5浓度在140 μg · m–3左右,春季在125 μg · m–3左右。Zhao et al(2013)研究结果与其相似,春、秋、冬季PM2.5浓度约为125 μg · m–3,夏季为115.8 μg · m–3。He et al(2015)用WRF-CHEM模式模拟了北京2013年冬季的一次污染过程,发现本地排放源是此次污染的主要污染来源,且地表风速和边界层高度在此次污染过程中起到了关键性作用,重污染发生时风速小于1 m · s–1。Zhang et al(2015b)用WRF-CHEM模式研究发现北京2013年1月份的一次重污染过程中气象异常对污染事件期间本地和区域排放源有很大的影响。曹军骥(2014)指出,上海市春季PM2.5平均质量浓度近100 μg · m–3,冬季超过80 μg · m–3,而广州市冬季PM2.5平均质量浓度可达114 μg · m–3。Cui et al(2015)模拟广州地区大气PM2.5的来源发现,机动车源是对PM2.5贡献最大的单一贡献源,珠三角北部污染物的传输对广州空气质量有重大影响。观测显示西安市的大气污染状况尤为严重,2003年至2011年间冬季PM2.5浓度达233.6 ± 121.5 μg · m–3(曹军骥,2014)。中国科学院地球环境研究所2003年至2013年连续十年的每日监测结果表明,10年PM2.5质量浓度均值为167 μg · m–3,是我国环境空气二级标准(35 μg · m–3)的4.8倍,其污染状况不容小觑,但相关的观测研究却仍然有限。而受观测和排放资料的限制,模式模拟工作则几乎为零。
本文应用WRF-CHEM模式,主要研究在重污染的情况下关中盆地内东西两部分(主要为西安及其周边地区,宝鸡及其周边地区)形成的污染物是否相互影响以及影响有多大,此外还分析讨论了各类排放源(工业、能源、居民和交通)对关中盆地PM2.5的贡献。文章结构大致为:第一部分介绍模式和分析方法;第二部分给出了模拟结果与讨论;第三部分为文章的结论部分。
1 模式和方法
1.1 模式简介
所有的模式模拟工作都是基于WRF-CHEM(Weather Research and Forecast Model with Chemistry)模式(Li et al,2010,2011a,2011b,2012)。WRF-CHEM模式是由美国国家大气科学中心(NCAR)和美国国家海洋及大气管理局(NOAA)开发的全耦合化学输送模式。中国科学院地球环境研究所的科研人员对其进一步优化,使其适应中国大气污染的模拟研究。通过发展一个灵活的气相光化学模式,可以在模拟时使用不同的化学机制(CBIV,RAMD2及SAPRC),并将美国环保局发展的CMAQ气溶胶模式加入到WRFCHEM模式。有机气溶胶的模拟利用非传统的VBS(Volatility Basis Set)方法(Donahue et al, 2006;Robinson et al,2007;Li et al,2011b),包括乙二醛(glyoxal)和甲基乙二醛(methylglyoxal)对二次有机气溶胶的贡献。无机气溶胶的模拟利用ISORROPIA Version 1.7 (http://nenes.eas.gatech. edu/ISORROPIA/)。该版本的WRF-CHEM模式已成功模拟了臭氧、无机气溶胶、有机气溶胶、气溶胶的光学厚度和单次散射反照率等。
1.2 模拟设置
模式模拟所选时段是2014年2月14日至16日。在所模拟的三天,宝鸡市8个国控站观测到的PM2.5的平均质量浓度为294 μg · m–3,属严重污染情况。而西安市13个国控站观测到的PM2.5的平均质量浓度为226 μg · m–3,属重度污染情况,优于宝鸡。模式模拟区域见图1a,中心点是109°E,34.25°N,水平分辨率3 km,垂直方向35层(近地面层高30 m,2.5 km高空层高500 m,14 km以上高空层高1 km)。气象场初始和边界条件使用NCEP再分析资料,化学场的初边条件使用MOZART-4全球化学模式6小时间隔的输出资料,起转时间为1天。关中盆地南倚秦岭, 北接陕北高原,西起宝鸡峡,东迄潼关港口,西窄东宽。整个盆地的地形非常不利于污染物的扩散。当盆地内盛行东风时,西安地区的污染物很有可能输送到宝鸡地区,加剧该地区的空气污染。图1b中的蓝色正方形标示关中盆地国控站的位置,其中宝鸡8个站,西安13个站,咸阳4个站,铜川4个站,渭南4个站。基本上国控站都位于城市中,分布比较密集。
模式模拟采用SAPRC99化学机制。排放清单由清华大学提供(Zhang et al,2009),包括5个部分:农业、工业、能源生产、居民生活及交通运输排放。图2给出有机碳和SO2在2月的排放分布。整个盆地的有机碳和SO2的排放非常集中,尤其是在西安市及其周边地区。在宝鸡市及其周边地区,有机碳和SO2的排放也相当高。图3给出了关中地区2月份的SO2、NOx和PM2.5排放量的统计结果。SO2主要来自工业、能源和居民部门,其中以工业源排放最剧,占总排放量达47.6%。NOx排放以能源、交通和工业源为主,三者总量占85%以上。居民源对PM2.5排放的贡献最大,单一贡献达69%,其次工业源贡献达22.9%。
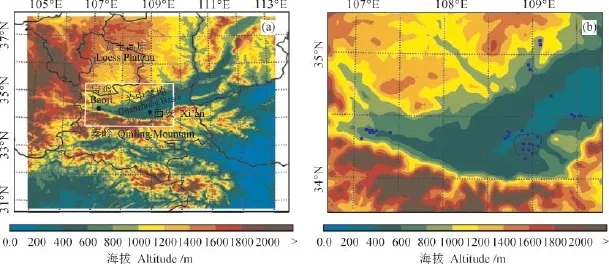
图1 (a)模式模拟区域及(b)观测站点分布Fig.1 (a) Study region and (b) the distribution of observational stations
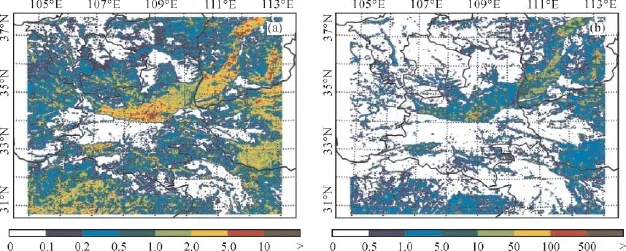
图2 (a)有机碳气溶胶和(b)SO2在2月份的排放Fig.2 Emissions of (a) organic carbon aerosol and (b) SO2in February / (t · month–1)

图3 关中地区2月份人为源排放(a)SO2、(b)NOx和(c)PM2.5排放量统计饼图Fig.3 Pie chart of the statistics of emitted SO2, NOx, and PM2.5from anthropogenic sources during February in the Guanzhong Basin, China
1.3 分析方法
大气污染物的形成是一个复杂的非线性过程,受到不同的排放源以及输送过程的影响。模式研究通常用来分析不同因子对污染物形成的贡献,为减排措施提供依据。但是在一个非线性过程中不能直接评估不同因子的影响。某个因子对一个过程的影响,可以分解为该因子的直接贡献和间接贡献(该因子与其他因子相互作用所造成的影响)。因子分析法(Factor Separation Approach,FSA)(Stein and Alpert,1993)常常用来分析不同因子的贡献以及它们之间的相互作用的影响。
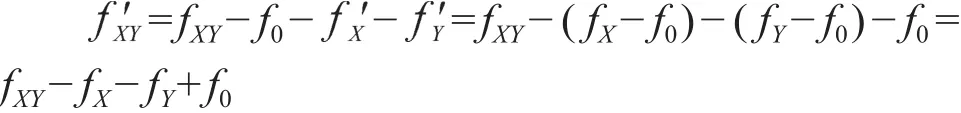
例如,假设影响PM2.5形成有两个因子X和Y,并且X和Y相互作用。fXY,fX,fY和f0分别表示模式模拟包括因子X和Y,只包括X,只包括Y,和不包括因子X及Y。因子X和Y的直接贡献和可以表示为:
包括因子X和Y的模拟fXY可以表示为:
X和Y因子的相互作用可以表示为:
因此评估X和Y因子相互作用,需要4次模式模拟:fXY,fX,fY和f0。
此方法目前是大气环境数值模拟领域常用的分析方法,操作简便,当然也存在自身的缺陷,如该方法获得的各行业排放贡献率的总和不等于100%;该方法还会造成二次污染物化学生成率的变化,从而导致结果存在一定的不确定性。
2 结果和讨论
2.1 模式表现
为了校验模式对于西安和宝鸡地区大气污染物浓度变化的模拟能力,选取位于西安附近和宝鸡附近的两个气象观测站点资料与模拟结果进行对比,验证模式在气象场方面的表现;并选取模拟时段的国控站PM2.5观测资料与模拟结果比较,验证模拟对于污染物浓度的模拟能力。
2.1.1 气象场参数
图4和图5给出了分别靠近西安和宝鸡的咸阳站和凤翔站近地面温度、湿度、风速和风向与模拟结果的对比。从图4可以看出,模式结果基本能够与观测的近地面温度和湿度的日变化相吻合,但模式结果在2月14日和2月15日在咸阳站和凤翔站温度都有所低估,对应的相对湿度均有高估。在模拟时段内,模式对咸阳站和凤翔站较低的地表风速模拟较好(图5a,5c)。在咸阳站,模式能够很好地模拟风向的变化,但在凤翔站风向的模拟结果较差,这主要是因为凤翔站所处的地理环境较复杂,风场变化受局地地形因素影响大。
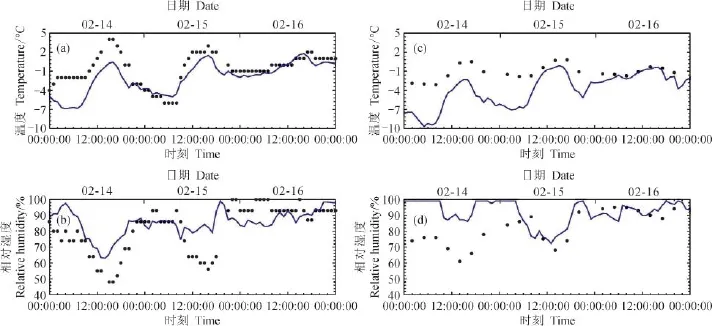
图4 2014年2月14日至16日模拟(蓝线)和观测(黑点)的小时平均的(a,b)咸阳站和(c,d)凤翔站近地面温度和相对湿度Fig.4 Comparison of measured (black dots) and simulated (blue line) diurnal profi les of near-surface hourly near-surface temperature and relative humidity at (a, b) Xianyang and (c, d) Fengxiang meteorological stations from 14 to 16 February 2014
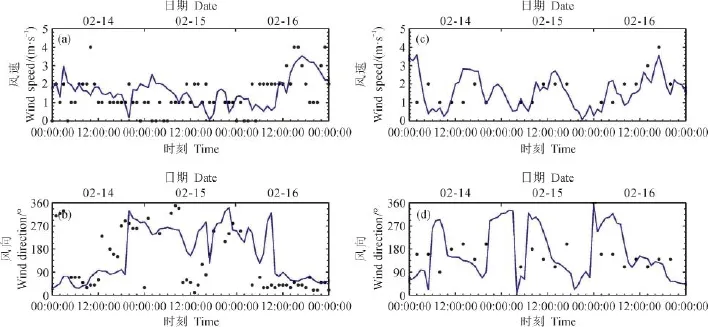
图5 2014年2月14至16日模拟(蓝线)和观测(黑点)的小时平均的(a,b)咸阳站和(c,d)凤翔站近地面风速和风向Fig.5 Comparison of measured (black dots) and simulated (blue line) diurnal profi les of near-surface hourly near-surface wind speeds and directions at (a, b) Xianyang and (c, d) Fengxiang meteorological stations from 14 to 16 February 2014
2.1.2 细粒子浓度
图6(a)给出的是西安13个国控站平均的PM2.5逐日变化模拟与观测的比较。总体说来,在西安,模式高估PM2.5浓度,3天平均观测到的PM2.5质量浓度为226 μg · m–3,而模拟为239 μg · m–3。另外,模式在2月15日和2月16日中午也没有模拟出观测的高值,主要原因可能是模拟的边界层发展过快。在宝鸡的模拟,模式总体上低估PM2.5的质量浓度,观测到的3天平均PM2.5浓度为294 μg · m–3,而模拟为272 μg · m–3。特别是在15日下午,模式低估PM2.5的质量浓度达到80 — 90 μg · m–3。
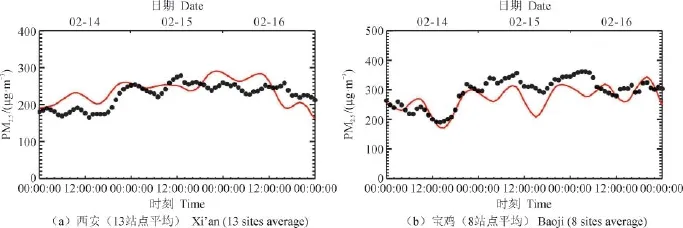
图6 2014年2月14 — 16日模拟(红线)和观测(黑点)的小时平均的(a)西安市和(b)宝鸡市PM2.5质量浓度Fig.6 Comparison of measured (black dots) and simulated (red line) diurnal profi les of near-surface hourly PM2.5 averaged over all ambient monitoring stations in (a) Xi’an and (b) Baoji meteorological stations from 14 to 16 February 2014
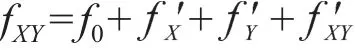
图7 — 9给出的是模式模拟及观测的近地面PM2.5在2月14 — 16日3天8时、12时、16时、20时LT(Local Time,当地时间)的空间分布。在2月14 — 15日,模拟的盆地内的水平风较弱,有一些地区处于静风状态,非常不利于污染物的扩散,造成PM2.5在盆地内的累积;模拟的盆地内PM2.5的质量浓度在4个时次几乎都超过150 μg · m–3,城市地区在8时和20时LT,经常超过250 μg · m–3。与观测比较,模式在宝鸡市的模拟比较好,但是在2月15日16时 LT低估。在西安市,模式倾向于高估,并且没有很好地模拟出观测到的PM2.5的质量浓度的空间变化。例如在2月14日8时和12时 LT,西安市内观测的PM2.5的质量浓度变化超过100 μg · m–3,但是模式没有模拟出这种变化。主要原因是模式的水平分辨率是3 km,可分辨的有效范围大约是21 km(Skamarock,2004),而西安市内的许多站点的水平距离小于10 km,造成模式无法分辨出观测到PM2.5的质量浓度变化。另外的一个原因可能是模式不能很好模拟城市尺度边界层的变化。在2月16日东北风开始发展,把污染物向西输送。但模拟的东北风在16时和20时偏强,造成在盆地东北部模拟的PM2.5的质量浓度过低。
WRF-CHEM模式基本上可以模拟出盆地内PM2.5的质量浓度的时空分布,但仍然存在偏差。除气象因素以外(如边界层和水平风场的模拟),排放源清单的不确定性也是造成模式模拟偏差的一个重要的原因。
2.2 敏感性试验
首先关注的问题是:在重污染的情况下,关中盆地内东西两部分形成的污染物是否相互影响以及影响有多大。为此,在模式可以合理模拟PM2.5质量浓度时空分布的基础上,利用1.3介绍的方法,利用敏感性试验来评估盆地内东西两部分形成的污染物的相互影响。共设计4个敏感性试验:fWE包括所有的排放,fW只包括108°E 以西(主要是宝鸡市及其周边地区)的排放,fE只包括108°E以东(主要是西安市及其周边地区)的排放,f0不包括任何排放。所以盆地西部形成的污染物的贡献可以表示为:

而盆地东部形成的污染物的贡献可以表示为:

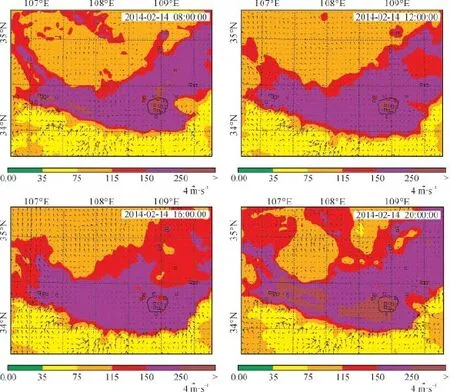
图7 2014年2月14日模拟(彩色阴影)和观测(正方形)PM2.5质量浓度分布Fig.7 Pattern comparison of simulated vs. observed near-surface PM2.5concentrations on 14 February 2014. Colored squares: PM2.5observations; color contour: PM2.5simulations; black arrows: simulated surface winds / (μg · m–3)

图8 2014年2月15日模拟(彩色阴影)和观测(正方形)PM2.5质量浓度分布Fig.8 Same as Fig.7, but for 15 February 2014 / (μg · m–3)
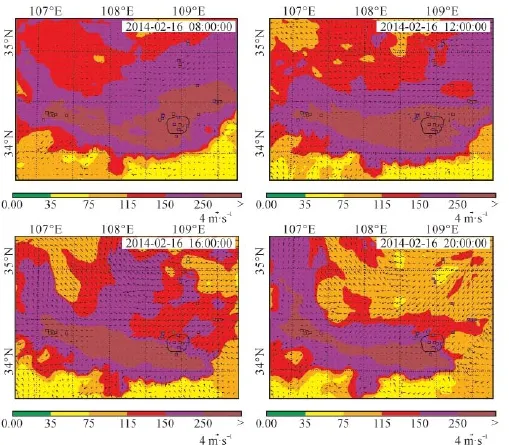
图9 2014年2月16日模拟(彩色阴影)和观测(正方形)PM2.5质量浓度分布Fig.9 Same as Fig.7, but for 16 February 2014 / (μg · m–3)
图10给出的是日平均的宝鸡市及其周边地区形成的PM2.5对盆地的贡献。总体说来,宝鸡市及其周边地区形成的PM2.5对西安市及其周边地区影响不是非常显著。3天平均不超过50 μg · m–3,基本在5 — 25 μg · m–3。而西安市及其周边地区形成的PM2.5对宝鸡市及其周边地区影响比较显著(图11)。2月14日的贡献在25 —50 μg · m–3,2月15日增加到50 — 100 μg · m–3,而在2月16日则超过100 μg · m–3。3天平均在50 —100 μg · m–3。所以对于宝鸡市,大约有15%到30%的PM2.5来自于东部的输送。这种情况主要是由地形造成的。宝鸡市位于盆地的最西端,而在盆地发生重污染时,盛行风主要是东风,造成西安市及其周边地区形成的污染物向西输送,进而影响宝鸡市的空气质量。
另外需要关注的问题是各种排放源对关中盆地PM2.5的贡献。仍旧使用1.3所介绍的办法。例如,如果估算工业源对关中盆地PM2.5的贡献,可以设计2个敏感性试验:fALL包括所有的排放,fOTH不包括工业源的排放。工业源对PM2.5的贡献可以表示为fALL– fOTH。图12是日平均的工业源对关中盆地PM2.5的贡献。工业源对宝鸡市和西安市市区的贡献最大,达到20 — 40 μg · m–3。3天平均的贡献在盆地内超过10 μg · m–3。很明显,工业源不是对2月份关中盆地PM2.5起决定作用的源。图13是日平均的居民生活源对关中盆地PM2.5的贡献。显然居民生活源是2月份关中盆地PM2.5最重要的源。3天平均贡献在盆地内超过80 μg · m–3,大约有40%的PM2.5来自居民生活源。而曹军骥(2014)研究称西安市2010年全年西安市城区燃煤和二次气溶胶对PM2.5贡献达43.2%,与本研究结果相仿。能源生产所贡献的PM2.5与工业源接近(图14),但是在宝鸡市和西安市城区的贡献较小。现在最受关注的是交通源对PM2.5的贡献。从敏感性试验的结果来看,交通源对PM2.5的贡献不大(图15),3天平均的贡献不超过20 μg · m–3,或者说交通源对PM2.5的贡献不超过10%。因此相对其他3个源来说,交通源的贡献最小,在雾霾天对机动车的限行措施不会显著减低PM2.5的浓度。
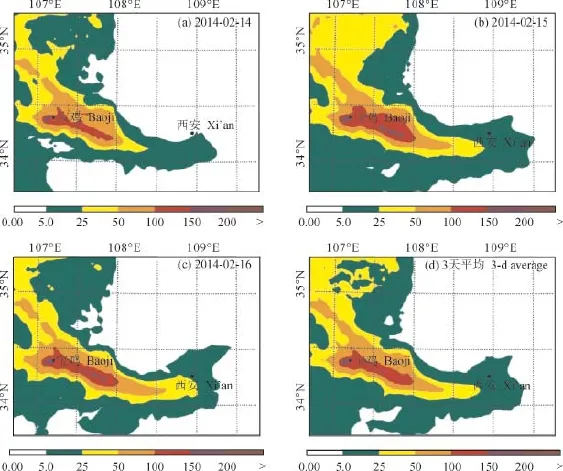
图10 宝鸡市及其周边地区形成的PM2.5对关中盆地PM2.5质量浓度的贡献Fig.10 The contribution of the PM2.5formed over Baoji and surrounding area to the PM2.5level in the Guanzhong Basin / (μg · m–3)
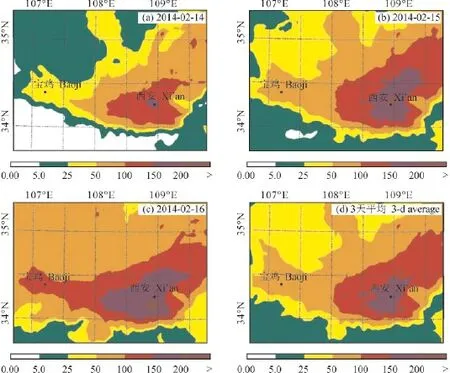
图11 西安市及其周边地区形成的PM2.5对关中盆地PM2.5质量浓度的贡献Fig.11 The contribution of the PM2.5formed over Xi’an and surrounding area to the PM2.5level in the Guanzhong Basin / (μg · m–3)

图12 工业源对关中盆地PM2.5质量浓度的贡献Fig.12 The contribution of industry emission to the PM2.5level in the Guanzhong Basin / (μg · m–3)
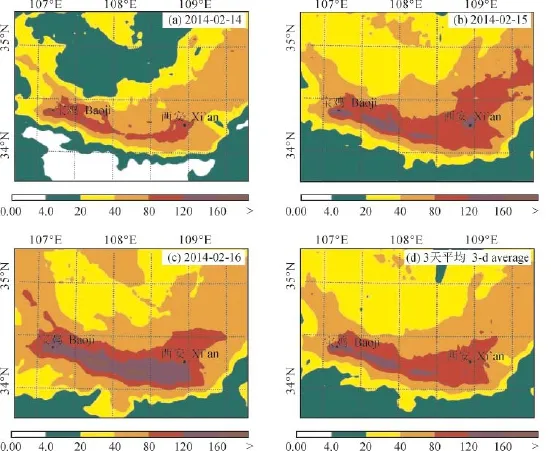
图13 居民生活源对关中盆地PM2.5质量浓度的贡献Fig.13 The contribution of residential emission to the PM2.5level in the Guanzhong Basin / (μg · m–3)
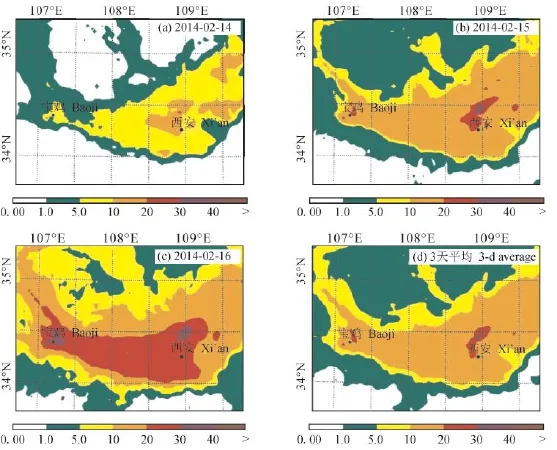
图14 能源生产源对关中盆地PM2.5质量浓度的贡献Fig.14 The contribution of power emission to the PM2.5level in the Guanzhong Basin / (μg · m–3)

图15 交通运输源对关中盆地PM2.5质量浓度的贡献Fig.15 The contribution of transportation emission to the PM2.5level in the Guanzhong Basin / (μg · m–3)
3 结论
首先需要强调的是,以下所得结论都是基于模式在2014年2月14 — 16日3天的模拟结果,对于不同天气系统下的污染情形不具有代表意义。另外,气象场及排放源的不确定性也会影响模式的评估结果。
(1)WRF-CHEM模式基本上可以合理模拟关中盆地PM2.5的质量浓度的时空分布。但是由于气象场模拟的不确定性及模式分辨率的影响,模拟结果与观测比较,仍有偏差。
(2)敏感性试验表明:盆地东部地区(西安市及其周边地区)形成的PM2.5对盆地西部地区(宝鸡市及其周边地区)影响较大,贡献可以达到30%。主要原因是盆地发生重污染时,盛行风主要是东风,造成西安市及其周边地区形成的污染物向西输送,影响宝鸡市的空气质量。
(3)居民生活源是关中盆地在2月份最重要的PM2.5源,贡献超过40%。而交通运输源的贡献小于10%。因此在重霾情况下,限行机动车的作用很小。
曹军骥. 2014. PM2.5与环境 [M]. 北京: 科学出版社: 93 - 132. [Cao J J. 2014. PM2.5and the environment in China [M]. Beijing: Science Press: 93 - 132.]
Cao J J, Lee S C, Chow J C, et al. 2007. Spatial and seasonal distributions of carbonaceous aerosols over China [J]. Journal of Geophysical Research: Atmospheres, 112, D22S11, doi: 10.1029/2006JD008205.
Cao J J, Wang Q Y, Chow J C, et al. 2012b. Impacts of aerosol compositions on visibility impairment in Xi’an, China [J]. Atmospheric Environment, 59: 559 - 566.
Cao J J, Wu F, Chow J C, et al. 2005. Characterization and source apportionment of atmospheric organic and elemental carbon during fall and winter of 2003 in Xi’an, China [J]. Atmospheric Chemistry and Physics, 5: 3127 - 3137.
Cao J J, Xu H M, Xu Q, et al. 2012a. Fine particulate matter constituents and cardiopulmonary mortality in a heavily polluted Chinese city [J]. Environmental Health Perspectives, 120: 373 - 378.
Cui H, Chen W, Dai W, et al. 2015. Source apportionment of PM2.5in Guangzhou combining observation data analysis and chemical transport model simulation [J]. Atmospheric Environment, 116: 262 - 271.
Donahue N M, Robinson A L, Stanier C O, et al. 2006. Coupled partitioning, dilution, and chemical aging of semivolatile organics [J]. Environmental Science & Technology, 40: 2635 - 2643.
Greenwald R, Bergin M H, Xu J, et al. 2006. The infl uence of aerosols on crop production: A study using the CERES crop model [J]. Agricultural Systems, 89: 390 - 413.
Guinot B, Cachier H, Sciare J, et al. 2007. Beijing aerosol: atmospheric interactions and new trends [J]. Journal of Geophysical Research: Atmospheres, 112, D14314, doi: 10.1029/2006JD008195.
He H, Tie X X, Zhang Q, et al. 2015. Analysis of the causes of heavy aerosol pollution in Beijing, China: A case study with the WRF-Chem model [J]. Particuology, 20: 32 - 40. He K, Yang F, Ma Y, et al. 2001. The characteristics of PM2.5in Beijing, China [J]. Atmospheric Environment, 35: 4959 - 4970.
Li G, Bei N, Tie X X, et al. 2011a. Aerosol effects on the photochemistry in Mexico City during MCMA-2006/ MILAGRO campaign [J]. Atmospheric Chemistry and Physics, 11: 5169 - 5182.
Li G, Lei W, Bei N, et al. 2012. Contribution of garbage burning to chloride and PM2.5in Mexico City [J]. Atmospheric Chemistry and Physics, 12: 8751 - 8761.
Li G, Lei W, Zavala M, et al. 2010. Impacts of HONO sources on the photochemistry in Mexico City during the MCMA-2006/MILAGO campaign [J]. Atmospheric Chemistry and Physics, 10: 6551 - 6567.
Li G, Zavala M, Lei W, et al. 2011b. Simulations of organic aerosol concentrations in Mexico City using the WRFCHEM model during the MCMA-2006/MILAGRO campaign [J]. Atmospheric Chemistry and Physics, 11: 3789 - 3809.
Robinson A L, Donahue N M, Shrivastava M K, et al. 2007. Rethinking organic aerosols: semivolatile emissions and photochemical aging [J]. Science, 315: 1259 - 1262.
Seinfeld J H, Pandis S N. 2006. Atmospheric chemistry and physics-from air pollution to climate change (2nd Edition) [M]. New Jersey: John Wiley & Sons: 703 - 707.
Shen Z, Cao J J, Arimoto R, et al. 2009. Ionic composition of TSP and PM2.5during dust storms and air pollution episodes at Xi’an, China [J]. Atmospheric Environment, 43: 2911 - 2918.
Skamarock W C. 2004. Evaluating mesoscale NWP models using kinetic energy spectra [J]. Monthly Weather Review, 132: 3019 - 3032.
Stein U, Alpert P. 1993. Factor separation in numerical simulations [J]. Journal of the Atmospheric Sciences, 50: 2107 - 2115.
Tie X X, Zhang Q, He H, et al. 2015. A budget analysis of the formation of haze in Beijing [J]. Atmospheric Environment, 100: 25 - 36.
Yang F, Tan J, Zhao Q, et al. 2011. Characteristics of PM2.5speciation in representative megacities and across China [J]. Atmospheric Chemistry and Physics, 11: 5207 - 5219.
Zhang L, Wang T, Lü M Y, et al. 2015b. On the severe haze in Beijing during January 2013: Unraveling the effects of meteorological anomalies with WRF-Chem[J]. Atmospheric Environment, 104, 11 - 21.
Zhang Q, Quan J, Tie X X, et al. 2015a. Effects of meteorology and secondary particle formation on visibility during heavy haze events in Beijing, China [J]. Science of the Total Environment, 502: 578 - 584.
Zhang Q, Streets D G, Carmichael G R, et al. 2009. Asian emissions in 2006 for the NASA INTEX-B mission [J]. Atmospheric Chemistry and Physics, 9: 5131 - 5153.
Zhang R, Jing J, Tao J, et al. 2013. Chemical characterization and source apportionment of PM2.5in Beijing: seasonal perspective [J]. Atmospheric Chemistry and Physics, 13: 7053 - 7074.
Zhang R Y, Li G, Fan J W, et al. 2007. Intensifi cation of Pacifi c storm track linked to Asian pollution [J]. Proceedings of the National Academy of Sciences of the United States of America, 104: 5295 - 5299.
Zhao P, Dong F, Yang Y, et al. 2013. Characteristics of carbonaceous aerosol in the region of Beijing, Tianjin, and Hebei, China [J]. Atmospheric Environment, 71: 389 - 398.
Simulating the transport and source of PM2.5during hazy days in the Guanzhong Basin, China
LI Guohui1,2, FENG Tian2,3
(1. Key Laboratory of Aerosol Chemistry & Physics, Chinese Academy of Sciences, Xi’an 710061, China; 2. State Key Laboratory of Loess and Quaternary Geology, Institute of Earth Environment, Chinese Academy of Sciences, Xi’an 710061, China; 3. School of Human Settlements and Civil Engineering, Xi’an Jiaotong University, Xi’an 710054, China)
Background, aim, and scope Fine particulate matters (PM2.5) or aerosols contribute to regional and global climate changes directly by absorbing and scattering the solar radiation and indirectly by serving as cloud condensation nuclei (CCN) and ice nuclei (IN) to modify cloud properties. Elevated aerosols also reduce the visibility of the atmosphere and exert deleterious impacts on air quality, ecosystems, and human health. The Guanzhong Basin is located in northwestern China and nestled between the Qinling Mountain in the south and the Loess Plateau in the north, with a warmhumid climate. The rapid increasing industries and city expansions, as well as the unique topography, have caused frequent occurrence of haze in the basin, which has been drawing more attention to clarify the haze sources, formation, and influences. The purpose of the present study is to investigate the formation and source apportionments of ambient PM2.5and the mutual infl uences of the east (Xi’an and surrounding area) and west (Baoji and surrounding area) part of the Guanzhong Basin during springtime(14 to 16 February 2014) using the WRF-CHEM model. Materials and methods A specifi c version of the WRF-CHEM model is utilized to investigate the organic aerosol formation in Guanzhong Basin. This version employs a fl exible gas-phase chemical module and the CMAQ (version 4.6) aerosol module developed by US EPA. The dry deposition of chemical species is parameterized according to and the wet deposition follows the method in CMAQ. The FTUV module considering the impacts of aerosols and clouds on photochemistry is used to calculate the photolysis rates. The ISORROPIA Version 1.7 (http:// nenes.eas.gatech.edu/ISORROPIA/) is employed to the WRF-CHEM model to simulate the inorganic aerosols. The NCEP 1°×1° reanalysis data are involved for the meteorological initial and boundary conditions. The chemical initial and boundary conditions are interpolated from MOZART output with a 6-hour interval. The anthropogenic emission inventory (EI) including agriculture, industry, power plant, residential, and transportation sources is developed by Zhang et al (2009). The MEGAN model is used to on-line calculate the biogenic emissions in the WRF-CHEM model. The Factor Separation Approach (FSA) is adopted to analyze the source apportionment of ambient PM2.5and the mutual infl uences of the east (Xi’an and surrounding area) and west (Baoji and surrounding area) part of the basin. Results The near-surface wind speeds and directions are reasonably replicated. The temporal variation and spatial evolution of urban PM2.5over Xi’an and Baoji are well reproduced, which indicates a reasonable replication of the event. Discussion Sensitivity studies show that the PM2.5formed from the east part of the Guanzhong Basin (Xi’an and surrounding area) significantly influences the air quality over the west part of the basin (Baoji and surrounding area) with a contribution of 30% to the near-surface PM2.5levels. Conclusions During the heavy air pollution process, the prevailing westward wind that entrains a great amount of pollutants from Xi’an and surrounding areas and contaminates the air quality over Baoji. The source apportionment analysis reveals the contributions from each emission source in the Guanzhong Basin during February. The residential emission constitutes the most with a contribution of over 40%, while the transportation emission only contributes less than 10%, which indicates that vehicles play a minor role during heavily hazy days. Recommendations and perspectives Ambient gas-phase species and PM2.5compositions should be included in future studies to give a more flexible simulation and better present the evolution of haze events.
air pollution; PM2.5; WRF-CHEM
LI Guohui, E-mail: ligh@ieecas.cn
10.7515/JEE201604009
2016-03-09;录用日期:2016-05-22
Received Date:2016-03-09;Accepted Date:2016-05-22
国家自然科学基金项目(41275153);中国科学院“百人计划”项目
Foundation Item:National Natural Science Foundation of China (41275153); “Hundred Talent Program” of Chinese Academy of Sciences
李国辉,E-mail: ligh@ieecas.cn
