The Fishery Industrial Structure in China Based on the Application of Shift-Share Analysis
2016-01-12
School of Economics and Trade, Nanjing Audit University, Nanjing 211815, China
1 Introduction
China has become the top producing and consuming country of fishery products in the world and the position of fishery industry in agriculture is more and more important. In the past thirty years, the production capacity of fisheries in China has continuously increased. Fish production quantities were 61.49 million tons in 2013 which were about thirteen times as large as the fishery production quantities in 1978 of 4.65 millions tons. With the rapid growth of the economy, consumption of fishery products has been rising over time. Per capita consumption of aquatic products has risen over the last two decades which was 5.84 kg and 15.25 kg in rural and urban areas in 2013, and only 1.28 kg and 7.2 kg in 1981. In addition, the proportion of fishery economic output value to the agricultural economic output value increased to 10% in 2013 from only 1.6% in 1978. Therefore, China’s fishery industry has become one of most rapidly growing sectors within agriculture and has great potential for continued high growth in fishery and for making a substantial contribution to the national agricultural economy. The rapid increase of fish production capacity in China is due to the optimization of its fishery industrial structure. Since the 1980s, the Chinese government has pursued an objective to rationally use and restore aquatic natural resources. It also established a development policy of aquaculture fisheries. The traditional industrial structure was adjusted from a catching fishery industrial structure to an aquaculture production structure. The development of this fishery industrial structure has improved use of inland waters and wasteland. Fishery production capacity has increased rapidly and has maintained an effective supply of fish products, easing the pressure on coastal fishery resources to some extent. Some scholars have paid attention to the fishery industry structure in China. Xin Geetal. (2003) employed the method of Moore structure change value to analyze the correlation between the fishery industry structure and its quantity growth. The study results prove that the fishery structure is one of sources of fishery quantity growth[1]. Hongjun Zhouetal. (2005) and Zenglin Hanetal. (2007) studied the marine fishery structure in China and in Liaoning Province, respectively. The study results indicate that marine fishery is important to the development of the fishery industry in China, and the growth rate and structure level of marine fishery industry are low in Liaoning Province[2-3]. Xueda Shenetal. (2007) studied the fishery structure in Shanghai and found that the development of aquaculture was fast, but the development of fish processing and marketing sector was slow, and they drew the conclusion that the demand structure of aquatic products was key to the change of fishery industrial structure[4]. Ningning Li (2008) utilized a gray dynamic correlation method to study the fishery structure in China and found that aquaculture made the largest contribution to the fishery industry growth, followed by fish processing sector and fish capture sector[5]. A review of the literature of China’s fishery industry indicates that only a few studies have been concerned about the regional fishery structure. Therefore, the purpose of this paper is to take the main fishery production regions as the study objects and examine the fishery industrial structure and investigate the correlation between the fishery industry economic growth and the fishery industrial structure. The study results will be important for understanding how to adjust the regional fishery industrial structure, optimize resource allocation and enhance the competitiveness.
2 Method and data
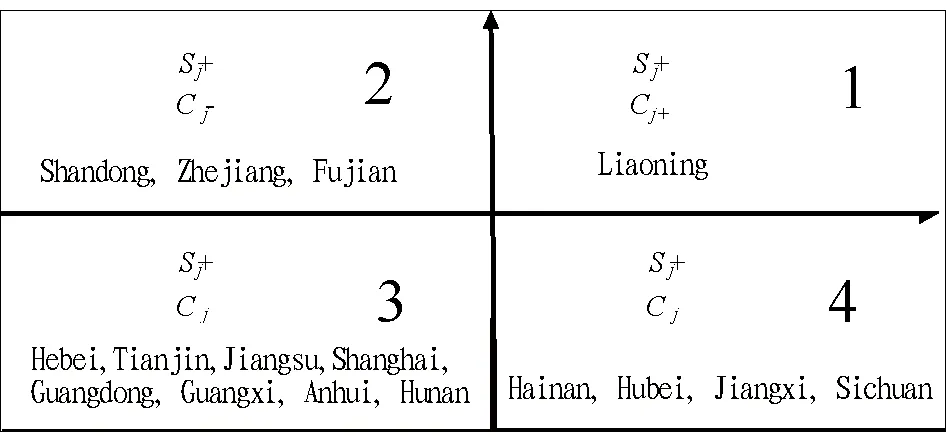
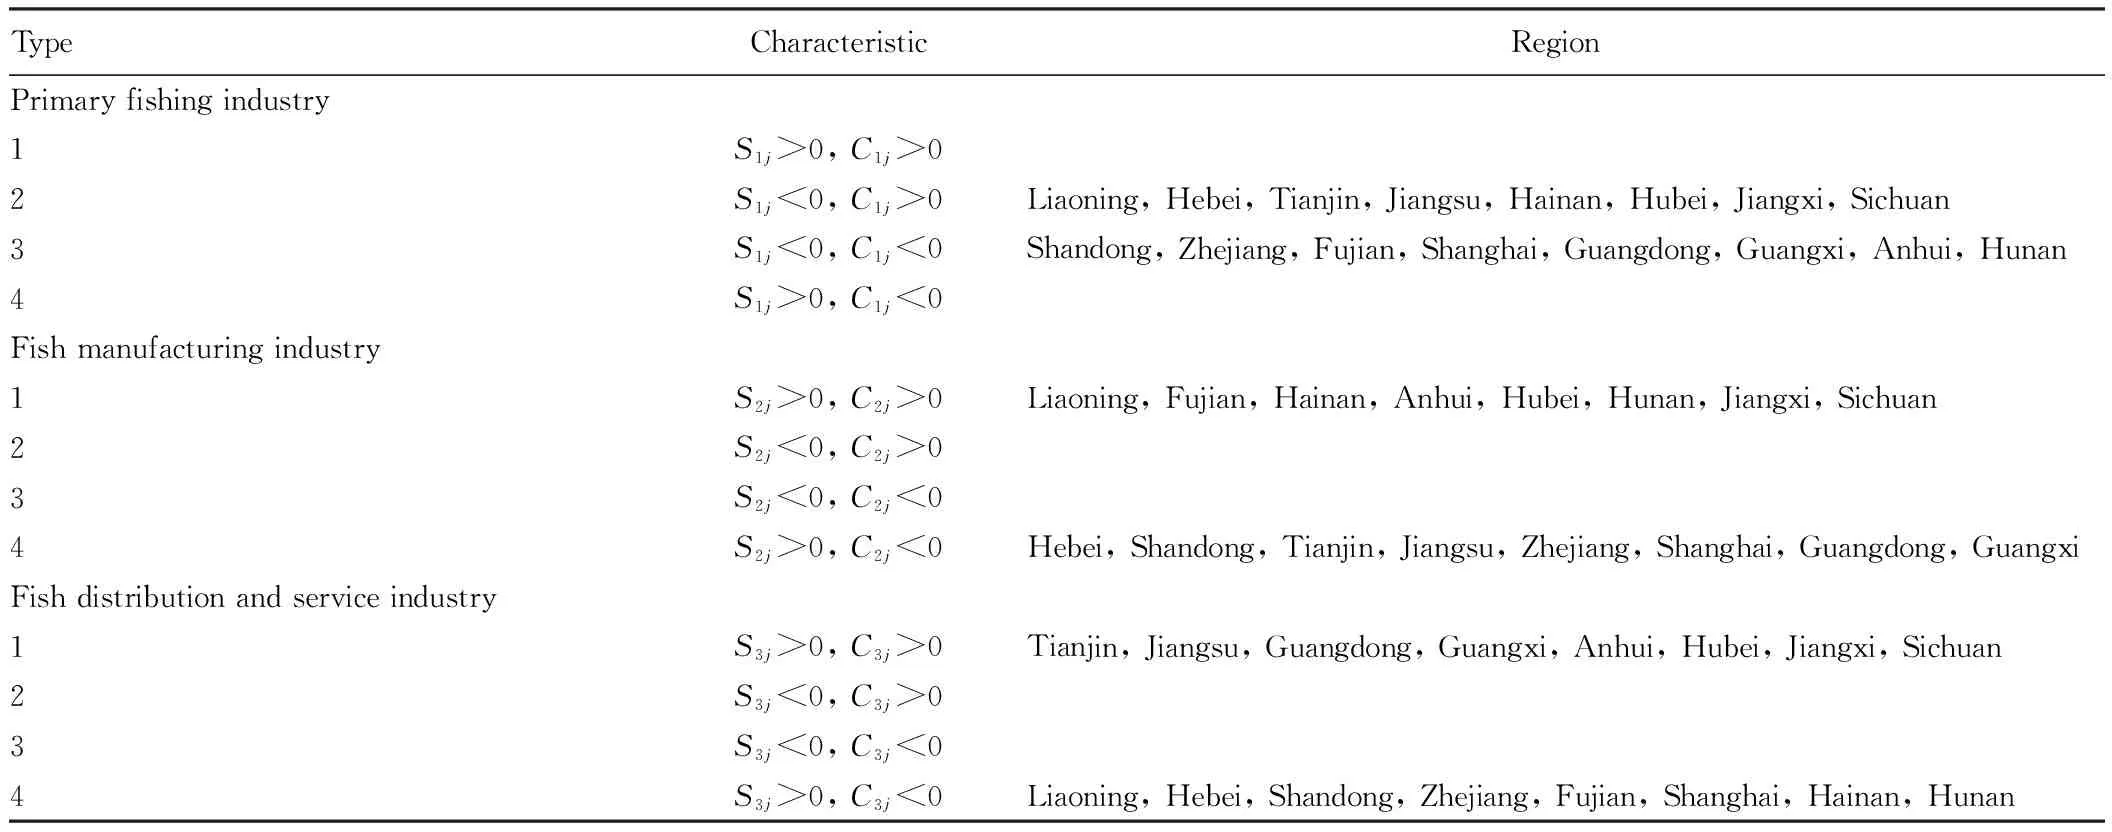
2.1Shift-shareanalysisThe relationship between regional growth and industrial structure is often analyzed and decomposed into various effects, with a technique known as shift-share analysis (Herzog, Henry W., Jr. and Richard J. Olsen., 1977)[6]. The shift-share analysis method was originated by Daniel Creamer[7]in the 1940s and further developed and employed as an analytic tool by Dunn[8], Ashby[9], and Fuchs[10]during the early 1960s. Despite its limitations, this technique has been instrumental in examining the relationship between regional economic growth and industrial composition (Christos C. Paraskevopoulos 1974, p.121)[11]. In recent years, shift-share analysis has been widely used in many domains and continues to be popular among planners, geographers and regional researchers[12-16]. Additionally, policy-makers, who often have need of quick, inexpensive analysis tools that are neither mathematically complex nor data-intensive, also utilize shift-share extensively (Wei Chenetal., 2007)[17]. All these characteristics are suitable to be as analytic tool to study the regional fishery industry structure in China. The shift-share equation is an identity which decomposes the growth of a regional variable (fishery industry economic output value, in this paper) into three components that measure differential growth among regions. Given information by industrial sectors for one of these regional variables at two points in time, the technique divides the change,D, over the time period into the following shares: the national growth,N, the industry-mix,S, and the competitive position,C, for industry or sector i in regionj.
Dij=Nij+Sij+Cij
(1)
The analysis is applied to fishery industry economic output value,D, then
Dij=Rij(T1)-Rij(T0)
(2)
Nij=Rij(T0)rChina
(3)
Sij=Rij(T0)(ri,China-rChina)
(4)
Cij=Rij(T0)(rij-ri,China)
(5)
whererij,ri,ChinaandrChinarepresent regional and national growth rates as follows:
rij=[Rij(Tt)-Rij(T0)]/Rij(T0)
(6)
ri,China=[Ri(Tt)-Ri(T0)]/Ri(T0)
(7)
rChina=[R(T1)-R(T0)]/T(T0)
(8)
The fishery industry economic output value is applied as the indicator of regional economic change in this study. According toChinaFisheriesYearbook, the fishery industry economic output value is decomposed into three components: the production (fishing) sector output value, the fish processing (manufacturing) sector output value, and fish marketing (distribution) sector output value.Rij(T) denotesTperiod’s output value in theithfishery sector in regionj,Ri(T) denotesTperiod’s output value ofithfishery sector in China andR(T) denotesTperiod’s total fishery industry economic output value. TheRi(T) andR(T) are written as:
(9)
(10)
AndT0represents the base (beginning) research period andT1represents the terminal (end) research period. For any region the national growth (3), industry-mix (4) and competitive position (5) can be evaluated for a specific fishery industrial sector i or summed over all sectors and evaluated for the entire region. The shift-share equation, national growth share equation, industrial-mix share equation and competitive position share equation for fishery sectoriin thejthregion are as follows:
Dij=Rij(T0)rChina+Rij(T0)(ri,China-rChina)+Rij(T0)(rij-ri,China)
(11)
(12)
(13)
(14)
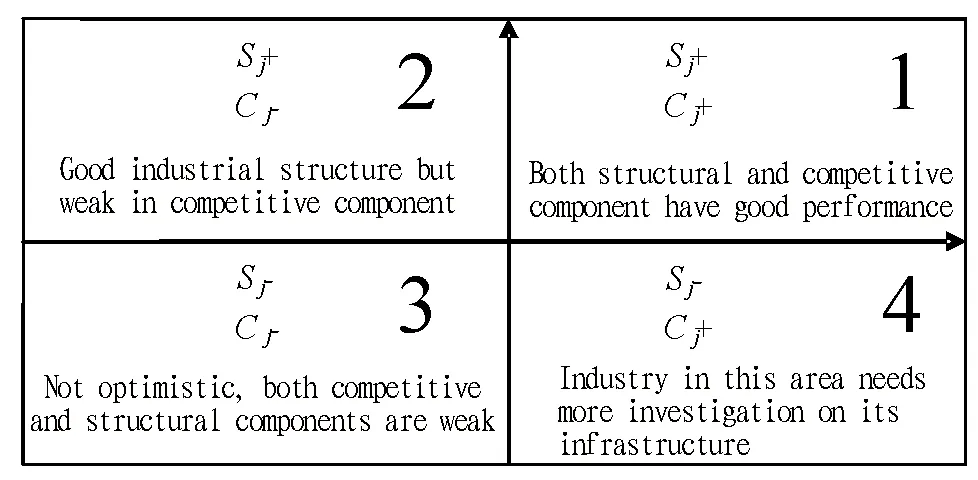
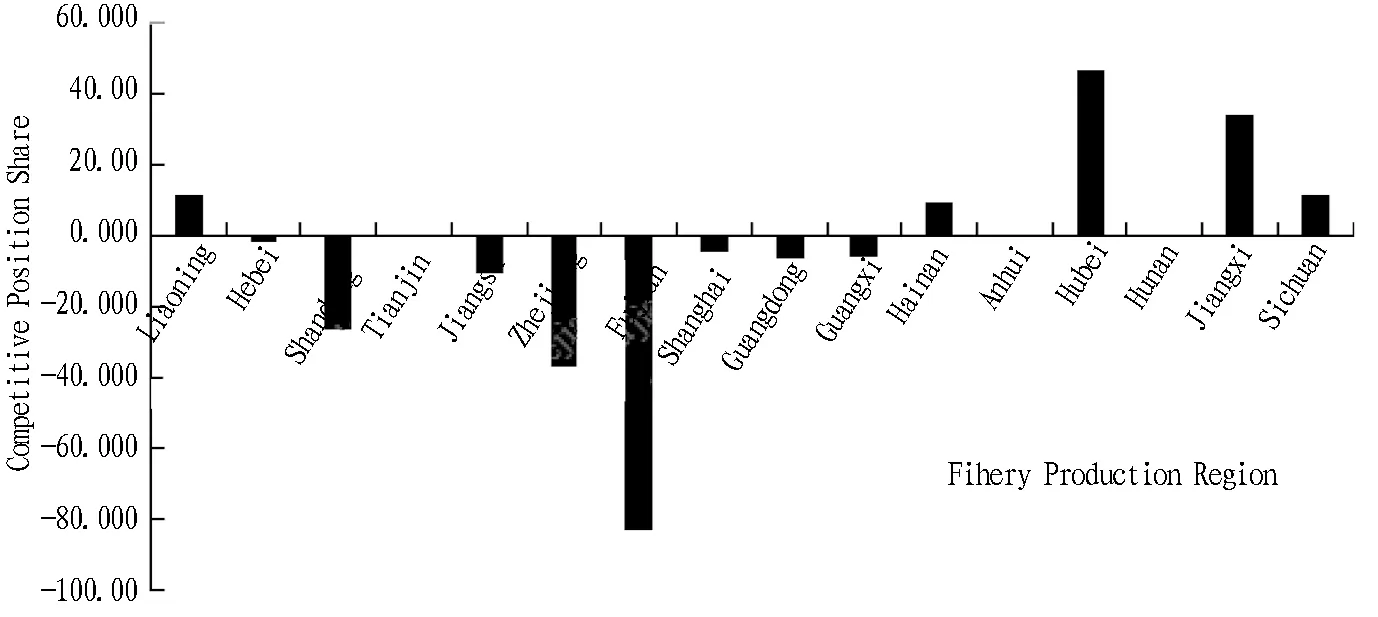
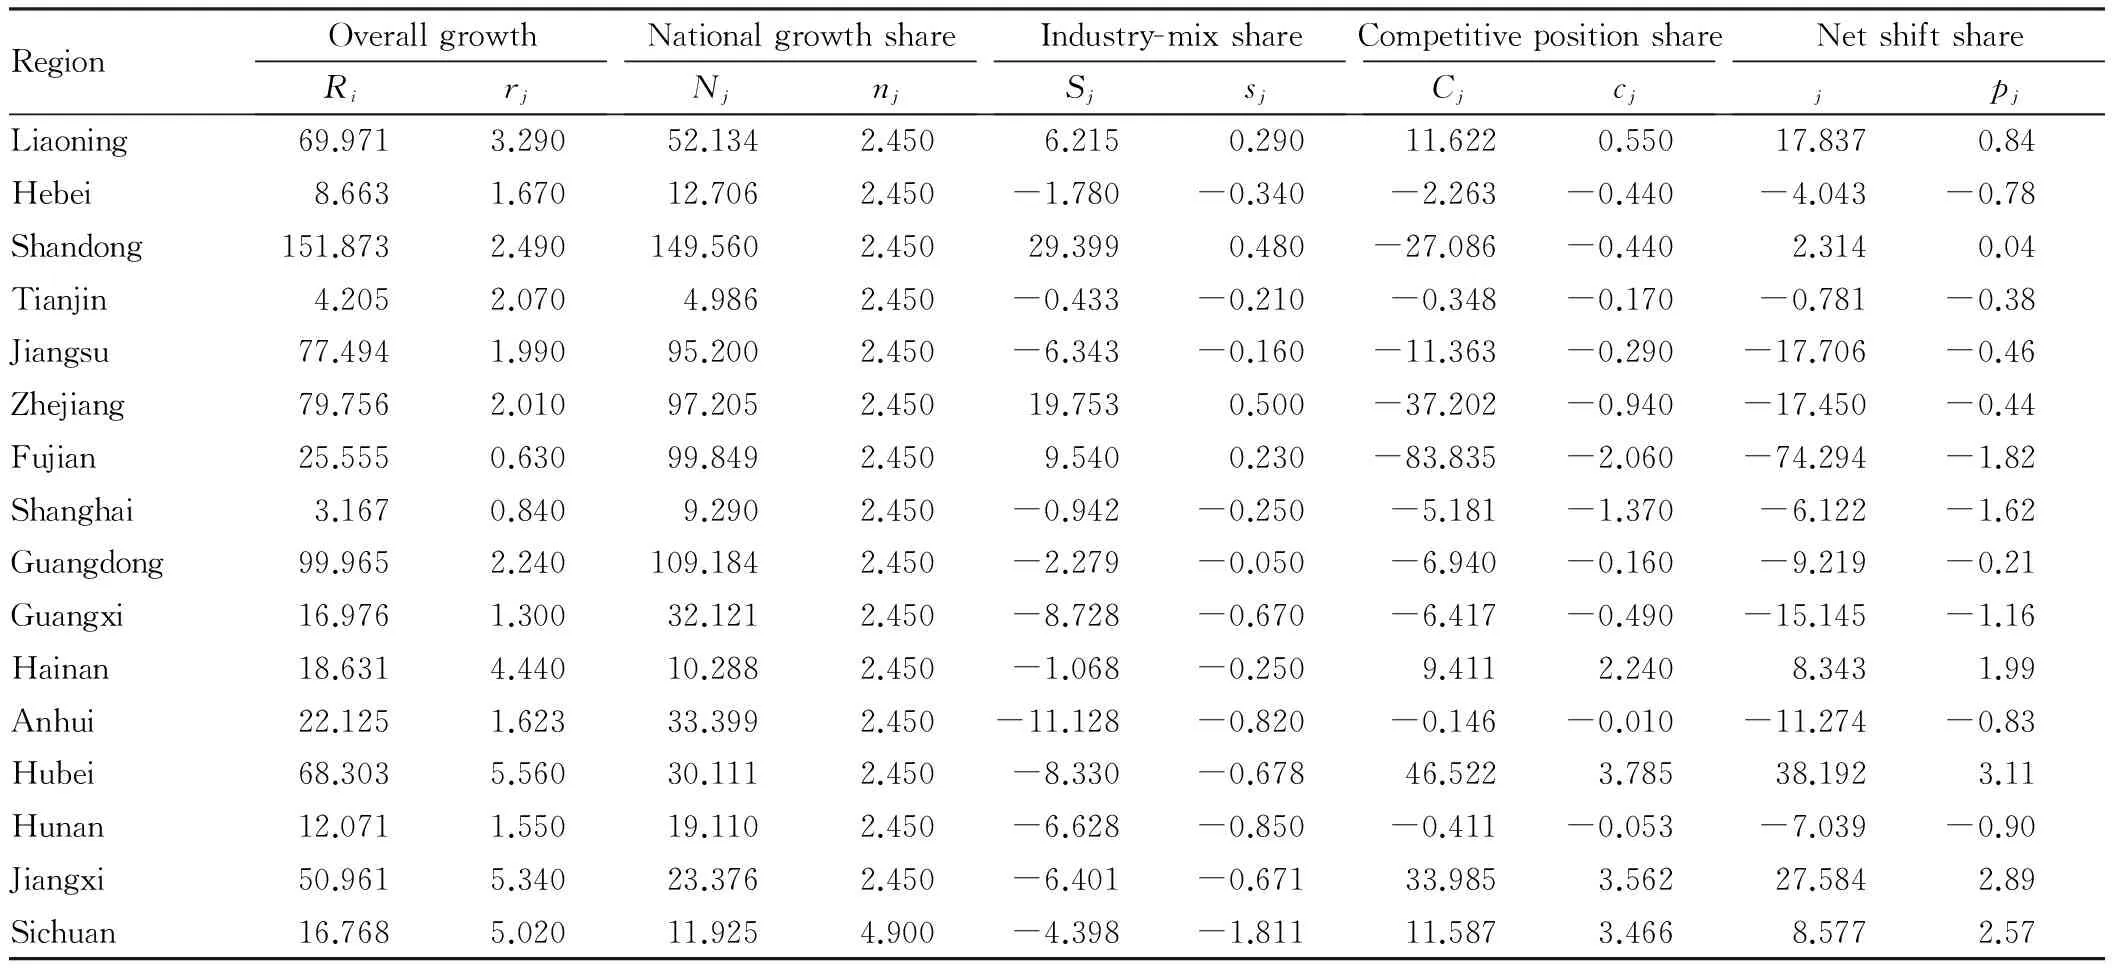
This national growth share,Nij, measures the potential change of local fishery economic growth, assuming the local fishery economy is similar to the national fishery economy. It indicates how much the regional fishery economy would have grown in each fishery sector if they all grow at the same rate as the national fishery economy. This means that if the nation as a whole is experiencing fishery economic growth (decline), one would expect to have positive (negative) growth in the regional fishery economy. The industry-mix share,Sij, indicates that the ith fishery sector output value in regionjincreases (decreases) with the national ith fishery sector output value increase (decrease) and its value also represents the role of regional fishery industrial structure to the regional economic growth. The industry-mix share for the ith fishery sector will be positive in all regions if fishery sector i output value grows faster than national fishery output value, both are measured at the national level (ri,China>rChina) and the regional fishery industrial structure is advantageous. Likewise, the industry-mix share will either vanish or turn negative ifri,China≤rChina. The competitive position share,Cij, reflects the advantage or disadvantage of ith fishery sector development in regionjin comparison with nation’s and its value can provide quantitative basis to study the advantage and disadvantage of regional fishery industry development. The competitive position share for fishery sectoriin thejthregion will be positive, zero, or negative depending on whether regional fishery output value in this sector is faster than (rij>ri,China), equal to (rij=ri,China), or slower than (rij If each of the shift-share components is summed over all sectors, the shift-share equation of all fishery sectors in regionjis written as: (15) The total industry-mix share will be positive (negative) in regions with above average proportion of output value in sectors with rapid (static or declining) growth at the national level. If regionj’s total structural share (Sj) is greater than 1, regionj’s aggregate fishery industrial structure is good, in which healthy fishery sectors take a large share. Likewise, the competitive position share will be positive (negative) in regions where output value grows faster (slower) than the industry-mix would suggest. If the regionj’s total competitive position share (Cj) is greater than 1, most sectors in regionjdevelop actively and have a good growth rate. Therefore, we choose the value ofSjas ordinate and the value ofCjas abscissa, the classification of four types of regional industrial structure is shown below. We then calculate the growth rate of total regional fishery economic growth (rj), national share (nj), industry-mix share (sj), and competitive position share (cj) in thejth region. Therj(T1, 0) is the sum of these rates. This is written as: (16) The final step is to measure the net shift (Pj) and the growth rate of the net shift (pj). The net shift is also equal to the sum of the shares of industry-mix and competitive position and the growth rate of the net shift is also equal to the sum of the growth rate of the industry-mix share and competitive position share, written as follows: Pj=Sj+Cj (17) pj-si+ci (18) 2.2DatasourcesMarine fishery regions are mainly distributed in eleven provinces of mainland China, which include the regions around Yellow Sea and Bohai Sea zone where there are three provinces and one municipality (Liaoning, Hebei, Shandong, and Tianjin); regions around the East Sea zone include three provinces and one municipality (Jiangsu, Zhejiang, Fujian and Shanghai), and regions around the South Sea zone include two provinces and one autonomous region (Guangdong, Hainan, Guangxi). Inland fishery regions are mainly distributed along the Yangtze River and Pearl River Delta zone, which include Hubei, Hunan, Anhui, Jiangxi, Sichuan, Jiangsu, Guangdong, Zhejiang and other provinces[1]. The paper includes sixteen main fish production regions of China which have been listed above as study objects[2]. The study will analyze the fishery industrial structure in main fish production regions by the shift-share analysis method and year 1997 as the base period and year 2013 as the end period. The data for the study are fromChinaFisheriesYearbook. 3.1Theshift-shareanalysisoffisheryindustrialstructureFirstly, the fishery industry economic output value grew, but it also expanded in the sixteen fishery production regions of China from 1997 to 2013, which indicates that the fishery economy is broadly developed. With regard to the increment of fishery industry economic output value, the largest growth scale is in Shandong which increased by 151.873 billion yuan, while the lowest growth rate is in Shanghai which increased by only 3.167 billion yuan. As to the growth rate of fishery industry economic output value, the largest is in Hubei which grew by 5.56% and lowest growth rate is in Fujian at only 0.63%. Secondly, the values of national growth share in all studied fishery production regions are positive, which indicates that the national fishery industry as a whole is experiencing growth and has the positive growth in the regional fishery economy. And the national growth share measures the extent to which each region is able to benefit from the national economic growth. When the region’s national growth share is larger than the overall national economic growth, it reflects that the economic growth in this region is stronger than the national growth and it has benefited more than proportionally from the result of the national growth. Table 1 shows that the increment of national growth share is larger than overall growth of nation fishery in nine provinces-Hebei, Tianjin, Jiangsu, Zhejiang, Fujian, Shanghai, Guangdong, Guangxi, Anhui, and Hunan. This indicates that the fishery industry growth in these ten provinces is associated more than proportionately by the national fishery growth. Thirdly, the values of industry-mix share are positive in these four provinces-Liaoning, Shandong, Zhejiang and Fujian. The largest industry-mix value is in Shandong which is 29.399 billion yuan, followed by Zhejiang, Fujian, and Liaoning. All the four regions’ total structural share is greater than 1, which reflects that all regions’ aggregate fishery industrial structure is good. Regions where industrial-mix share value is negative are found in the other twelve provinces, which implies that the fishery industry growth performance is lagging behind the overall economic growth of these twelve provinces (See Fig. 2). Lastly, the competitive position share values are positive for the five regions of Liaoning, Hainan, Hubei, Jiangxi, and Sichuan, reflecting that the fishery industry in these five regions is more efficient than in other regions in the rest of the nation. And the competitive position share is a key factor that reflects the regional industry competitiveness. In addition, total competitive position share is greater than 1 in the regions of Liaoning, Hainan, Hubei, Jiangxi, and Sichuan, which indicates that most fishery sectors in these five regions develop actively and have a good growth rate (See Fig. 3). According to these results, we can divide the provinces into four categories in terms of their regional fishery industrial economic growth (see Fig.4). Type 1: The values of industry-mix share and competitive position share are both positive, like in Liaoning. It implies that the fishery industry economic growth in Liaoning resulted from the factors of the industrial structure and competitiveness of fishery industry from 1997 to 2009. In addition, Liaoning has achieved a strong fishery industrial structure from the overall fishery growth and the competitiveness of fishery industry structure relative to others. Type 2: Good industrial structure but weak competitive component. Therefore, the fishery economic growth is driven by the industry structure other than other factors, such as Shandong, Zhejiang, and Fujian. Type 3: Both competitive and structural components are weak. The values of competitive position share and industry-mix share in Hebei, Tianjin, Jiangsu, Shanghai, Guangdong, Guangxi, Anhui, and Hunan are negative, which reflects that the contribution of industry structure and competitiveness to fishery economic growth are negative and the effect is adverse on the share of these provinces in the growth of China’s fishery industry. Type 4: The role of industrial structure in fishery economic growth is not obvious. However, competitiveness position is obvious. The fishery industrial economic growth in these provinces, such as Hainan, Hubei, Jiangxi, and Sichuan are mainly due to the other factors other than their fishery industrial structure. Fig.1 Four types of regional industrial structure Fig.2 Industry-mix share value in main fishery production regions of China from 1997 to 2013 Unit: Billon yuan Fig.3 Competitive position share value in main fishery production regions of China from 1997 to 2013 Unit: Billon yuan 3.3Theshift-shareanalysisofeachfisherysectorstructure 3.3.1Fish production sector. As shown in Table 2, the national growth share values of the fish production sector (N1j) in all sixteen regions are positive, which indicates that the national fish production sector as a whole is experiencing economic growth and these sixteen regions have positive growth in the regional fishery industry economy. Further, the national share increments of fish production sector in these studied regions are all greater than the increments of fish processing (manufacturing) sector and fish marketing (distribution) sector. It reflects that the fish production sector is accounting for a large proportion in fishery industry. The industry-mix component increments (S1j) in all studied regions are negative, reflecting that fish production sector output value in these regions decreases with the nation’s output value decrease and the fish production sector industry-mix share will vanish. Additionally, the decrement of Shandong is the most, losing 30.567 billion yuan, indicating that the structure of fish production sector in Guangdong is at a disadvantage. Opposite to Shandong, Tianjin has a relative advantage in the industry-mix share which lost 1.324 billion yuan. The competitiveness position share values are positive for Liaoning, Hebei, Tianjin, Jiangsu, Hainan, Hubei, Jiangxi, and Sichuan, reflecting that obvious advantages of fish production sector development in these regions in comparison with the nation’s and regional fish production sector grow faster than national level (see Table 1 and Table 2). Table1ChinesefisheryindustryshiftshareanalysisbyregionUnit: 109yuan, % RegionOverallgrowthRirjNationalgrowthshareNjnjIndustry-mixshareSjsjCompetitivepositionshareCjcjNetshiftsharejpjLiaoning69.9713.29052.1342.4506.2150.29011.6220.55017.8370.84Hebei8.6631.67012.7062.450-1.780-0.340-2.263-0.440-4.043-0.78Shandong151.8732.490149.5602.45029.3990.480-27.086-0.4402.3140.04Tianjin4.2052.0704.9862.450-0.433-0.210-0.348-0.170-0.781-0.38Jiangsu77.4941.99095.2002.450-6.343-0.160-11.363-0.290-17.706-0.46Zhejiang79.7562.01097.2052.45019.7530.500-37.202-0.940-17.450-0.44Fujian25.5550.63099.8492.4509.5400.230-83.835-2.060-74.294-1.82Shanghai3.1670.8409.2902.450-0.942-0.250-5.181-1.370-6.122-1.62Guangdong99.9652.240109.1842.450-2.279-0.050-6.940-0.160-9.219-0.21Guangxi16.9761.30032.1212.450-8.728-0.670-6.417-0.490-15.145-1.16Hainan18.6314.44010.2882.450-1.068-0.2509.4112.2408.3431.99Anhui22.1251.62333.3992.450-11.128-0.820-0.146-0.010-11.274-0.83Hubei68.3035.56030.1112.450-8.330-0.67846.5223.78538.1923.11Hunan12.0711.55019.1102.450-6.628-0.850-0.411-0.053-7.039-0.90Jiangxi50.9615.34023.3762.450-6.401-0.67133.9853.56227.5842.89Sichuan16.7685.02011.9254.900-4.398-1.81111.5873.4668.5772.57 Note: Chongqing became the municipality in 1997, and the value of Sichuan includes Chongqing. Table2Theshift-shareanalysisoffisherysectorstructureUnit: 109yuan RegionFishproductionsector(i=1)N1jS1jC1jFishprocessing(manufacturing)sector(i=2)N2jS2jC2jFishmarketing(distribution)sector(i=3)N3jS3jC3jLiaoning32.863-12.28314.95310.6544.7033.3178.61713.795-6.647Hebei10.437-3.9010.5711.3040.576-0.7510.9651.545-2.083Shandong81.783-30.567-4.88441.86218.478-2.76925.91541.488-19.433Tianjin3.542-1.3241.2301.2250.541-1.9630.2190.3500.386Jiangsu68.105-25.4553.11020.9289.237-17.7916.1689.8743.318Zhejiang54.026-20.193-10.92925.16711.108-2.23018.01228.837-24.043Fujian64.876-24.248-61.27219.1478.4520.23815.82625.337-22.801Shanghai7.417-2.772-2.1991.0060.444-0.4630.8661.386-2.519Guangdong80.199-29.975-15.08316.1337.121-1.35212.85220.5759.495Guangxi29.581-11.056-7.9041.5000.662-0.9751.0401.6652.462Hainan8.199-3.0657.8501.1620.5133.3590.9261.483-1.797Anhui32.179-12.027-7.4030.9080.4010.9700.3110.4996.287Hubei27.695-10.35118.4801.5930.7038.3460.8231.31719.697Hunan18.645-6.969-0.4510.3490.1540.0890.1170.187-0.050Jiangxi21.606-8.0752.7681.0000.4416.4980.7701.23324.719Sichuan11.855-4.4313.0940.0680.0302.6400.0020.0045.245 Note: Fish production sector includes the sub-sectors of marine capture, marine culture, inland capture, inland culture; fish processing (manufacturing) sector includes fish processing, fish fodder, fish pesticides and so on; fish marketing (distribution) sector includes fish distribution, fish tourism and fish transportation; Chongqing became the municipality in 1997, the value of Sichuan includes Chongqing. 3.3.2Fish processing (manufacturing) sector. The data in Table 2 show positive national growth share increment in all studied regions, and we can conclude that the result in the fish manufacturing industry (N2j) in studied regions is due to the development of the China’s fish processing (manufacturing) sector. The industry-mix share values of the fish processing (manufacturing) sector are positive in all studied regions, which implies in Table 2 that fish processing (manufacturing) sector grows faster than national growth and the regional fish processing (manufacturing) sector industrial structure in all these studied regions is advantageous (S2j). The largest increment is in Shandong which increased by 18.478 billion yuan, while the lowest increment is in Sichuan which increased by only 0.03 billion yuan, which indicates that Shandong has the strongest advantageous within fish processing (manufacturing) sector and Sichuan is the weakest. With regard to the competitiveness of fish processing (manufacturing) sector (C2j), the values of competitive position share in Hebei, Shandong, Tianjin, Jiangsu, Zhejiang, Shanghai, Guangdong, and Guangxi less than zero show that regional fishery output value in this sector is slower than the national level. In addition, a positive competitive position share in Liaoning, Fujian, Hainan, Anhui, Hubei, Hunan, Jiangxi, and Sichuan which implies that the region’s fish processing (manufacturing) sector is more efficient than in other regions in the rest of the nation (see Table 2 and Table 3). 3.3.3Fish marketing (distribution) sector. Data show in Table 2 that the national growth share of fish marketing (distribution) sector in all studied provinces (N3j) is positive, which is due to the development of the national marketing (distribution) sector. The values of industry-mix share (S3j) are positive in all sixteen regions and the fish marketing (distribution) sector of these sixteen regions grow faster than national growth. Further, the regional fish marketing (distribution) sector industrial structure is advantageous, and Shandong has the most advanced industrial struc-ture and Sichuan has the least one. The values of competitive position share of fish marketing (distribution) sector (C3j) are positive in Tianjin, Jiangsu, Guangdong, Guangxi, Anhui, Hubei, Jiangxi, and Sichuan, which reflects the advantage of fish marketing (distribution) sector in these regions in comparison with nation’s. We can draw clear conclusions from Table 2 and Table 3 that the fish marketing (distribution) sector in Tianjin, Jiangsu, Guangdong, Guangxi, Anhui, Hubei, Jiangxi, and Sichuan is at an obvious strong advantage with regard to their industrial structure and competitiveness. Fig.4 Regional fishery industrial structure types Table3Differentfisherysectors’characteristicsindifferentmainfishproductionregions TypeCharacteristicRegionPrimaryfishingindustry1S1j>0,C1j>02S1j<0,C1j>0Liaoning,Hebei,Tianjin,Jiangsu,Hainan,Hubei,Jiangxi,Sichuan3S1j<0,C1j<0Shandong,Zhejiang,Fujian,Shanghai,Guangdong,Guangxi,Anhui,Hunan4S1j>0,C1j<0Fishmanufacturingindustry1S2j>0,C2j>0Liaoning,Fujian,Hainan,Anhui,Hubei,Hunan,Jiangxi,Sichuan2S2j<0,C2j>03S2j<0,C2j<04S2j>0,C2j<0Hebei,Shandong,Tianjin,Jiangsu,Zhejiang,Shanghai,Guangdong,GuangxiFishdistributionandserviceindustry1S3j>0,C3j>0Tianjin,Jiangsu,Guangdong,Guangxi,Anhui,Hubei,Jiangxi,Sichuan2S3j<0,C3j>03S3j<0,C3j<04S3j>0,C3j<0Liaoning,Hebei,Shandong,Zhejiang,Fujian,Shanghai,Hainan,Hunan The paper utilizes the shift-share analysis method to study the regional fishery industry structure in China. Four types of regional industrial structure exist in the fishery industry economic growth in China. Firstly, the development of fishery industry is driven by the fishery industrial structure and competitiveness advantage. Liaoning is typical of this type. Secondly, the fishery industrial structure promotes the fishery industry’s economic growth, but the competitiveness is weak, as evident in provinces such as in Shandong, Zhejiang, and Fujian. Thirdly, Both fishery industrial structure and competitiveness contributes to weak economic growth within the fishery industry, such as Hebei, Tianjin, Jiangsu, Shanghai, Guangdong, Guangxi, Anhui, and Hunan. Lastly, the structure of fishery industry promotes economic growth which has no significant effect, but a significant contribution to competitive factors in Hainan, Hubei, Jiangxi, and Sichuan. All three sectors-fish production, fish processing (manufacturing) and fish marketing (distribution) contribute to the development of the national fishery industry. The industrial structure of the fish production sector has no obvious advantage and the growth rate of this sector has slowed down in recent years, however, it also accounts for a large proportion within the fishery industry and continues to play a key role in the growth of fishery industry in China. These three sectors have emerged with a large potential for promoting China’s fishery industry growth, in particular the fish processing (manufacturing) and fish marketing (distribution). The local government should focus on improving and optimizing the industrial structure of fish production, and placing emphasis on development of the sectors of fish processing (manufacturing) and marketing (distribution) which can extend the value chain of fishing industry, and increase the added value of fishery products. The factors of industry-mix and competitive position have significantly different impacts on the growth of fishery industry in different main fishery production regions. In the region studied, Liaoning, Hebei, Tianjin, Jiangsu, Hainan, Hubei, Jiangxi, and Sichuan have the competitiveness advantage in the fish production sector. As to fish processing (manufacturing) sector, the provinces with obvious competitiveness advantage are Liaoning, Fujian, Hainan, Anhui, Hubei, Hunan, Jiangxi, and Sichuan. The provinces exhibit both obvious advanced industrial structure and competitiveness in the fish marketing (distribution) sector, such as Tianjin, Jiangsu, Guangdong, Guangxi, Anhui, Hubei, Jiangxi, and Sichuan. This study is one of the first comprehensive studies on the status of regional fishery industrial structure, and the competitiveness of regional fishery industry in China. However, the technique is not designed to explain how a region acquires particular industry mix (fishery industrial mix in this paper) or what attracts particular mixes to a region, therefore, the future research will pay close attention to studying what attracts particular mixes to a region and explaining or predicting the relationship between the fishery industrial structure and regional fishery industry growth. [1] GE X, ZHUANG XS, FU ZT,etal. The analysis of the relationship between fishery production quantities growth and the fishery industrial structure in China[J]. Chinese Fisheries Economics, 2003(5): 9-11. [2] ZHOU HJ, HE GS, WANG XH,etal. The analysis of ocean industrial structure and the optimized industrial policies in our country[J]. Marine Science Bulletin, 2005(2):46-51. [3] HAN ZL, DI DB, LIU K. The analysis of marine fishery industry structure in Laioning[J]. Journal of Liaoning Normal University (Natural science edition), 2007(1): 107-111. [4] SHEN XD, YANG ZY, PAN YJ. The study of fishery industry structure in Shanghai[J]. Journal of Shanghai Ocean University,2007(11): 597-601. [5] LI NN. The study of fishery industry structure in China: a grey system connection method[J]. Fisheries Economy Research, 2008(6): 3-5. [6] HENRY W, HERZOG J, RICHARD JO. Shift-share analysis revisited: The allocation effect and the stability of regional structure[J]. Journal of Regional Science, 1977, 17(3): 441-454. [7] CREAMER D. Shift to manufacturing industries[M]. Industrial Location and National Resources, U.S. National Resources Planning Board, Washington, D.C.,1943: 85-104. [8] DUNN ES. A statistical and analytical technique for regional analysis[S]. The Regional Science Association, Papers and Proceedings, Vol. VI, 1960: 97-112. [9] ASHBY LD. The shift and share analysis: A reply[J]. Southern Economic Journal, January, 1968: 423-425. [10] FUCHS VR. Statistical explanations of the relative shift of manufacturing among regions of the United States[N]. Papers of the Regional Science Association, 1962(8): 1-5. [11] PARASKEVOPOULOS CC. Regional growth patterns in Canadian manufacturing industry: An application of the shift and share analysis[J]. The Canadian Journal of Economics, 1974, 7 (1): 121-125. [12] SENF DR. Shift-share analysis of rural retail trade patterns[J]. Regional Science Perspectives, 1988,18(2): 29-43. [13] HOPPES, RB. Shift-share analysis for regional health care policy[J]. The journal of Regional Analysis and Policy, 1997, 27 (1): 35-45. [14] STEVENS BH, C MOORE. A critical review of the literature on shift-share as a forecasting technique[J]. Journal of Regional Science, 1978, 20 (4): 419-437. [15] SHI CY, ZHANG J, GAO W. The reviews of shift-share method and its expansion model[J]. Inquiry into Economic Issues, 2007(3): 133-136. [16] PA XF, LI MZ. The study of the regional agricultural industry structure: a shift-share analysis method[J].Journal of Agrotechnical Economics, 2008(3): 32-37. [17] CHEN W, XU JP. An application of shift-share model to economic analysis of county[J]. World Journal of Modelling and Simulation, 2007, 3 (2): 90-99.
3 Empirical analysis


4 Conclusions and discussions
杂志排行
Asian Agricultural Research的其它文章
- How to Improve the Teaching Quality of Plant Physiology?
- Overview of Ecological Toxicity of Potassium Chlorate Pollution
- Path Choice of Rural Land Transfer in China
- A Study on the Reform of China’s Agricultural Administration System
- The Application of Acidic Electrolyzed Water to Grape Cultivation in the Southern Regions
- Recent Advance in Division of Carbohydrate and Protein Fractions of Ruminant Feed and Their Metabolism in Digestive Tract
